Home > Comparison > Industrials > UNP vs NSC
The strategic rivalry between Union Pacific Corporation and Norfolk Southern Corporation shapes the U.S. railroads sector’s competitive landscape. Union Pacific operates a vast, capital-intensive network connecting key coasts with the Midwest, emphasizing broad industrial freight. Norfolk Southern runs a more concentrated, agile system focused on diversified goods and intermodal services. This analysis contrasts their operational models to identify which offers superior risk-adjusted returns for diversified portfolios amid evolving transportation demands.
Table of contents
Companies Overview
Union Pacific Corporation and Norfolk Southern Corporation stand as titans in the U.S. railroad sector, shaping freight transport dynamics.
Union Pacific Corporation: Leading U.S. Rail Freight Carrier
Union Pacific dominates the railroad industry with a vast 32,452-route-mile network linking key coasts and Midwest hubs. Its core revenue stems from transporting diversified goods including agricultural products, chemicals, coal, and intermodal containers. In 2026, it strategically focuses on optimizing network efficiency and expanding service reliability to enhance its competitive edge in freight logistics.
Norfolk Southern Corporation: Major Eastern U.S. Rail Operator
Norfolk Southern excels in rail transportation across 19,300 route miles, primarily serving the Eastern U.S. Its revenue engine revolves around moving raw materials, chemicals, metals, automotive products, and intermodal freight. The company’s 2026 strategy emphasizes strengthening intermodal operations and expanding port connectivity to capture growing demand in industrial and consumer goods transport.
Strategic Collision: Similarities & Divergences
Both railroads specialize in transporting diversified freight but differ in geographic footprint, with Union Pacific covering a broader western and central U.S. network versus Norfolk Southern’s eastern focus. Their competitive battleground centers on intermodal logistics and port access. Union Pacific’s scale offers operational leverage, while Norfolk Southern’s focus on intermodal growth defines distinct investment risk-reward profiles.
Income Statement Comparison
This data dissects the core profitability and scalability of both corporate engines to reveal who dominates the bottom line:
| Metric | Union Pacific Corporation (UNP) | Norfolk Southern Corporation (NSC) |
|---|---|---|
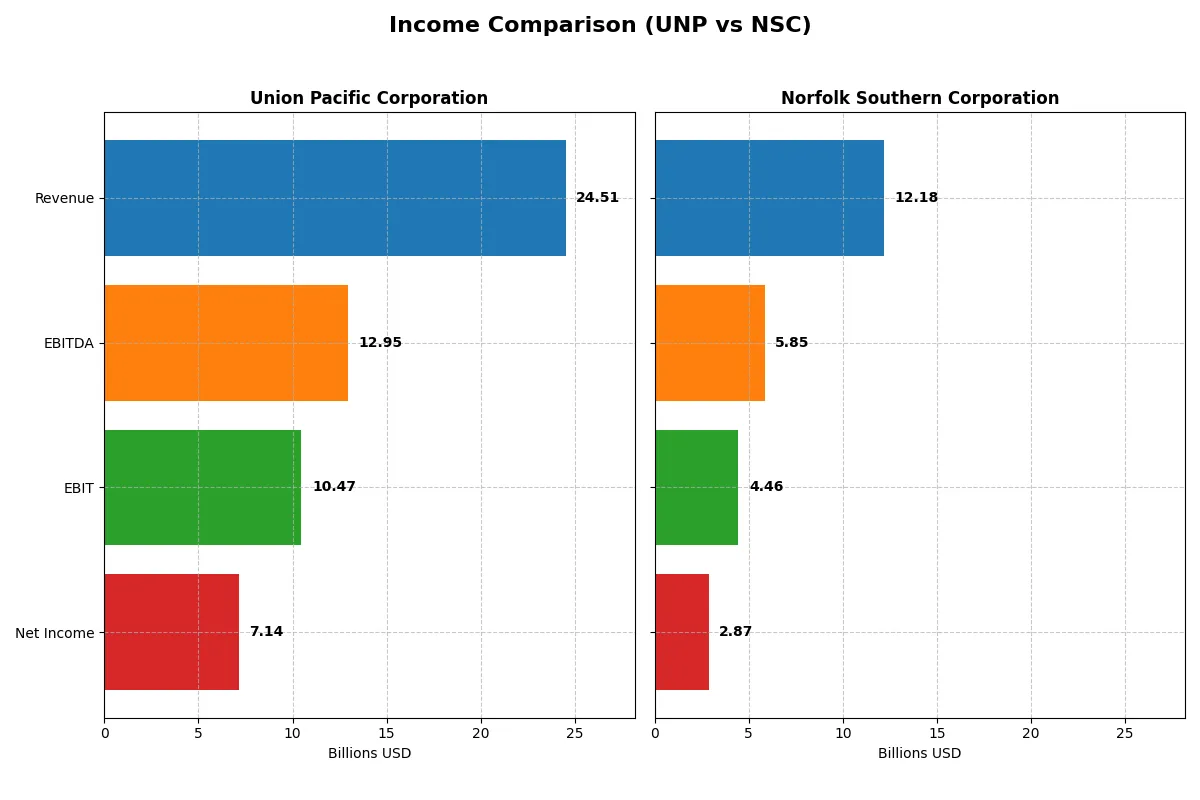
| Revenue | 24.51B | 12.18B |
| Cost of Revenue | 9.96B | 7.01B |
| Operating Expenses | 4.71B | 1.16B |
| Gross Profit | 14.55B | 5.17B |
| EBITDA | 12.95B | 5.85B |
| EBIT | 10.48B | 4.46B |
| Interest Expense | 1.31B | 0.79B |
| Net Income | 7.14B | 2.87B |
| EPS | 12.01 | 12.75 |
| Fiscal Year | 2025 | 2025 |
Income Statement Analysis: The Bottom-Line Duel
This income statement comparison reveals which company runs a more efficient and profitable corporate engine through recent fiscal results.
Union Pacific Corporation Analysis
Union Pacific’s revenue grew steadily from $21.8B in 2021 to $24.5B in 2025, with net income rising from $6.5B to $7.1B. The company maintains robust gross margins near 59.4% and a strong net margin of 29.1%. In 2025, UNP improved profitability with a 4.7% net margin increase and EPS growth of 7.9%, signaling solid operational momentum.
Norfolk Southern Corporation Analysis
Norfolk Southern’s revenue rose modestly from $11.1B in 2021 to $12.2B in 2025, despite a net income decline overall, finishing at $2.9B in 2025. Gross margin improved to 42.4%, and net margin reached 23.6%, reflecting consistent margin expansion. The latest year showed strong one-year gains in EBIT (+7.8%) and EPS (+10.2%), highlighting efficiency improvements amid slower top-line growth.
Margin Dominance vs. Earnings Momentum
Union Pacific commands superior scale and margin power, delivering nearly double Norfolk Southern’s revenue and significantly higher net income. Although Norfolk Southern exhibits stronger recent EPS and EBIT growth rates, its overall net income declined over five years. Union Pacific’s combination of size, margin strength, and steady profit growth makes it the more fundamentally robust profile for investors.
Financial Ratios Comparison
These vital ratios act as a diagnostic tool to expose underlying fiscal health, valuation premiums, and capital efficiency of the companies compared below:
| Ratios | Union Pacific Corporation (UNP) | Norfolk Southern Corporation (NSC) |
|---|---|---|
| ROE | 38.65% | 18.48% |
| ROIC | 11.70% | 7.47% |
| P/E | 19.20 | 22.59 |
| P/B | 7.42 | 4.17 |
| Current Ratio | 0.91 | 0.85 |
| Quick Ratio | 0.91 | 0.85 |
| D/E (Debt-to-Equity) | 1.72 | 1.10 |
| Debt-to-Assets | 45.65% | 37.77% |
| Interest Coverage | 7.52 | 5.06 |
| Asset Turnover | 0.35 | 0.27 |
| Fixed Asset Turnover | 0.41 | 0.00 |
| Payout Ratio | 45.33% | 42.29% |
| Dividend Yield | 2.36% | 1.87% |
| Fiscal Year | 2025 | 2025 |
Efficiency & Valuation Duel: The Vital Signs
Financial ratios serve as a company’s DNA, exposing hidden risks and operational strengths that raw numbers often mask.
Union Pacific Corporation
Union Pacific delivers a robust 38.65% ROE and a strong 29.12% net margin, signaling high profitability. Its P/E of 19.2 suggests a fairly valued stock, while a 7.42 PB ratio appears stretched. The company supports shareholders with a 2.36% dividend yield, reflecting steady income and disciplined capital allocation.
Norfolk Southern Corporation
Norfolk Southern posts a solid 18.48% ROE and a 23.59% net margin, demonstrating reasonable profitability. The P/E ratio at 22.59 indicates a slightly expensive valuation, while its 4.17 PB ratio also seems elevated. Dividend yield is modest at 1.87%, suggesting moderate shareholder returns amid cautious reinvestment.
Profitability Strength vs. Valuation Discipline
Union Pacific offers higher profitability and a more attractive dividend yield despite some valuation stretch. Norfolk Southern trades at a premium with lower returns and a weaker payout. Investors favoring operational strength may lean toward Union Pacific, while those prioritizing growth potential might consider Norfolk Southern’s profile.
Which one offers the Superior Shareholder Reward?
I see Union Pacific (UNP) delivers a more balanced shareholder return than Norfolk Southern (NSC). UNP pays a 2.36% dividend yield with a sustainable 45% payout ratio, backed by 59% free cash flow coverage. Its moderate buyback program further supports returns. NSC offers a slightly lower 1.87% yield with a 42% payout and full free cash flow coverage via buybacks, but its higher debt-to-equity ratio (1.10 vs. 1.72 for UNP) signals more financial risk. UNP’s distribution combines steady dividends and prudent buybacks, making its model more sustainable and attractive for investors seeking reliable total returns in 2026.
Comparative Score Analysis: The Strategic Profile
The radar chart reveals the fundamental DNA and trade-offs of Union Pacific Corporation and Norfolk Southern Corporation, highlighting their core financial strengths and vulnerabilities:
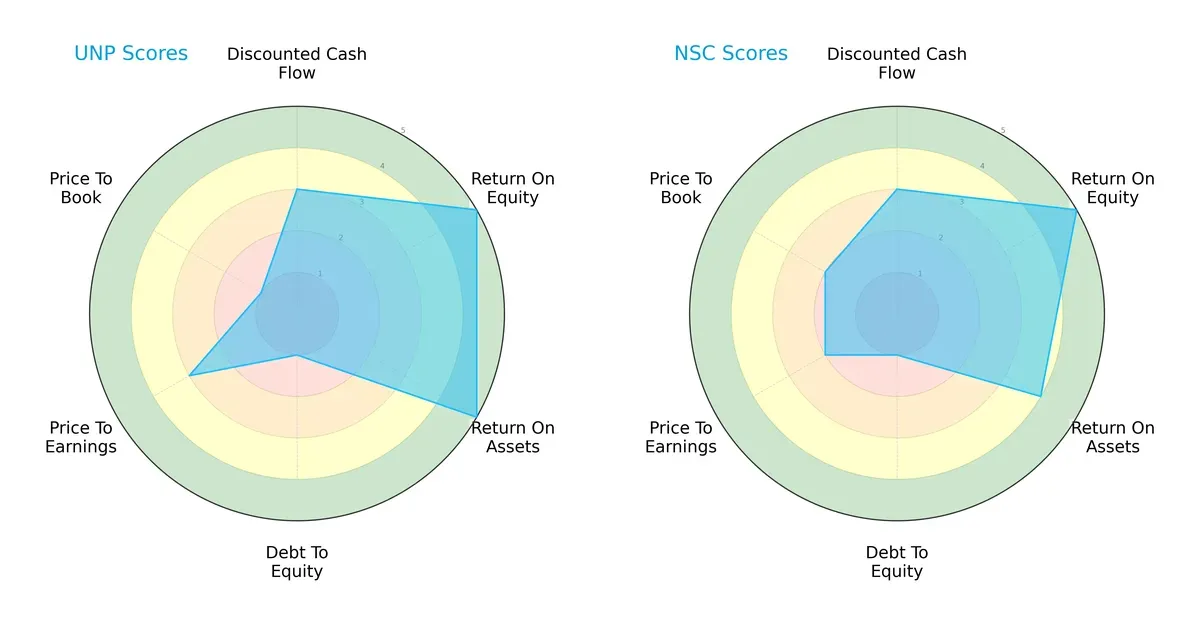
Union Pacific boasts very favorable ROE and ROA scores, signaling superior profitability and asset efficiency. Norfolk Southern matches Union Pacific’s strong ROE but lags slightly in ROA. Both firms share a very unfavorable debt-to-equity profile, indicating elevated leverage risk. Union Pacific holds a moderate valuation score, while Norfolk Southern appears less attractively priced. Overall, Union Pacific presents a more balanced financial profile, while Norfolk Southern leans on its equity returns as a key edge.
Bankruptcy Risk: Solvency Showdown
Union Pacific’s Altman Z-Score of 4.06 places it comfortably in the safe zone, while Norfolk Southern’s 2.50 score signals moderate financial distress risk in this cycle:
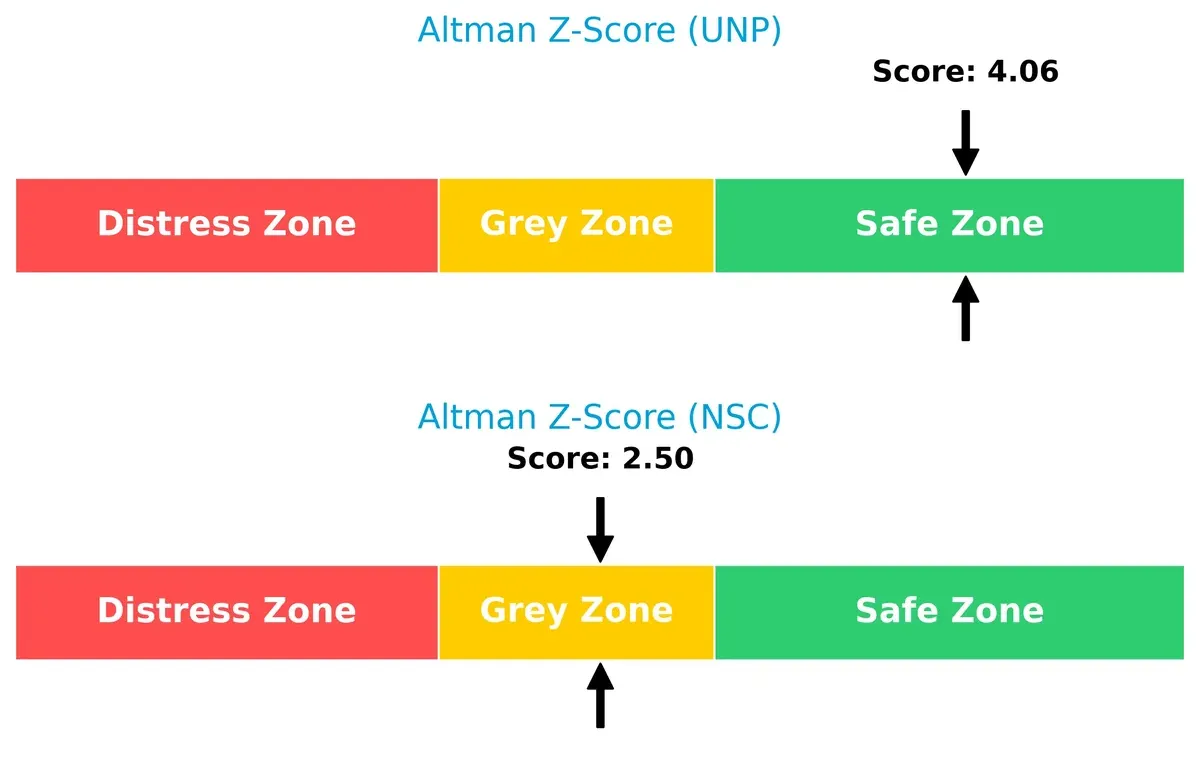
Both companies face pressure from heavy leverage, but Union Pacific’s stronger solvency metrics suggest it is better equipped to survive economic downturns, a crucial edge given the capital-intensive nature of railroads.
Financial Health: Quality of Operations
Union Pacific and Norfolk Southern each score a solid 7 on the Piotroski F-Score, indicating strong financial health and operational quality for both firms:
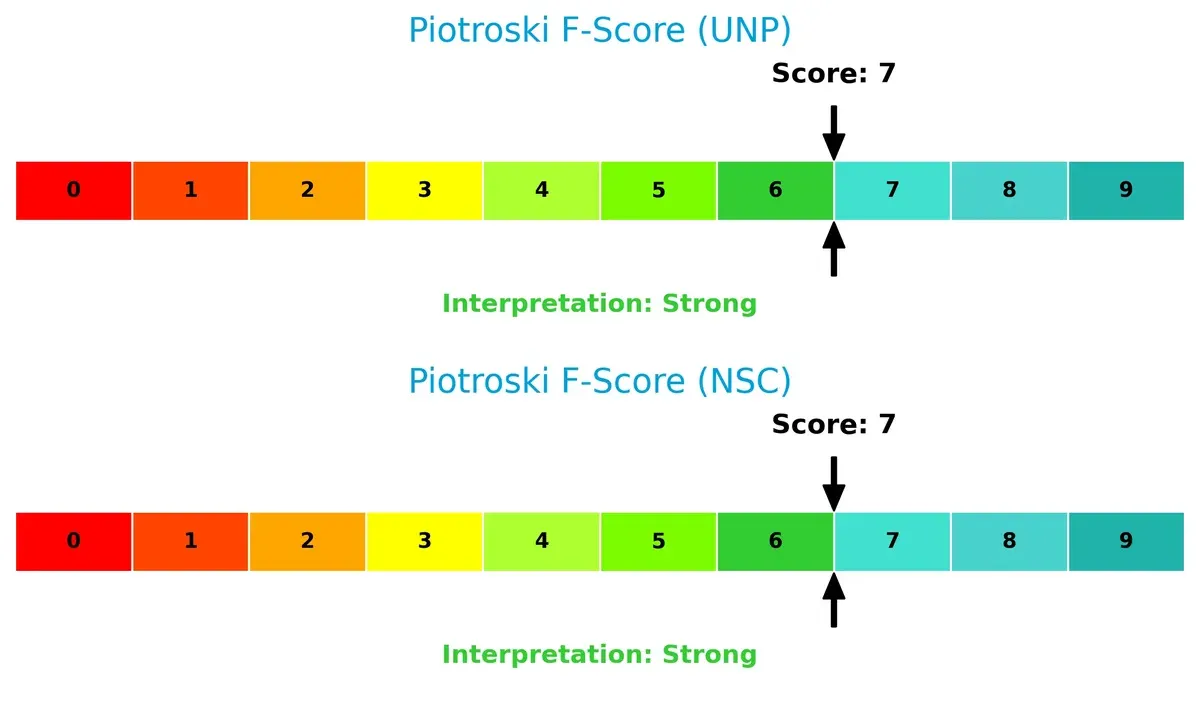
Neither company shows red flags in internal metrics, but this parity underscores the importance of monitoring leverage risks that could disrupt long-term performance. Both firms maintain robust profitability and efficiency signals critical for value investors.
How are the two companies positioned?
This section dissects the operational DNA of UNP and NSC by comparing revenue distribution and internal dynamics. The goal is to confront their economic moats to reveal which model offers the most resilient, sustainable advantage.
Revenue Segmentation: The Strategic Mix
This visual comparison dissects how Union Pacific Corporation and Norfolk Southern Corporation diversify their income streams and where their primary sector bets lie:
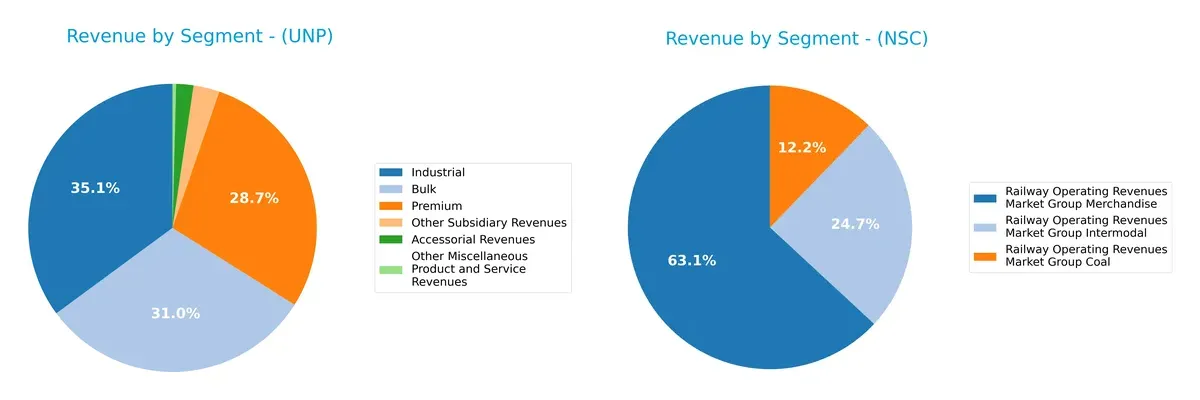
Union Pacific leans on a three-pronged revenue base: Industrial at $8.6B, Bulk at $7.6B, and Premium at $7.0B, showing balanced diversification. Norfolk Southern pivots heavily on Merchandise at $7.7B, with Intermodal ($3.0B) and Coal ($1.5B) trailing. Union Pacific’s broader mix reduces concentration risk, while Norfolk Southern’s reliance on Merchandise signals exposure to sector cyclicality but benefits from focused operational expertise.
Strengths and Weaknesses Comparison
This table compares the Strengths and Weaknesses of Union Pacific Corporation and Norfolk Southern Corporation:
UNP Strengths
- Higher net margin at 29.12%
- Strong ROE of 38.65% beats NSC
- Favorable interest coverage at 8.0
- Diverse product segments including Industrial and Premium
- Geographic revenue presence in US and Mexico
- Dividend yield at 2.36% is appealing
NSC Strengths
- Positive net margin at 23.59%
- Favorable ROE at 18.48%
- Solid interest coverage at 5.63
- Stable merchandise and intermodal revenue streams
- Neutral P/E ratio supports valuation stability
UNP Weaknesses
- Current ratio below 1 at 0.91 signals liquidity risk
- High debt-to-equity ratio at 1.72
- Unfavorable asset and fixed asset turnover ratios
- Elevated price-to-book ratio at 7.42 may indicate overvaluation
- Heavy reliance on US and Mexico markets
NSC Weaknesses
- Current ratio at 0.85 indicates liquidity constraints
- Lower ROIC at 7.47% compared to WACC of 8.65%
- Fixed asset turnover is zero, signaling inefficiency
- Debt-to-equity at 1.1 still high
- Dividend yield lower at 1.87%
Union Pacific shows stronger profitability and broader geographic reach, but faces liquidity and valuation concerns. Norfolk Southern exhibits stable earnings but struggles with efficiency and liquidity. Both companies must manage debt carefully amid sector pressures.
The Moat Duel: Analyzing Competitive Defensibility
A structural moat alone shields long-term profits from relentless competition erosion. Let’s dissect how each company defends its turf:
Union Pacific Corporation: Network Effects Powerhouse
Union Pacific’s moat stems from extensive network effects with 32K route miles linking key coasts. This scale drives high ROIC (+4.3% above WACC) and stable margins near 30%. However, a slight ROIC decline warns of margin pressure amid evolving logistics demands in 2026.
Norfolk Southern Corporation: Cost Advantage Under Siege
Norfolk Southern leans on cost advantage through efficient regional operations but trails Union Pacific’s scale. Its ROIC lags below WACC, signaling value destruction and a steep profitability decline. Yet, recent margin improvements and intermodal growth offer a chance to stabilize and innovate.
Scale and Efficiency: Network Effects vs. Cost Advantage
Union Pacific’s wider moat outperforms Norfolk Southern’s narrower cost edge by sustaining value creation despite margin pressure. I see Union Pacific better positioned to defend market share against competition and economic cycles in 2026.
Which stock offers better returns?
Union Pacific and Norfolk Southern have both shown strong price gains over the past year, with accelerating bullish momentum and increasing trading volumes.
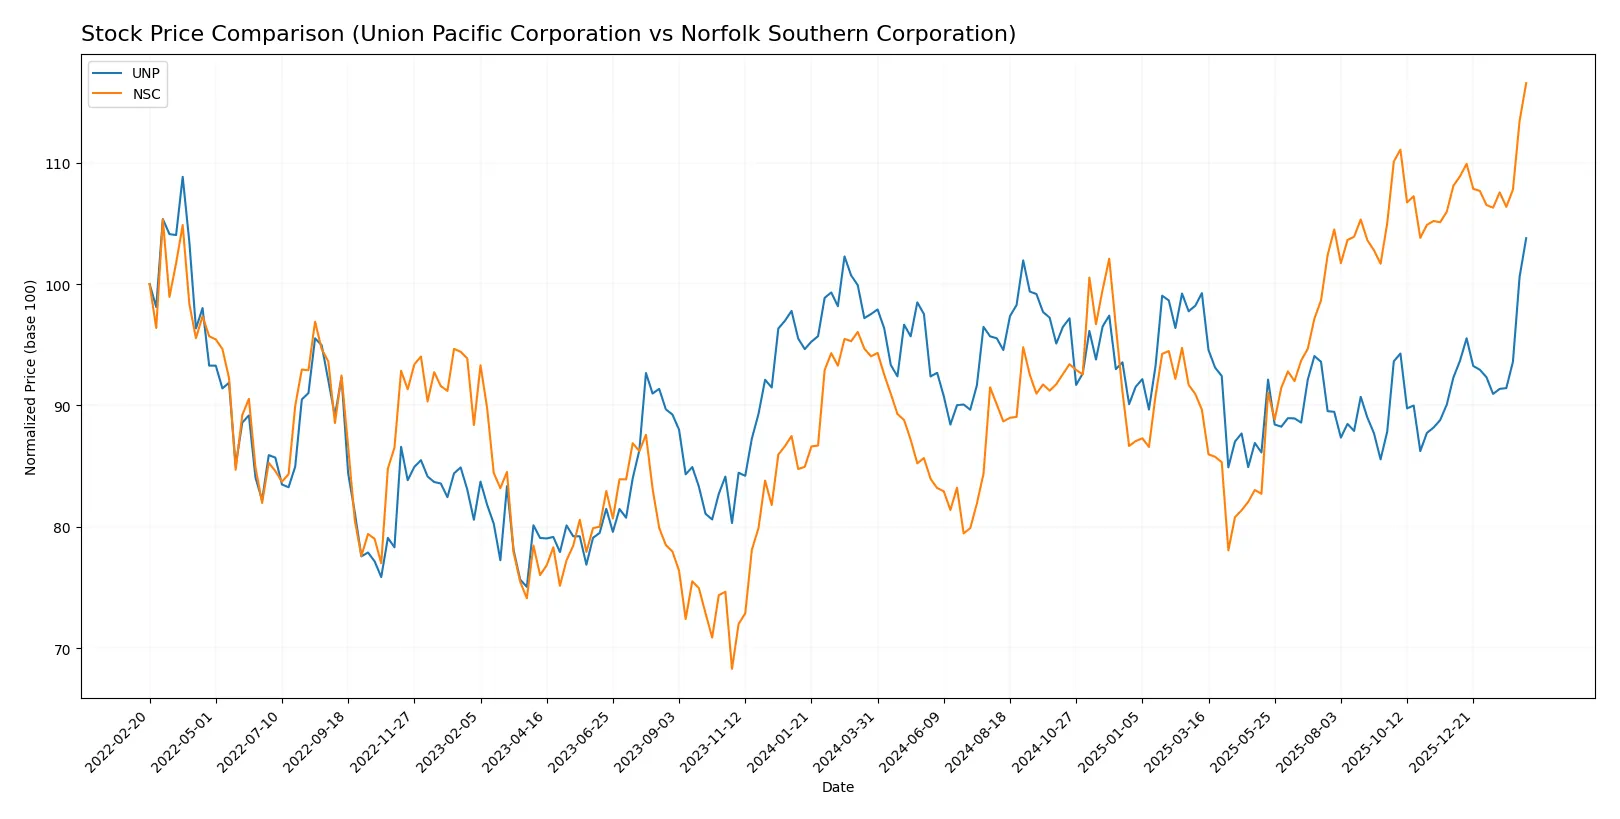
Trend Comparison
Union Pacific’s stock rose 6.41% over the past 12 months, displaying a bullish trend with accelerating momentum and moderate volatility. The price ranged between 213.26 and 260.68.
Norfolk Southern’s stock surged 23.93% over the last year, also bullish with acceleration but higher volatility. It reached a high of 314.94 and a low near 210.93.
Norfolk Southern outperformed Union Pacific in market returns, delivering nearly four times the price appreciation during the same period.
Target Prices
Analysts present a solid target price consensus for Union Pacific and Norfolk Southern, reflecting moderate upside potential.
| Company | Target Low | Target High | Consensus |
|---|---|---|---|
| Union Pacific Corporation | 227 | 285 | 260.5 |
| Norfolk Southern Corporation | 288 | 342 | 312.43 |
The consensus targets for both stocks slightly exceed current prices, indicating analyst optimism about continued strength in railroad sector fundamentals.

Don’t Let Luck Decide Your Entry Point
Optimize your entry points with our advanced ProRealTime indicators. You’ll get efficient buy signals with precise price targets for maximum performance. Start outperforming now!
How do institutions grade them?
The following tables summarize recent institutional grades for Union Pacific Corporation and Norfolk Southern Corporation:
Union Pacific Corporation Grades
This table lists recent ratings from major financial institutions on Union Pacific Corporation.
| Grading Company | Action | New Grade | Date |
|---|---|---|---|
| Citigroup | Maintain | Buy | 2026-01-28 |
| JP Morgan | Maintain | Neutral | 2026-01-28 |
| JP Morgan | Maintain | Neutral | 2026-01-12 |
| BMO Capital | Downgrade | Market Perform | 2026-01-07 |
| Barclays | Maintain | Overweight | 2025-12-16 |
| Deutsche Bank | Downgrade | Hold | 2025-12-11 |
| BMO Capital | Maintain | Outperform | 2025-10-24 |
| TD Cowen | Maintain | Buy | 2025-10-24 |
| Citigroup | Maintain | Buy | 2025-10-24 |
| JP Morgan | Maintain | Neutral | 2025-10-24 |
Norfolk Southern Corporation Grades
This table shows the latest institutional ratings for Norfolk Southern Corporation.
| Grading Company | Action | New Grade | Date |
|---|---|---|---|
| Baird | Maintain | Neutral | 2026-02-02 |
| Citigroup | Maintain | Neutral | 2026-01-30 |
| JP Morgan | Maintain | Neutral | 2026-01-30 |
| Barclays | Maintain | Overweight | 2026-01-30 |
| RBC Capital | Maintain | Sector Perform | 2026-01-30 |
| JP Morgan | Maintain | Neutral | 2026-01-12 |
| Citigroup | Maintain | Neutral | 2026-01-08 |
| Barclays | Maintain | Overweight | 2025-12-16 |
| Deutsche Bank | Downgrade | Hold | 2025-12-11 |
| TD Cowen | Maintain | Buy | 2025-10-24 |
Which company has the best grades?
Union Pacific generally receives stronger grades, including multiple Buy and Outperform ratings. Norfolk Southern mostly holds Neutral and Overweight ratings. These differences could influence investor sentiment and risk appetite.
Risks specific to each company
The following categories identify the critical pressure points and systemic threats facing both firms in the 2026 market environment:
1. Market & Competition
Union Pacific Corporation
- Larger market cap offers scale advantages but faces intense railroad competition.
Norfolk Southern Corporation
- Smaller scale but nimble, competing aggressively in overlapping rail markets.
2. Capital Structure & Debt
Union Pacific Corporation
- High debt-to-equity ratio (1.72) signals financial leverage risk.
Norfolk Southern Corporation
- Lower debt-to-equity (1.1) still elevated, indicating moderate leverage concerns.
3. Stock Volatility
Union Pacific Corporation
- Beta near 1 (0.987) suggests stock moves roughly with the market.
Norfolk Southern Corporation
- Higher beta (1.324) implies greater stock price volatility and risk.
4. Regulatory & Legal
Union Pacific Corporation
- Subject to stringent U.S. railroad safety and environmental regulations.
Norfolk Southern Corporation
- Faces similar regulatory risks with additional exposure to commuter rail operations.
5. Supply Chain & Operations
Union Pacific Corporation
- Extensive route miles (32,452) enhance network resilience but raise operational complexity.
Norfolk Southern Corporation
- Smaller network (19,300 miles) may reduce complexity but limit scale efficiencies.
6. ESG & Climate Transition
Union Pacific Corporation
- Higher exposure to coal and petroleum transport may pressure ESG ratings.
Norfolk Southern Corporation
- Similar commodity exposure but with diversified freight mix including chemicals and automotive.
7. Geopolitical Exposure
Union Pacific Corporation
- Primarily domestic U.S. operations limit geopolitical risks.
Norfolk Southern Corporation
- Also largely U.S.-focused but some overseas freight exposure via Atlantic ports adds complexity.
Which company shows a better risk-adjusted profile?
Union Pacific’s most impactful risk is its elevated financial leverage, heightening capital structure vulnerability despite a robust operating network. Norfolk Southern faces greater stock volatility and regulatory complexity, particularly from commuter rail operations. Union Pacific’s Altman Z-Score places it firmly in the safe zone (4.06), while Norfolk Southern lingers in the grey zone (2.5), validating Union Pacific’s superior risk-adjusted profile. Recent data show Union Pacific’s stronger interest coverage (8.0 vs. 5.63) underpins its better debt servicing capacity, a crucial edge in this sector’s capital-intensive cycle.
Final Verdict: Which stock to choose?
Union Pacific Corporation’s superpower lies in its robust capital efficiency and strong value creation, delivering consistently high returns above its cost of capital. Its point of vigilance is a stretched balance sheet, which demands careful monitoring. This stock fits well in an aggressive growth portfolio seeking quality with some risk tolerance.
Norfolk Southern Corporation’s strategic moat centers on its operational cash flow resilience and improving income quality, supported by a safer debt profile relative to Union Pacific. It offers better stability but with lower value creation, appealing to investors favoring growth at a reasonable price (GARP) strategies.
If you prioritize superior capital efficiency and high returns on invested capital, Union Pacific outshines with its value creation despite leverage concerns. However, if you seek steadier cash flow and a more conservative balance sheet, Norfolk Southern offers better stability albeit with weaker profitability trends. Both require risk awareness given industry cyclicality.
Disclaimer: Investment carries a risk of loss of initial capital. The past performance is not a reliable indicator of future results. Be sure to understand risks before making an investment decision.
Go Further
I encourage you to read the complete analyses of Union Pacific Corporation and Norfolk Southern Corporation to enhance your investment decisions: