In today’s competitive industrial machinery sector, Xylem Inc. (XYL) and Nordson Corporation (NDSN) stand out as key players driving innovation and market growth. Both companies specialize in engineered solutions, with Xylem focusing on water technology and Nordson excelling in precision dispensing systems. Their overlapping markets and commitment to advanced technologies make them ideal for comparison. Join me as we explore which company offers the most compelling investment opportunity in 2026.
Table of contents
Companies Overview
I will begin the comparison between Xylem Inc. and Nordson Corporation by providing an overview of these two companies and their main differences.
Xylem Inc. Overview
Xylem Inc. focuses on designing, manufacturing, and servicing engineered products for water and wastewater applications globally. Operating through Water Infrastructure, Applied Water, and Measurement & Control Solutions segments, it offers pumps, filtration, disinfection equipment, and smart meters. The company serves residential, commercial, and industrial sectors, emphasizing water transportation, treatment, and asset management solutions.
Nordson Corporation Overview
Nordson Corporation engineers and markets systems for dispensing and applying adhesives, coatings, and fluids worldwide. It operates in two segments: Industrial Precision Solutions and Advanced Technology Solutions. Nordson’s products include automated dispensing systems, coating technologies, and precision medical devices, serving industrial, packaging, semiconductor, and medical sectors with a focus on fluid control and surface treatment.
Key similarities and differences
Both companies operate in the industrial machinery sector with global reach and emphasize engineered systems for specialized fluid handling. Xylem targets water-related infrastructure and management, while Nordson focuses on adhesive and coating application technologies across diverse industries. Xylem employs more staff and has a larger market cap, whereas Nordson offers a broader range of precision dispensing and testing solutions.
Income Statement Comparison
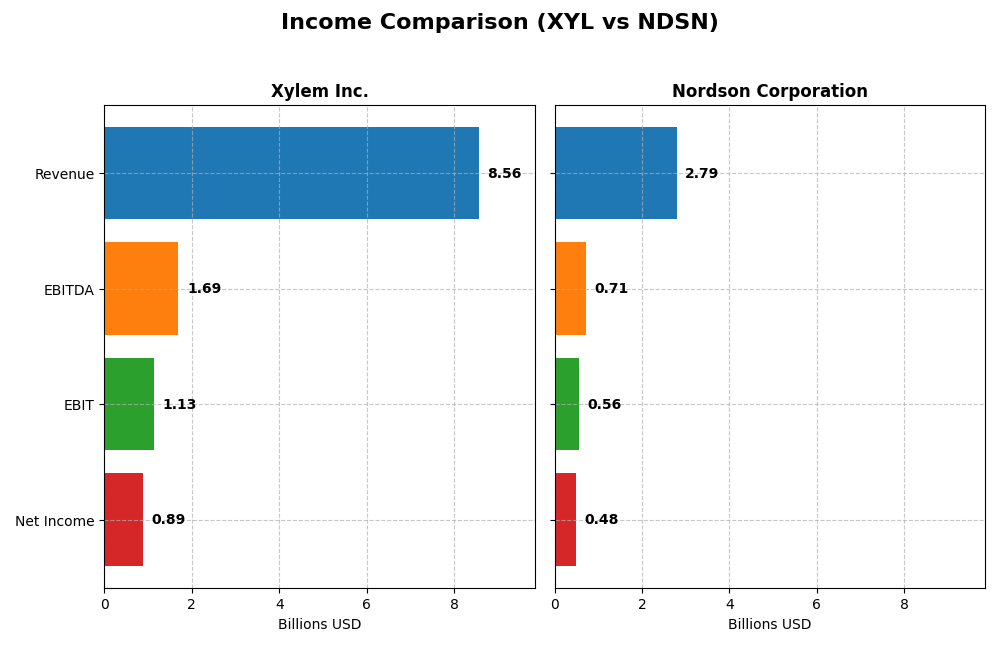
The following table presents a side-by-side comparison of key income statement metrics for Xylem Inc. and Nordson Corporation for their most recent fiscal years.
| Metric | Xylem Inc. (XYL) | Nordson Corporation (NDSN) |
|---|---|---|
| Market Cap | 34B | 14.6B |
| Revenue | 8.56B | 2.79B |
| EBITDA | 1.69B | 712M |
| EBIT | 1.13B | 561M |
| Net Income | 890M | 484M |
| EPS | 3.67 | 8.56 |
| Fiscal Year | 2024 | 2025 |
Income Statement Interpretations
Xylem Inc.
Xylem Inc. exhibited strong revenue growth from $4.88B in 2020 to $8.56B in 2024, with net income rising from $254M to $890M over the same period. Margins improved significantly, with the net margin nearly doubling. The 2024 fiscal year showed favorable growth, including a 16.3% revenue increase and a 25.7% net margin expansion, highlighting robust profitability gains.
Nordson Corporation
Nordson Corporation’s revenue increased steadily from $2.36B in 2021 to $2.79B in 2025, while net income grew modestly from $454M to $484M. Gross and EBIT margins remained favorable near 55% and 20%, respectively, but EBIT declined by 16.8% in the latest year, signaling some margin pressure despite stable revenue. Net margin and EPS growth were less consistent in 2025.
Which one has the stronger fundamentals?
Xylem demonstrates stronger fundamentals with higher revenue and net income growth, alongside improving margins and profitability metrics. Nordson maintains superior gross and EBIT margins but faced EBIT contraction and net margin decline recently. Overall, Xylem’s comprehensive margin expansion and faster net income growth suggest more robust income statement fundamentals.
Financial Ratios Comparison
The table below presents a side-by-side comparison of key financial ratios for Xylem Inc. and Nordson Corporation, based on their most recent fiscal year data.
| Ratios | Xylem Inc. (XYL) 2024 | Nordson Corporation (NDSN) 2025 |
|---|---|---|
| ROE | 8.36% | 15.92% |
| ROIC | 5.78% | 10.49% |
| P/E | 31.63 | 27.10 |
| P/B | 2.64 | 4.31 |
| Current Ratio | 1.75 | 1.64 |
| Quick Ratio | 1.33 | 1.05 |
| D/E (Debt-to-Equity) | 0.20 | 0.69 |
| Debt-to-Assets | 12.88% | 35.36% |
| Interest Coverage | 22.93 | 7.04 |
| Asset Turnover | 0.52 | 0.47 |
| Fixed Asset Turnover | 7.43 | 4.70 |
| Payout Ratio | 39.33% | 36.96% |
| Dividend Yield | 1.24% | 1.36% |
Interpretation of the Ratios
Xylem Inc.
Xylem exhibits a balanced financial profile with half of its key ratios rated favorable, including a strong current ratio of 1.75 and low debt-to-equity at 0.2, indicating solid liquidity and conservative leverage. However, its return on equity at 8.36% and PE ratio of 31.63 are less appealing. Xylem pays dividends with a 1.24% yield, showing moderate shareholder returns supported by free cash flow coverage but with a cautious stance on payout sustainability.
Nordson Corporation
Nordson presents generally strong profitability ratios, such as a 15.92% return on equity and 17.35% net margin, alongside a favorable interest coverage of 5.55. Its higher debt levels, with a debt-to-assets ratio of 35.36%, and a PE of 27.1 reflect more aggressive financial leverage and valuation concerns. The company pays dividends with a 1.36% yield, balancing shareholder returns with a solid free cash flow yield near 5%, signaling prudent distribution policies.
Which one has the best ratios?
Both companies receive a slightly favorable overall ratio assessment, each with 50% favorable metrics. Xylem excels in liquidity and conservative debt management, while Nordson leads in profitability and cash flow yields but carries higher leverage and valuation risk. The choice depends on investor preference for stability versus earnings strength within the industrial machinery sector.
Strategic Positioning
This section compares the strategic positioning of Xylem Inc. and Nordson Corporation, including market position, key segments, and exposure to technological disruption:
Xylem Inc.
- Larger market cap at 34B with moderate competitive pressure in industrial machinery.
- Diverse segments: Water Infrastructure, Applied Water, Measurement & Control Solutions driving revenue.
- Exposure through smart meters, networked devices, and cloud analytics in water solutions.
Nordson Corporation
- Smaller market cap at 14.6B, facing moderate competitive pressure in industrial machinery.
- Focused on Industrial Precision and Advanced Technology Solutions with medical and fluid applications.
- Exposure via automated dispensing, coating, plasma treatment, and inspection systems.
Xylem Inc. vs Nordson Corporation Positioning
Xylem has a diversified portfolio across water infrastructure and measurement technologies, offering broader market coverage. Nordson concentrates on precision dispensing and coating technologies, focusing on niche industrial and medical applications, reflecting strategic concentration versus diversification.
Which has the best competitive advantage?
Nordson shows a slightly favorable moat with value creation despite declining profitability, while Xylem is slightly unfavorable, shedding value though with improving profitability. Nordson currently holds a better competitive advantage based on ROIC versus WACC.
Stock Comparison
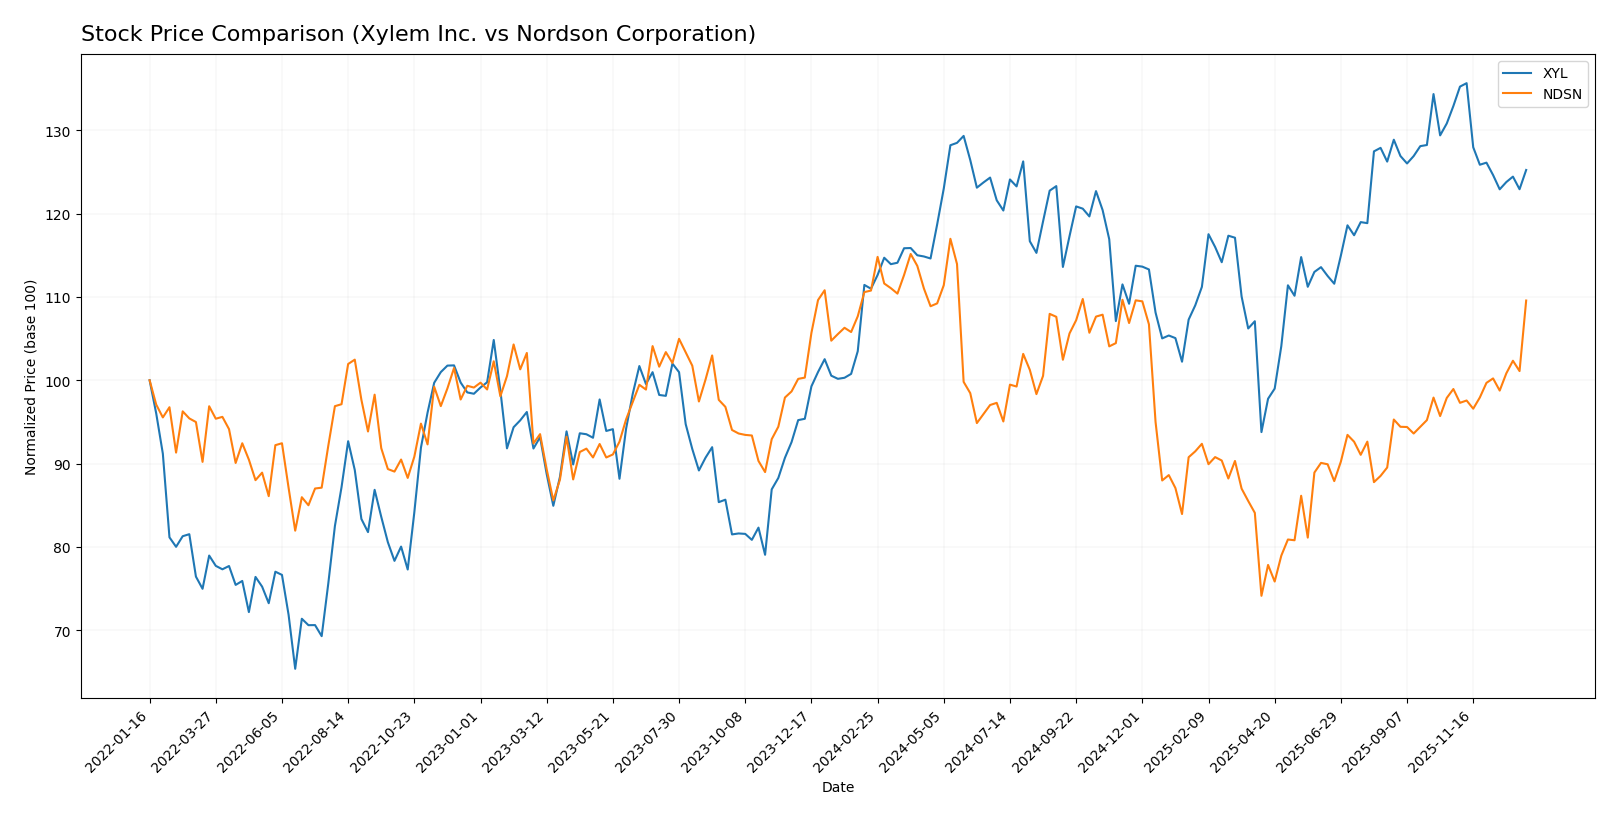
The stock price chart illustrates key movements over the past 12 months, highlighting Xylem Inc.’s overall bullish trend with decelerating momentum and Nordson Corporation’s near-neutral but accelerating price dynamics.
Trend Analysis
Xylem Inc. shows a 12.84% price increase over the past year, indicating a bullish trend with deceleration in momentum and moderate volatility (std dev 9.45). Recent months reveal a -5.77% pullback.
Nordson Corporation experienced a slight -1.08% decline over the year, classified as bearish with accelerating trend momentum and higher volatility (std dev 23.45). The recent period shows a 10.73% price recovery.
Comparing both, Xylem Inc. delivered the strongest market performance over the last 12 months, despite a recent correction, while Nordson’s overall trend remained close to neutral.
Target Prices
The current analyst consensus points to optimistic target prices for both Xylem Inc. and Nordson Corporation, suggesting potential upside from their current market prices.
| Company | Target High | Target Low | Consensus |
|---|---|---|---|
| Xylem Inc. | 178 | 150 | 169.43 |
| Nordson Corporation | 295 | 240 | 274.17 |
Analysts expect Xylem’s stock to rise from about 140 to near 170 on average, indicating a strong growth potential. Nordson’s consensus target price of 274 suggests a moderate upside compared to its current price near 261.
Analyst Opinions Comparison
This section compares analysts’ ratings and grades for Xylem Inc. and Nordson Corporation:
Rating Comparison
Xylem Inc. Rating
- Rating: B, considered very favorable by analysts.
- Discounted Cash Flow Score: 3, indicating moderate value.
- ROE Score: 3, showing moderate efficiency in equity use.
- ROA Score: 4, favorable asset utilization.
- Debt To Equity Score: 3, moderate financial risk.
- Overall Score: 3, moderate overall financial standing.
Nordson Corporation Rating
- Rating: B, also considered very favorable.
- Discounted Cash Flow Score: 3, indicating moderate value.
- ROE Score: 4, showing favorable efficiency in equity use.
- ROA Score: 4, favorable asset utilization.
- Debt To Equity Score: 2, moderate but lower financial risk.
- Overall Score: 3, moderate overall financial standing.
Which one is the best rated?
Both companies share the same overall rating of B and overall score of 3, indicating moderate financial standing. However, Nordson shows stronger return on equity and slightly better debt-to-equity metrics, suggesting a more favorable efficiency and lower financial risk based on the provided data.
Scores Comparison
Here is a comparison of the Altman Z-Score and Piotroski Score for Xylem Inc. and Nordson Corporation:
Xylem Inc. Scores
- Altman Z-Score: 4.89, in the safe zone indicating low bankruptcy risk.
- Piotroski Score: 8, categorized as very strong financial health.
Nordson Corporation Scores
- Altman Z-Score: 4.90, in the safe zone indicating low bankruptcy risk.
- Piotroski Score: 7, categorized as strong financial health.
Which company has the best scores?
Both companies have Altman Z-Scores well within the safe zone, reflecting low bankruptcy risk. Xylem Inc. has a higher Piotroski Score (8) than Nordson (7), indicating slightly stronger financial health based on this metric.
Grades Comparison
Here is a comparison of recent grades assigned to Xylem Inc. and Nordson Corporation by reputable grading firms:
Xylem Inc. Grades
The following table summarizes recent grades from verified financial institutions for Xylem Inc.:
| Grading Company | Action | New Grade | Date |
|---|---|---|---|
| Barclays | Maintain | Overweight | 2026-01-07 |
| Mizuho | Maintain | Neutral | 2026-01-05 |
| TD Cowen | Maintain | Hold | 2025-12-05 |
| UBS | Maintain | Buy | 2025-11-06 |
| RBC Capital | Maintain | Outperform | 2025-10-29 |
| Stifel | Maintain | Buy | 2025-10-29 |
| Barclays | Maintain | Overweight | 2025-10-29 |
| Citigroup | Maintain | Buy | 2025-10-29 |
| Citigroup | Maintain | Buy | 2025-10-09 |
| Mizuho | Maintain | Neutral | 2025-09-12 |
Xylem Inc.’s grades show a mixed but generally positive trend, with multiple Buy and Overweight ratings alongside some Neutral and Hold assessments.
Nordson Corporation Grades
Below is a summary of recent verified grades for Nordson Corporation:
| Grading Company | Action | New Grade | Date |
|---|---|---|---|
| DA Davidson | Maintain | Buy | 2025-12-12 |
| Baird | Maintain | Neutral | 2025-12-12 |
| DA Davidson | Maintain | Buy | 2025-12-11 |
| Keybanc | Maintain | Overweight | 2025-12-11 |
| Oppenheimer | Maintain | Outperform | 2025-08-25 |
| Baird | Maintain | Neutral | 2025-08-22 |
| Keybanc | Maintain | Overweight | 2025-07-15 |
| Baird | Maintain | Neutral | 2025-05-30 |
| Oppenheimer | Upgrade | Outperform | 2025-05-30 |
| Keybanc | Maintain | Overweight | 2025-04-08 |
Nordson Corporation’s grades predominantly favor positive ratings such as Buy, Outperform, and Overweight, with fewer Neutral ratings and no Sell recommendations.
Which company has the best grades?
Nordson Corporation has received overall stronger grades compared to Xylem Inc., with a consensus rating of Buy versus Xylem’s Hold. This suggests a more favorable outlook from analysts for Nordson, which could influence investor confidence and portfolio decisions more positively.
Strengths and Weaknesses
Below is a comparison of key strengths and weaknesses for Xylem Inc. (XYL) and Nordson Corporation (NDSN) based on recent financial and strategic data.
| Criterion | Xylem Inc. (XYL) | Nordson Corporation (NDSN) |
|---|---|---|
| Diversification | Broad product range in water-related segments; Applied Water, Measurement & Control, Water Infrastructure, and Services totaling over 8B USD revenue | Diverse industrial solutions including Advanced Tech, Industrial Precision, Medical & Fluid, about 2.7B USD revenue |
| Profitability | Moderate net margin at 10.4%, ROIC at 5.8% below WACC indicating value destruction but improving profitability | Stronger net margin at 17.4%, ROIC at 10.5% above WACC showing value creation despite declining ROIC trend |
| Innovation | Investment in integrated solutions and measurement indicates focus on tech advancement | Advanced Technology Systems segment shows innovation focus, supporting strong profitability |
| Global presence | Global player in water infrastructure and solutions, well-established market presence | Global industrial and medical solutions provider with solid market penetration |
| Market Share | Leading position in water infrastructure markets, steady growth | Significant niche market shares in precision and dispensing systems, steady but more specialized |
Xylem shows strength in diversification and growing profitability but faces challenges as it currently destroys value relative to cost of capital. Nordson creates value with higher profitability but risks from declining ROIC trend should be monitored. Both companies maintain solid market positions with different strategic focuses.
Risk Analysis
Below is a comparison of key risk factors for Xylem Inc. (XYL) and Nordson Corporation (NDSN) based on the most recent data available in 2026.
| Metric | Xylem Inc. (XYL) | Nordson Corporation (NDSN) |
|---|---|---|
| Market Risk | Beta 1.17, moderate volatility | Beta 1.03, slightly lower volatility |
| Debt level | Low debt-to-equity 0.20, favorable | Moderate debt-to-equity 0.69, neutral |
| Regulatory Risk | Moderate, water infrastructure regulations | Moderate, industrial and environmental regulations |
| Operational Risk | Moderate, global manufacturing footprint | Moderate, precision manufacturing complexity |
| Environmental Risk | Moderate, exposure to water treatment and sustainability mandates | Moderate, chemical handling and emissions controls |
| Geopolitical Risk | Moderate, global supply chains | Moderate, global sales and supply dependencies |
The most impactful risks center around market volatility and operational complexity for both companies. Xylem’s low debt level reduces financial risk, while Nordson’s higher leverage warrants cautious monitoring. Regulatory and environmental risks remain relevant given the industries they operate in, with evolving standards potentially affecting costs. Both companies maintain solid financial health, but investors should watch geopolitical factors influencing supply chains.
Which Stock to Choose?
Xylem Inc. (XYL) shows a strong income evolution with 75.6% revenue growth and 250.4% net income growth over 2020-2024. Its financial ratios are slightly favorable, with a good net margin of 10.4% and low debt levels. Profitability is improving, though ROE remains modest at 8.4%. The company’s rating is very favorable (B), supported by a safe Altman Z-Score and a very strong Piotroski score.
Nordson Corporation (NDSN) presents a solid income statement with a 18.2% revenue increase and 6.6% net income growth over 2021-2025. Its financial ratios are also slightly favorable, boasting a higher net margin of 17.4% and stronger ROE at 15.9%, albeit with higher debt ratios. The rating is very favorable (B), with a safe Altman Z-Score and a strong Piotroski score, despite a declining ROIC trend.
Investors focused on growth may find Xylem’s accelerating profitability and improving income metrics appealing, while those prioritizing profitability and return metrics might view Nordson’s higher margins and ROE favorably. The choice could depend on whether one values expanding earnings or steadier returns amid differing debt profiles.
Disclaimer: Investment carries a risk of loss of initial capital. The past performance is not a reliable indicator of future results. Be sure to understand risks before making an investment decision.
Go Further
I encourage you to read the complete analyses of Xylem Inc. and Nordson Corporation to enhance your investment decisions: