In the dynamic industrial machinery sector, Symbotic Inc. (SYM) and Nordson Corporation (NDSN) stand out for their innovative approaches to automation and precision technology. Symbotic focuses on advanced warehouse robotics enhancing retail and wholesale efficiency, while Nordson delivers specialized dispensing systems across multiple industries. This article will dissect both companies’ strengths and strategies to help you decide which one holds the most promise for your investment portfolio in 2026.

Table of contents
Companies Overview
I will begin the comparison between Symbotic Inc. and Nordson Corporation by providing an overview of these two companies and their main differences.
Symbotic Inc. Overview
Symbotic Inc. operates in the industrial machinery sector, focusing on automation technology for retailers and wholesalers in the US. Its core product, The Symbotic System, is a comprehensive warehouse automation solution designed to reduce costs, boost efficiency, and optimize inventory management. The company is headquartered in Wilmington, Massachusetts, and has a market capitalization of approximately 42.8B USD.
Nordson Corporation Overview
Nordson Corporation is a US-based industrial machinery company specializing in dispensing, coating, and precision application systems for adhesives, coatings, polymers, and biomaterials worldwide. It serves diverse industries through its two segments: Industrial Precision Solutions and Advanced Technology Solutions. Founded in 1935 and headquartered in Westlake, Ohio, Nordson has a market cap near 14.6B USD and employs around 8,000 people.
Key similarities and differences
Both Symbotic and Nordson operate within the industrial machinery sector and provide technology-driven solutions aimed at improving manufacturing and operational efficiencies. Symbotic focuses primarily on warehouse automation for retail and wholesale, while Nordson offers a broader range of precision dispensing and coating systems across multiple industries. Additionally, Nordson is a more established company with a longer history, larger workforce, and pays dividends, unlike Symbotic.
Income Statement Comparison
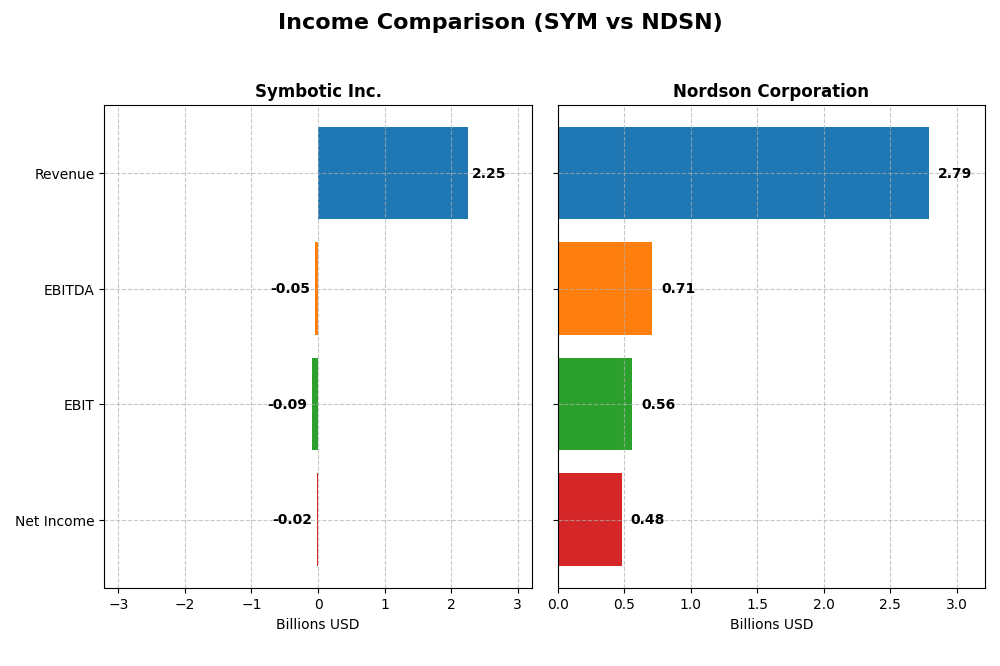
The table below presents a side-by-side comparison of key income statement metrics for Symbotic Inc. and Nordson Corporation for their most recent fiscal year.
| Metric | Symbotic Inc. (SYM) | Nordson Corporation (NDSN) |
|---|---|---|
| Market Cap | 42.8B | 14.6B |
| Revenue | 2.25B | 2.79B |
| EBITDA | -48.0M | 712.0M |
| EBIT | -92.1M | 561.2M |
| Net Income | -16.9M | 484.5M |
| EPS | -0.16 | 8.56 |
| Fiscal Year | 2025 | 2025 |
Income Statement Interpretations
Symbotic Inc.
Symbotic Inc. experienced strong revenue growth from 2021 to 2025, rising from $252M to $2.25B, with net income losses shrinking overall. Gross margins remained stable around 18.8%, but EBIT and net margins stayed negative, reflecting ongoing operating challenges. In 2025, revenue surged 25.7%, yet EBIT declined by 10.6%, highlighting continued margin pressure despite improved top-line performance.
Nordson Corporation
Nordson Corporation showed steady revenue growth, reaching $2.79B in 2025 from $2.36B in 2021. Gross margin was robust at 55.2%, and EBIT margin held strong at 20.1%. Net income remained solid, with a 17.4% net margin in 2025. While revenue growth slowed to 3.8% in 2025, operating expenses grew less rapidly, supporting stable profitability despite a 16.8% EBIT decline.
Which one has the stronger fundamentals?
Nordson presents stronger fundamentals with consistently high and favorable margins, positive net income, and moderate revenue growth. Symbotic shows impressive revenue expansion but struggles with negative EBIT and net margins, indicating profitability challenges. Nordson’s stability and profitability outweigh Symbotic’s rapid growth but ongoing losses, suggesting a more resilient income statement profile.
Financial Ratios Comparison
This table presents a side-by-side comparison of key financial ratios for Symbotic Inc. and Nordson Corporation based on their most recent fiscal year data.
| Ratios | Symbotic Inc. (SYM) | Nordson Corporation (NDSN) |
|---|---|---|
| ROE | -7.65% | 15.92% |
| ROIC | -16.63% | 10.69% |
| P/E | -334.54 | 27.10 |
| P/B | 25.60 | 4.31 |
| Current Ratio | 1.08 | 1.64 |
| Quick Ratio | 0.99 | 1.05 |
| D/E (Debt to Equity) | 0.14 | 0.69 |
| Debt-to-Assets | 1.32% | 35.36% |
| Interest Coverage | 0 | 7.04 |
| Asset Turnover | 0.94 | 0.47 |
| Fixed Asset Turnover | 15.92 | 4.70 |
| Payout ratio | 0 | 37.0% |
| Dividend yield | 0% | 1.36% |
Interpretation of the Ratios
Symbotic Inc.
Symbotic Inc. shows a mixed financial profile with several unfavorable ratios including negative net margin (-0.75%), return on equity (-7.65%), and return on invested capital (-16.63%). Positive aspects include a favorable debt-to-equity ratio (0.14) and fixed asset turnover (15.92). The company does not pay dividends, which aligns with its negative earnings and reinvestment in R&D (about 9.6% of revenue).
Nordson Corporation
Nordson exhibits generally strong ratios, such as a favorable net margin of 17.35%, return on equity at 15.92%, and return on invested capital of 10.49%. The company maintains a solid current ratio (1.64) and interest coverage (5.55). Dividend yield stands at 1.36%, indicating steady shareholder returns, supported by a moderate payout and manageable debt levels.
Which one has the best ratios?
Nordson Corporation outperforms Symbotic Inc. in most key profitability and liquidity metrics, demonstrating a slightly favorable overall ratio profile. Symbotic’s ratios are slightly unfavorable due to ongoing negative returns and earnings. While Symbotic excels in some operational efficiency measures, Nordson’s financial stability and dividend policy present a stronger, more balanced ratio picture.
Strategic Positioning
This section compares the strategic positioning of Symbotic Inc. and Nordson Corporation across Market position, Key segments, and Exposure to technological disruption:
Symbotic Inc.
- Larger market cap of $42.8B but higher beta at 2.143 indicating more volatility.
- Focused on warehouse automation systems serving U.S. retailers and wholesalers.
- Provides automation robotics technology aimed at efficiency, facing moderate disruption risk.
Nordson Corporation
- Smaller market cap of $14.6B with lower beta of 1.025, reflecting more stable stock performance.
- Diversified segments: Industrial Precision, Advanced Technology, and Medical & Fluid Solutions globally.
- Exposure to advanced dispensing and coating technologies, with ongoing innovation in fluid control systems.
Symbotic Inc. vs Nordson Corporation Positioning
Symbotic pursues a concentrated approach focused on automation in U.S. warehouses, offering scale advantages but higher market volatility. Nordson operates diversified industrial and medical segments globally, balancing risk and opportunity with broader exposure but less market cap.
Which has the best competitive advantage?
Nordson’s slightly favorable MOAT with positive ROIC over WACC suggests better value creation despite a declining trend. Symbotic’s very unfavorable MOAT indicates value destruction with declining profitability, signaling a weaker competitive advantage based on current capital efficiency.
Stock Comparison
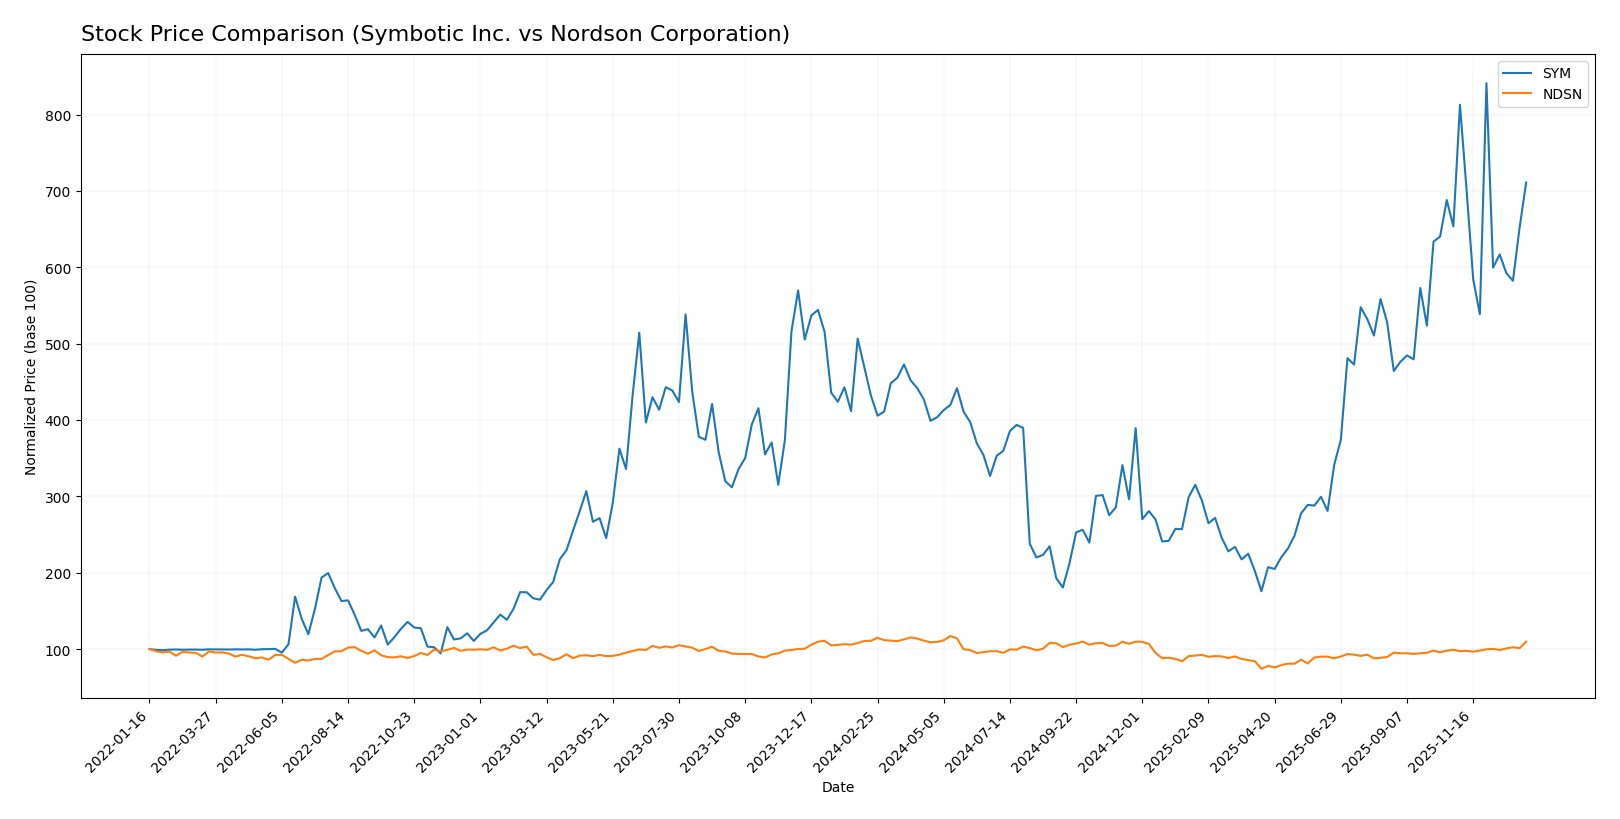
The stock price movements of Symbotic Inc. and Nordson Corporation over the past year reveal contrasting trends, with Symbotic showing strong gains amid decelerating momentum, while Nordson exhibits a slight overall decline but recent acceleration in price appreciation.
Trend Analysis
Symbotic Inc. (SYM) experienced a bullish trend over the past 12 months, with a 64.58% price increase and decelerating momentum. The stock ranged between 17.5 and 83.77, showing moderate volatility (std deviation 15.15).
Nordson Corporation (NDSN) showed a bearish trend with a slight 1.08% price decline over 12 months, despite acceleration in recent gains of 10.73%. Price volatility was higher (std deviation 23.45), with a range from 176.73 to 278.89.
Comparatively, Symbotic delivered the highest market performance with a strong overall gain of 64.58%, outperforming Nordson’s marginal decline in the same period.
Target Prices
The current analyst consensus presents promising upside potential for these companies based on recent evaluations.
| Company | Target High | Target Low | Consensus |
|---|---|---|---|
| Symbotic Inc. | 83 | 41 | 65.11 |
| Nordson Corporation | 295 | 240 | 274.17 |
Symbotic’s consensus target of 65.11 is slightly below its current price of 70.82, suggesting a cautious outlook. Nordson’s target consensus of 274.17 indicates moderate upside from its current price of 261.22, reflecting generally positive analyst sentiment.
Analyst Opinions Comparison
This section compares analysts’ ratings and grades for Symbotic Inc. and Nordson Corporation:
Rating Comparison
SYM Rating
- Rating: C+ indicating a very favorable overall evaluation.
- Discounted Cash Flow Score: 5, very favorable, suggests undervaluation potential.
- ROE Score: 1, very unfavorable, showing weak profit generation from equity.
- ROA Score: 1, very unfavorable, indicating poor asset utilization.
- Debt To Equity Score: 3, moderate risk level, balanced financial leverage.
- Overall Score: 2, moderate, reflecting mixed financial health signals.
NDSN Rating
- Rating: B reflecting a very favorable overall evaluation.
- Discounted Cash Flow Score: 3, moderate, indicating fair valuation.
- ROE Score: 4, favorable, demonstrating efficient profit generation.
- ROA Score: 4, favorable, indicating effective asset utilization.
- Debt To Equity Score: 2, moderate, implying lower financial risk.
- Overall Score: 3, moderate, showing somewhat stronger financial standing.
Which one is the best rated?
Nordson Corporation is better rated overall, with a higher letter grade (B vs. C+), superior ROE and ROA scores, and a moderate overall score of 3 compared to Symbotic’s 2. Symbotic shows strength only in discounted cash flow.
Scores Comparison
Here is a comparison of the Altman Z-Score and Piotroski Score for both companies:
SYM Scores
- Altman Z-Score: 13.05, indicating a very strong safe zone
- Piotroski Score: 3, classified as very weak financial health
NDSN Scores
- Altman Z-Score: 4.90, indicating a strong safe zone
- Piotroski Score: 7, classified as strong financial health
Which company has the best scores?
Based on the provided data, SYM has a much higher Altman Z-Score indicating lower bankruptcy risk, but NDSN scores significantly better on the Piotroski Score, reflecting stronger overall financial health.
Grades Comparison
Here is a detailed comparison of the latest grades and ratings for Symbotic Inc. and Nordson Corporation:
Symbotic Inc. Grades
This table summarizes recent grades and recommendations from established financial institutions for Symbotic Inc.:
| Grading Company | Action | New Grade | Date |
|---|---|---|---|
| Goldman Sachs | Sell | Sell | 2025-12-02 |
| Barclays | Maintain | Underweight | 2025-11-26 |
| Baird | Maintain | Neutral | 2025-11-26 |
| Craig-Hallum | Upgrade | Buy | 2025-11-25 |
| Northland Capital Markets | Maintain | Outperform | 2025-11-25 |
| Needham | Maintain | Buy | 2025-11-25 |
| Cantor Fitzgerald | Maintain | Overweight | 2025-11-25 |
| DA Davidson | Maintain | Neutral | 2025-11-25 |
| Citigroup | Maintain | Buy | 2025-11-25 |
| UBS | Sell | Sell | 2025-09-23 |
Symbotic Inc.’s grades exhibit a mix of Buy and Neutral ratings with some recent downgrades to Sell by Goldman Sachs and UBS, reflecting a varied analyst outlook.
Nordson Corporation Grades
The following table lists recent grades and ratings from verified grading companies for Nordson Corporation:
| Grading Company | Action | New Grade | Date |
|---|---|---|---|
| DA Davidson | Maintain | Buy | 2025-12-12 |
| Baird | Maintain | Neutral | 2025-12-12 |
| DA Davidson | Maintain | Buy | 2025-12-11 |
| Keybanc | Maintain | Overweight | 2025-12-11 |
| Oppenheimer | Maintain | Outperform | 2025-08-25 |
| Baird | Maintain | Neutral | 2025-08-22 |
| Keybanc | Maintain | Overweight | 2025-07-15 |
| Baird | Maintain | Neutral | 2025-05-30 |
| Oppenheimer | Upgrade | Outperform | 2025-05-30 |
| Keybanc | Maintain | Overweight | 2025-04-08 |
Nordson Corporation’s grades show a consistent pattern of Buy, Overweight, and Outperform recommendations, with no Sell ratings present.
Which company has the best grades?
Nordson Corporation has received more consistent Buy and Outperform grades compared to Symbotic Inc., which has mixed ratings including recent Sell downgrades. This suggests Nordson may be viewed more favorably by analysts, potentially indicating lower perceived risk and steadier confidence from investors.
Strengths and Weaknesses
Below is a comparative table highlighting the key strengths and weaknesses of Symbotic Inc. (SYM) and Nordson Corporation (NDSN) based on their recent financial performance and strategic positioning.
| Criterion | Symbotic Inc. (SYM) | Nordson Corporation (NDSN) |
|---|---|---|
| Diversification | Moderate; primarily focused on Systems (2.12B in 2025) with smaller operations in Services and Software Support | High; diversified across Advanced Technology, Industrial Precision, and Medical Fluid Solutions segments |
| Profitability | Weak; negative net margin (-0.75%), ROIC (-16.63%), and ROE (-7.65%) | Strong; net margin at 17.35%, ROIC 10.49%, ROE 15.92% |
| Innovation | Moderate; growing Systems revenue but declining profitability indicates challenges in innovation leverage | Strong; consistent investment in advanced technology segments supporting stable profitability |
| Global presence | Limited data but likely focused on automation solutions within select markets | Broad industrial footprint with diversified global operations |
| Market Share | Concentrated in automation systems niche but facing value destruction risks | Stable and growing with value creation, despite slightly declining ROIC trend |
In summary, Nordson Corporation demonstrates greater diversification, robust profitability, and stronger innovation impact compared to Symbotic Inc., which struggles with declining returns and value destruction despite growth in system revenues. Investors should weigh Nordson’s steady value creation against Symbotic’s higher risk profile and financial challenges.
Risk Analysis
Below is a comparative table of key risks faced by Symbotic Inc. (SYM) and Nordson Corporation (NDSN) based on the most recent data from 2025:
| Metric | Symbotic Inc. (SYM) | Nordson Corporation (NDSN) |
|---|---|---|
| Market Risk | High beta (2.14) indicates high volatility and sensitivity to market swings | Moderate beta (1.03) suggests average market volatility |
| Debt level | Low debt-to-equity (0.14) and debt-to-assets (1.32%) show low leverage | Moderate debt-to-equity (0.69) and debt-to-assets (35.36%) indicate moderate leverage |
| Regulatory Risk | Moderate, operating mainly in US industrial automation sector | Moderate, global operations expose to various regulations |
| Operational Risk | Negative profitability metrics, weak ROE and ROIC signal operational challenges | Strong profitability and operational efficiency reduce risk |
| Environmental Risk | Limited exposure but industrial machinery sector faces evolving sustainability demands | Moderate exposure due to manufacturing and coating chemicals |
| Geopolitical Risk | Primarily US-focused, limited geopolitical risk | Global presence increases exposure to geopolitical uncertainties |
The most impactful risks for Symbotic are its operational weaknesses, reflected in negative profitability and efficiency ratios, which could undermine growth despite low financial leverage. Nordson’s moderate debt and global footprint introduce financial and geopolitical risks, but its strong operational performance mitigates these concerns. Investors should weigh Symbotic’s volatility and operational risks against Nordson’s steadier, but more leveraged, profile.
Which Stock to Choose?
Symbotic Inc. (SYM) shows strong revenue growth and a favorable income statement overall, yet suffers from negative profitability ratios, declining ROIC, and a very unfavorable moat status. Its financial ratios are slightly unfavorable with mixed liquidity and low interest coverage, paired with a very favorable rating C+.
Nordson Corporation (NDSN) features steady income growth with favorable profitability and financial ratios, including high net margin and ROE. Despite a declining ROIC trend, it maintains a slightly favorable moat and a very favorable rating B, supported by solid liquidity and interest coverage metrics.
Investors seeking growth exposure might find Symbotic’s rapid revenue expansion appealing despite its weaker profitability and value destruction signals, while those prioritizing stable profitability and financial health could view Nordson’s consistent returns and value creation as more suitable.
Disclaimer: Investment carries a risk of loss of initial capital. The past performance is not a reliable indicator of future results. Be sure to understand risks before making an investment decision.
Go Further
I encourage you to read the complete analyses of Symbotic Inc. and Nordson Corporation to enhance your investment decisions: