Home > Comparison > Industrials > ROP vs NDSN
The strategic rivalry between Roper Technologies, Inc. and Nordson Corporation shapes the industrial machinery sector’s future. Roper operates as a diversified technology-driven solutions provider, blending software with engineered products. Nordson focuses on precision dispensing and coating systems, targeting specialized industrial applications. This analysis pits Roper’s broad tech integration against Nordson’s focused innovation to identify which offers superior risk-adjusted returns for a diversified portfolio in today’s competitive industrial landscape.
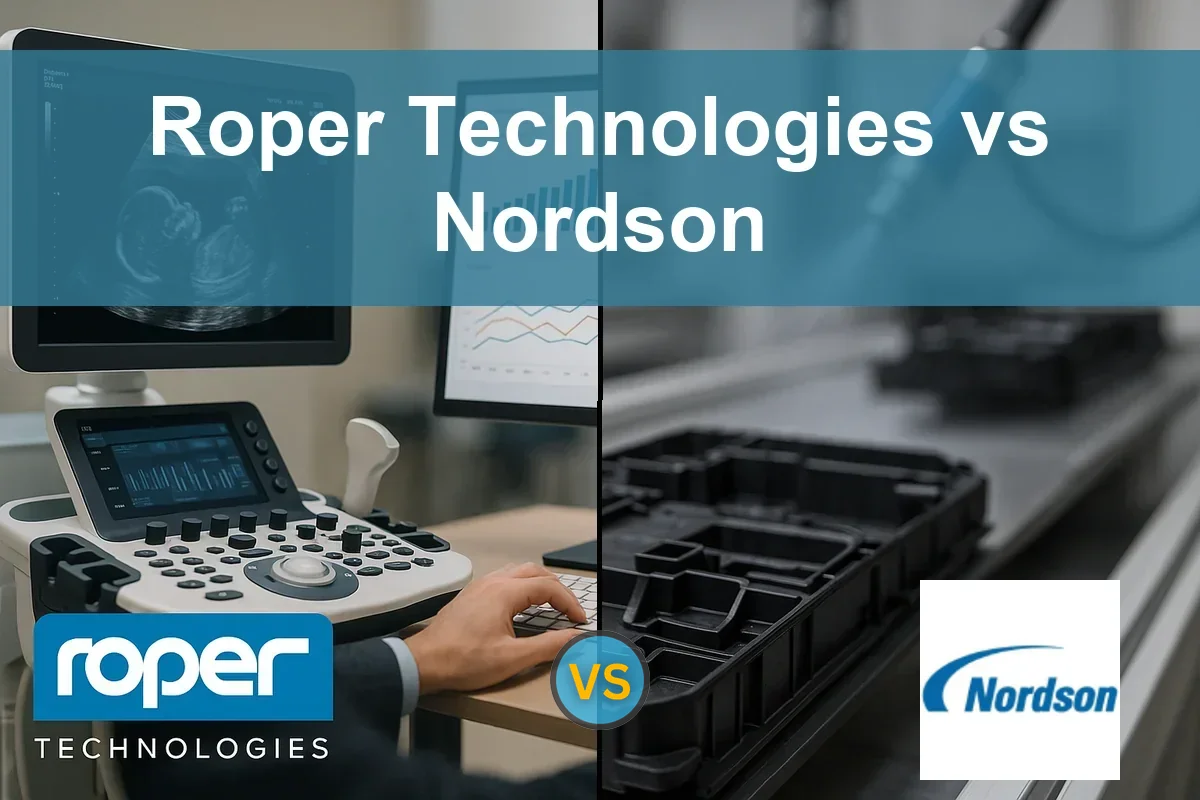
Table of contents
Companies Overview
Roper Technologies and Nordson Corporation stand as key innovators in industrial machinery, shaping manufacturing and technology worldwide.
Roper Technologies, Inc.: Diversified Industrial Software and Hardware Leader
Roper Technologies dominates with its diverse portfolio, spanning software and engineered products. Its core revenue engine fuses cloud-based software solutions with precision instruments across sectors like healthcare, insurance, and utilities. In 2026, Roper focuses on integrating data analytics and automation to enhance operational efficiency and expand its digital footprint.
Nordson Corporation: Precision Dispensing and Coating Specialist
Nordson Corporation excels in precision fluid dispensing and coating systems serving industries from packaging to semiconductors. Its revenue stems from two segments: Industrial Precision Solutions and Advanced Technology Solutions, delivering automated and manual systems globally. In 2026, Nordson prioritizes innovation in automated dispensing and surface treatment technologies to capture advanced manufacturing markets.
Strategic Collision: Similarities & Divergences
Both companies emphasize engineered industrial solutions but differ in approach: Roper pursues a broad software-driven ecosystem, while Nordson focuses on specialized, high-precision hardware. Their battleground lies in automation and efficiency technologies for manufacturing. Roper’s diversified digital model contrasts with Nordson’s niche precision engineering, defining distinct risk and growth profiles for investors.
Income Statement Comparison
This data dissects the core profitability and scalability of both corporate engines to reveal who dominates the bottom line:

| Metric | Roper Technologies, Inc. (ROP) | Nordson Corporation (NDSN) |
|---|---|---|
| Revenue | 7.9B | 2.79B |
| Cost of Revenue | 2.43B | 1.25B |
| Operating Expenses | 3.24B | 828M |
| Gross Profit | 5.47B | 1.54B |
| EBITDA | 3.13B | 712M |
| EBIT | 2.26B | 561M |
| Interest Expense | 325M | 101M |
| Net Income | 1.54B | 484M |
| EPS | 14.31 | 8.56 |
| Fiscal Year | 2025 | 2025 |
Income Statement Analysis: The Bottom-Line Duel
This income statement comparison reveals which company converts revenue into profit most efficiently and sustains margin strength over time.
Roper Technologies, Inc. Analysis
Roper’s revenue surged 12.3% year-over-year, reaching $7.9B in 2025, with net income slightly declining to $1.54B. Its gross margin remains robust at 69.2%, reflecting strong pricing power and cost control. Despite stable EBIT growth, net margin fell 11.7%, signaling pressure on bottom-line efficiency in the latest year.
Nordson Corporation Analysis
Nordson’s revenue grew modestly by 3.8% to $2.79B in 2025, with net income rising to $484M. The company sustains a solid gross margin of 55.2% but saw EBIT decline by 16.8%, indicating operational challenges. Net margin dipped slightly to 17.4%, although EPS improved by nearly 5%, showing resilience in shareholder returns.
Verdict: Margin Power vs. Revenue Scale
Roper dominates with superior revenue growth and higher gross and EBIT margins, but faces margin compression recently. Nordson offers steadier net income growth and EPS gains despite slower top-line expansion. Investors prioritizing scale and margin dominance may prefer Roper, while those valuing consistent earnings and EPS momentum might lean toward Nordson.
Financial Ratios Comparison
These vital ratios act as a diagnostic tool to expose the underlying fiscal health, valuation premiums, and capital efficiency of the companies compared below:
| Ratios | Roper Technologies, Inc. (ROP) | Nordson Corporation (NDSN) |
|---|---|---|
| ROE | 8.2% (2024) | 15.9% (2025) |
| ROIC | 5.5% (2024) | 10.5% (2025) |
| P/E | 35.9 (2024) | 27.1 (2025) |
| P/B | 2.95 (2024) | 4.31 (2025) |
| Current Ratio | 0.40 (2024) | 1.64 (2025) |
| Quick Ratio | 0.37 (2024) | 1.05 (2025) |
| D/E | 0.41 (2024) | 0.69 (2025) |
| Debt-to-Assets | 24.5% (2024) | 35.4% (2025) |
| Interest Coverage | 7.7x (2024) | 7.0x (2025) |
| Asset Turnover | 0.22 (2024) | 0.47 (2025) |
| Fixed Asset Turnover | 47.0 (2024) | 4.7 (2025) |
| Payout Ratio | 20.8% (2024) | 37.0% (2025) |
| Dividend Yield | 0.58% (2024) | 1.36% (2025) |
| Fiscal Year | 2024 | 2025 |
Efficiency & Valuation Duel: The Vital Signs
Ratios act as a company’s DNA, exposing hidden risks and operational strengths that shape investor confidence and valuation.
Roper Technologies, Inc.
Roper shows a favorable net margin at 19.44%, but ROE and ROIC stand at zero, flagging profitability concerns. Its P/E ratio of 31.06 suggests the stock is expensive relative to earnings. Dividend yield is low at 0.74%, indicating limited shareholder cash returns amid reinvestment in R&D.
Nordson Corporation
Nordson delivers solid profitability with a 15.92% ROE and 17.35% net margin, reflecting efficient operations. Its P/E of 27.1 signals a somewhat stretched valuation alongside a 4.31 PB ratio. The company balances shareholder returns with a 1.36% dividend yield and maintains a healthy liquidity profile.
Premium Valuation vs. Operational Safety
Nordson offers a superior blend of profitability and financial health with fewer unfavorable ratios than Roper. Roper’s expensive valuation and weak returns raise risks. Investors prioritizing operational stability may prefer Nordson’s profile, while risk-tolerant investors might consider Roper’s growth potential.
Which one offers the Superior Shareholder Reward?
I see Roper Technologies (ROP) offers a modest dividend yield near 0.7% with a sustainable payout ratio around 23%. Its free cash flow comfortably covers dividends and capex, supporting steady buybacks that enhance shareholder value. Nordson (NDSN) yields more at roughly 1.3%, but pays out nearly 37% of earnings, signaling less retained capital for growth. NDSN’s buyback activity is less pronounced, reflecting a balanced but slightly less aggressive return policy. Historically, ROP’s disciplined capital allocation and consistent buybacks provide a more sustainable total return in 2026. Therefore, I favor ROP for superior long-term shareholder reward.
Comparative Score Analysis: The Strategic Profile
The radar chart reveals the fundamental DNA and trade-offs of both firms, highlighting strengths and vulnerabilities across key financial metrics:

Roper Technologies (ROP) excels in discounted cash flow with a score of 4 but struggles with a very unfavorable debt-to-equity score of 1. Nordson Corporation (NDSN) shows a more balanced profile, scoring favorably in return on equity and assets (4 each) and maintaining moderate leverage. ROP relies heavily on cash flow strength but is burdened by debt risk, while NDSN combines solid profitability with healthier financial stability.
Bankruptcy Risk: Solvency Showdown
Nordson’s Altman Z-Score of 5.24 places it securely in the safe zone, signaling strong long-term solvency. Roper’s 2.70 score falls into the grey zone, indicating moderate bankruptcy risk in volatile markets:

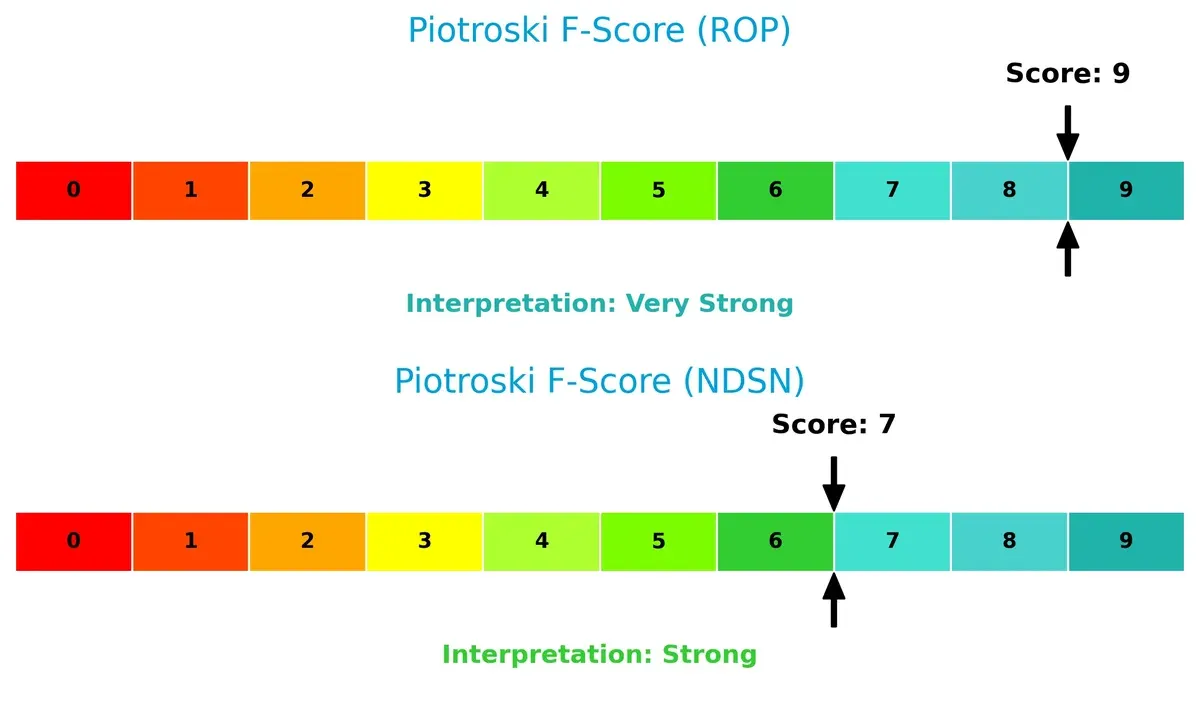
Financial Health: Quality of Operations
Roper scores a perfect 9 on the Piotroski F-Score, reflecting peak financial health and operational quality. Nordson’s 7 is strong but suggests slightly less robustness. Roper shows no red flags internally, outperforming Nordson on this measure:
How are the two companies positioned?
This section dissects Roper Technologies and Nordson’s operational DNA by comparing their revenue distribution and internal strengths and weaknesses. The goal is to confront their economic moats to reveal which model offers the most resilient, sustainable competitive advantage today.
Revenue Segmentation: The Strategic Mix
The following visual comparison dissects how Roper Technologies and Nordson Corporation diversify their income streams and where their primary sector bets lie:

Roper Technologies pivots heavily on its Software and Related Services segment, reaching $10.7B in 2024, overshadowing its prior diverse units. Nordson displays a more balanced mix with $1.48B in Industrial Precision Solutions and $695M in Medical and Fluid Solutions. Roper’s concentration signals a strategic bet on software ecosystem dominance but raises concentration risk. Nordson’s diversified streams anchor its resilience across advanced tech and industrial markets.
Strengths and Weaknesses Comparison
This table compares the strengths and weaknesses of Roper Technologies, Inc. and Nordson Corporation:
ROP Strengths
- Strong software and related services revenue of 10.7B in 2024
- Favorable net margin at 19.44%
- Low debt-to-assets ratio with favorable status
- High interest coverage ratio at 6.96
- Favorable price-to-book ratio
- Significant U.S. market presence with 6.06B revenue
NDSN Strengths
- Diversified revenue across advanced technology, industrial, and medical segments
- Favorable net margin at 17.35%
- Positive ROE at 15.92% and ROIC at 10.49%
- Strong current and quick ratios indicate liquidity
- Favorable fixed asset turnover at 4.7
- Global presence with balanced revenue distribution in Americas, Asia Pacific, and Europe
ROP Weaknesses
- Unfavorable ROE and ROIC at 0%
- Unavailable WACC data limits capital cost analysis
- Unfavorable current and quick ratios indicate liquidity risks
- Unfavorable asset and fixed asset turnover ratios
- High P/E ratio of 31.06 considered unfavorable
- Low dividend yield at 0.74%
- Heavy U.S. market concentration limits geographic diversification
NDSN Weaknesses
- Unfavorable P/E at 27.1 and high P/B at 4.31
- Moderate debt-to-equity and debt-to-assets ratios
- Slightly unfavorable asset turnover at 0.47
- Dividend yield neutral at 1.36%
- Revenue less concentrated in the U.S., which may dilute market dominance
Both companies show strong profitability but differ in financial health and diversification. Roper’s dominance in software drives revenue but exposes liquidity concerns. Nordson’s broader product base and healthier liquidity ratios offer stability but face valuation and efficiency challenges. These contrasts shape their strategic priorities in innovation and market expansion.
The Moat Duel: Analyzing Competitive Defensibility
A structural moat protects long-term profits from competitive erosion. Without it, market share and pricing power quickly vanish:
Roper Technologies, Inc.: Diversified Intangible Assets Moat
Roper’s advantage stems from its broad portfolio of specialized software and engineered products. This manifests in a robust 28.6% EBIT margin and stable gross margin near 69%. However, recent declines in net margin signal margin pressure, challenging moat durability in 2026.
Nordson Corporation: Precision Engineering and Cost Efficiency Moat
Nordson’s moat relies on advanced dispensing systems and manufacturing precision, reflected in a solid 20.1% EBIT margin and consistent revenue growth. Unlike Roper, Nordson generates excess returns above WACC, though ROIC declines warn of emerging competitive pressures for 2026.
Moat Strength: Intangible Assets vs. Engineering Precision
Nordson holds the wider moat with ROIC exceeding WACC by 2.5%, signaling value creation despite recent declines. Roper’s intangible asset moat delivers higher margins but lacks clear ROIC data, raising questions on long-term sustainability. Nordson stands better poised to defend market share amid 2026’s shifting industrial landscape.
Which stock offers better returns?
Over the past year, Roper Technologies, Inc. experienced a sharp price decline, while Nordson Corporation showed steady gains with accelerating momentum.

Trend Comparison
Roper Technologies, Inc. posted a bearish trend with a -36.27% price drop over 12 months, showing deceleration and high volatility, peaking at 588.38 and bottoming at 348.82.
Nordson Corporation delivered a bullish trend with a 5.69% rise over the same period, accelerating steadily and displaying moderate volatility, with a high of 278.89 and a low of 176.73.
Comparing both, Nordson’s stock outperformed Roper by maintaining positive momentum and delivering the highest market return over the past year.
Target Prices
Analysts show a positive outlook for both Roper Technologies, Inc. and Nordson Corporation based on current consensus targets.
| Company | Target Low | Target High | Consensus |
|---|---|---|---|
| Roper Technologies, Inc. | 365 | 575 | 475.5 |
| Nordson Corporation | 240 | 295 | 274.17 |
Roper’s consensus target of 475.5 suggests significant upside from the current 349 price. Nordson’s target near 274 aligns closely with its current 278 price, signaling a near-term plateau.

Don’t Let Luck Decide Your Entry Point
Optimize your entry points with our advanced ProRealTime indicators. You’ll get efficient buy signals with precise price targets for maximum performance. Start outperforming now!
How do institutions grade them?
Roper Technologies, Inc. Grades
The following table summarizes recent grades from reputable financial institutions for Roper Technologies, Inc.:
| Grading Company | Action | New Grade | Date |
|---|---|---|---|
| Goldman Sachs | Maintain | Neutral | 2026-01-29 |
| Argus Research | Downgrade | Hold | 2026-01-28 |
| Mizuho | Maintain | Underperform | 2026-01-28 |
| RBC Capital | Maintain | Sector Perform | 2026-01-28 |
| Stifel | Downgrade | Hold | 2026-01-28 |
| Citigroup | Maintain | Buy | 2026-01-28 |
| JP Morgan | Maintain | Underweight | 2026-01-28 |
| Truist Securities | Maintain | Buy | 2026-01-28 |
| Barclays | Maintain | Underweight | 2026-01-28 |
| Oppenheimer | Downgrade | Perform | 2026-01-28 |
Nordson Corporation Grades
Below are recent grades from reliable institutions for Nordson Corporation:
| Grading Company | Action | New Grade | Date |
|---|---|---|---|
| DA Davidson | Maintain | Buy | 2025-12-12 |
| Baird | Maintain | Neutral | 2025-12-12 |
| DA Davidson | Maintain | Buy | 2025-12-11 |
| Keybanc | Maintain | Overweight | 2025-12-11 |
| Oppenheimer | Maintain | Outperform | 2025-08-25 |
| Baird | Maintain | Neutral | 2025-08-22 |
| Keybanc | Maintain | Overweight | 2025-07-15 |
| Oppenheimer | Upgrade | Outperform | 2025-05-30 |
| Baird | Maintain | Neutral | 2025-05-30 |
| Keybanc | Maintain | Overweight | 2025-04-08 |
Which company has the best grades?
Nordson Corporation holds stronger and more consistent positive grades, including multiple “Buy,” “Overweight,” and “Outperform” ratings. Roper Technologies shows mixed grades with several downgrades and lower ratings. This divergence could influence investor confidence and risk perception accordingly.
Risks specific to each company
The following categories identify the critical pressure points and systemic threats facing both firms in the 2026 market environment:
1. Market & Competition
Roper Technologies, Inc.
- Faces pressure from broad industrial machinery sector competition and innovation demands.
Nordson Corporation
- Competes in precision dispensing and fluid control, requiring constant technology upgrades to maintain edge.
2. Capital Structure & Debt
Roper Technologies, Inc.
- Strong interest coverage but poor debt-to-equity metrics signal financial risk.
Nordson Corporation
- Moderate debt levels with balanced coverage indicate manageable financial leverage.
3. Stock Volatility
Roper Technologies, Inc.
- Beta below 1 suggests less sensitivity to market swings, but recent price drop signals caution.
Nordson Corporation
- Beta near 1 shows average volatility; price range tightening may indicate stabilization.
4. Regulatory & Legal
Roper Technologies, Inc.
- Operates across diverse software and industrial segments, increasing regulatory complexity risks.
Nordson Corporation
- Specialized manufacturing focus involves compliance with environmental and safety regulations.
5. Supply Chain & Operations
Roper Technologies, Inc.
- Complex product portfolio could strain supply chain resilience amid global disruptions.
Nordson Corporation
- Concentrated product lines allow more focused supply chain management but risk supplier dependency.
6. ESG & Climate Transition
Roper Technologies, Inc.
- ESG integration unclear; industrial exposure demands proactive climate strategy to avoid transition risks.
Nordson Corporation
- Faces pressure to innovate eco-friendly dispensing systems; ESG scoring impacts investor appeal.
7. Geopolitical Exposure
Roper Technologies, Inc.
- Global operations expose it to trade tensions and tariff risks, especially in emerging markets.
Nordson Corporation
- Primarily US-based but international sales expose it to geopolitical supply chain risks.
Which company shows a better risk-adjusted profile?
Nordson Corporation shows a better risk-adjusted profile. It maintains healthier financial ratios, including a safe Altman Z-score of 5.24 versus Roper’s 2.70 grey zone. Roper’s main risk is its weak capital structure, while Nordson’s lies in competitive innovation demands. Recent data show Roper’s stock price dropped 6.4%, signaling investor concern over leverage.
Final Verdict: Which stock to choose?
Roper Technologies, Inc. (ROP) shines with its remarkable ability to generate strong cash flow and maintain robust operating margins. Its superpower lies in efficient capital allocation within a complex industrial landscape. However, the low current ratio signals a liquidity risk that warrants caution. ROP fits best in aggressive growth portfolios willing to tolerate short-term volatility.
Nordson Corporation (NDSN) boasts a strategic moat through solid return on invested capital consistently exceeding its cost of capital, reflecting effective capital use and value creation. Its strong balance sheet and superior liquidity offer a safer profile than ROP. NDSN suits investors seeking growth at a reasonable price with a preference for stability.
If you prioritize aggressive expansion and can manage liquidity risks, ROP presents a compelling scenario due to its cash flow efficiency and margin strength. However, if you seek a balance of growth and financial stability, NDSN outshines by offering more consistent value creation and a safer liquidity position, commanding a premium in risk-conscious portfolios.
Disclaimer: Investment carries a risk of loss of initial capital. The past performance is not a reliable indicator of future results. Be sure to understand risks before making an investment decision.
Go Further
I encourage you to read the complete analyses of Roper Technologies, Inc. and Nordson Corporation to enhance your investment decisions: