In the competitive industrial machinery sector, Nordson Corporation (NDSN) and Parsons Corporation (PSN) stand out for their innovative approaches and market influence. Nordson excels in precision dispensing and coating systems, while Parsons specializes in defense, intelligence, and critical infrastructure solutions. Comparing these two reveals unique growth drivers and risks. Join me as we explore which company offers the most compelling opportunity for investors in 2026.
Table of contents
Companies Overview
I will begin the comparison between Nordson Corporation and Parsons Corporation by providing an overview of these two companies and their main differences.
Nordson Corporation Overview
Nordson Corporation engineers, manufactures, and markets products and systems for dispensing, applying, and controlling adhesives, coatings, polymers, sealants, biomaterials, and other fluids globally. The company operates through Industrial Precision Solutions and Advanced Technology Solutions segments, serving industries such as packaging, semiconductor, and medical devices. Founded in 1935, Nordson is headquartered in Westlake, Ohio, with a market cap of approximately 14.6B USD.
Parsons Corporation Overview
Parsons Corporation delivers integrated solutions and services in defense, intelligence, and critical infrastructure markets worldwide. Its two segments, Federal Solutions and Critical Infrastructure, focus on cybersecurity, missile defense, geospatial intelligence, and infrastructure engineering. Established in 1944 and based in Centreville, Virginia, Parsons has a market cap near 7.5B USD and employs around 20,000 people.
Key similarities and differences
Both companies operate in the industrial sector but address distinct market niches. Nordson focuses on precision dispensing systems and automated manufacturing solutions, while Parsons specializes in defense, intelligence, and critical infrastructure services. Nordson’s operations are product-oriented, whereas Parsons provides integrated services and technology solutions. Their market caps and employee counts differ significantly, reflecting their varied business models and scale.
Income Statement Comparison
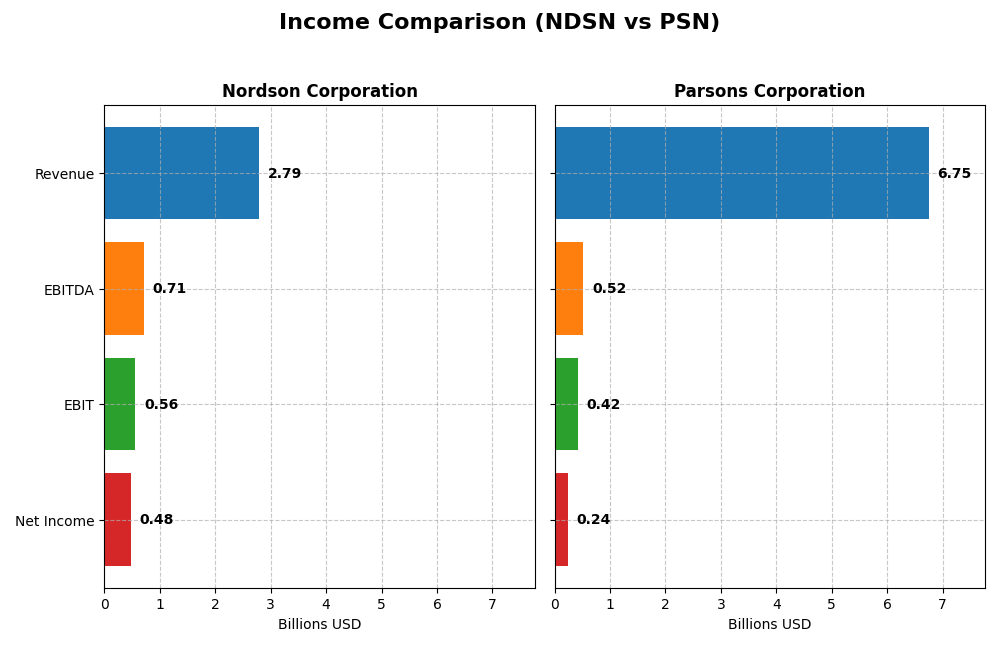
This table provides a side-by-side comparison of the key income statement metrics for Nordson Corporation and Parsons Corporation for their most recent fiscal years.
| Metric | Nordson Corporation (NDSN) | Parsons Corporation (PSN) |
|---|---|---|
| Market Cap | 14.6B | 7.5B |
| Revenue | 2.79B | 6.75B |
| EBITDA | 712M | 518M |
| EBIT | 561M | 419M |
| Net Income | 484M | 238M |
| EPS | 8.56 | 2.21 |
| Fiscal Year | 2025 | 2024 |
Income Statement Interpretations
Nordson Corporation
Nordson Corporation showed steady revenue growth from 2021 to 2025, increasing by 18.18%, with net income rising 6.63%. Margins remain strong, with a favorable gross margin of 55.16% and net margin of 17.35%. In 2025, revenue growth slowed to 3.78%, EBIT declined 16.79%, while EPS grew 4.93%, indicating mixed operational performance despite stable profitability.
Parsons Corporation
Parsons Corporation experienced robust revenue growth of 72.25% over 2020-2024, with net income surging 138.53%. Margins improved moderately, with a gross margin of 20.83% and net margin at 3.48%. In 2024, revenue grew 24.03%, EBIT rose 41.85%, and EPS jumped 49.3%, reflecting strong operational expansion and margin improvement in the most recent year.
Which one has the stronger fundamentals?
Nordson maintains higher and more stable margins, with a favorable long-term growth in revenue and net income but some recent EBIT softness. Parsons shows impressive top- and bottom-line growth with improving margins but operates with lower profitability ratios overall. Both exhibit favorable income statements, yet Nordson’s margin strength contrasts with Parsons’ rapid growth trajectory.
Financial Ratios Comparison
The table below presents a side-by-side comparison of key financial ratios for Nordson Corporation (NDSN) and Parsons Corporation (PSN) based on their most recent fiscal year data.
| Ratios | Nordson Corporation (2025) | Parsons Corporation (2024) |
|---|---|---|
| ROE | 15.9% | 9.7% |
| ROIC | 10.5% | 8.3% |
| P/E | 27.1 | 41.7 |
| P/B | 4.31 | 4.06 |
| Current Ratio | 1.64 | 1.29 |
| Quick Ratio | 1.05 | 1.29 |
| D/E (Debt to Equity) | 0.69 | 0.59 |
| Debt-to-Assets | 35.4% | 25.9% |
| Interest Coverage | 7.04 | 8.30 |
| Asset Turnover | 0.47 | 1.23 |
| Fixed Asset Turnover | 4.70 | 25.51 |
| Payout ratio | 37.0% | 0% |
| Dividend yield | 1.36% | 0% |
Interpretation of the Ratios
Nordson Corporation
Nordson Corporation shows strong profitability ratios with a favorable net margin of 17.35%, ROE of 15.92%, and ROIC of 10.49%, though valuation metrics like PE at 27.1 and PB at 4.31 are less attractive. Liquidity and interest coverage ratios are solid, but asset turnover is weak. The company pays dividends with a neutral yield of 1.36%, supported by a balanced payout and free cash flow coverage, posing limited risk.
Parsons Corporation
Parsons Corporation exhibits weaker profitability with a net margin of 3.48% and ROE of 9.73%, both unfavorable, though it benefits from a low WACC of 6.17% and strong asset turnover ratios. Liquidity is adequate with a current ratio of 1.29. Parsons does not pay dividends, likely reinvesting earnings to support growth and operations, which aligns with its strategic focus and cash flow profile.
Which one has the best ratios?
Nordson Corporation holds an edge with stronger profitability and liquidity ratios despite less favorable valuation multiples, whereas Parsons faces challenges in profitability but benefits from efficient asset use and lower debt risk. Both have slightly favorable overall ratio profiles, requiring investors to weigh profitability versus operational efficiency and dividend policies.
Strategic Positioning
This section compares the strategic positioning of Nordson Corporation and Parsons Corporation, including market position, key segments, and exposure to technological disruption:
Nordson Corporation
- Leading in industrial machinery with moderate competitive pressure in adhesive and coating systems markets.
- Key segments include Industrial Precision Solutions and Advanced Technology Systems, focusing on adhesives, coatings, and medical fluid solutions.
- Exposure includes automated dispensing and inspection technologies, with emphasis on precision systems and surface treatment.
Parsons Corporation
- Positioned in defense, intelligence, and critical infrastructure with moderate competitive pressure.
- Operates Federal Solutions and Critical Infrastructure segments, providing cybersecurity, defense, and infrastructure services.
- Exposure to advanced defense technologies, cybersecurity platforms, and critical infrastructure systems.
Nordson Corporation vs Parsons Corporation Positioning
Nordson follows a diversified approach with multiple product lines in industrial machinery and medical solutions, while Parsons concentrates on integrated defense and critical infrastructure services. Nordson’s breadth contrasts with Parsons’ specialized market focus.
Which has the best competitive advantage?
Nordson shows a slightly favorable moat with value creation but declining profitability, whereas Parsons has a very favorable moat with increasing profitability, indicating a stronger and more durable competitive advantage.
Stock Comparison
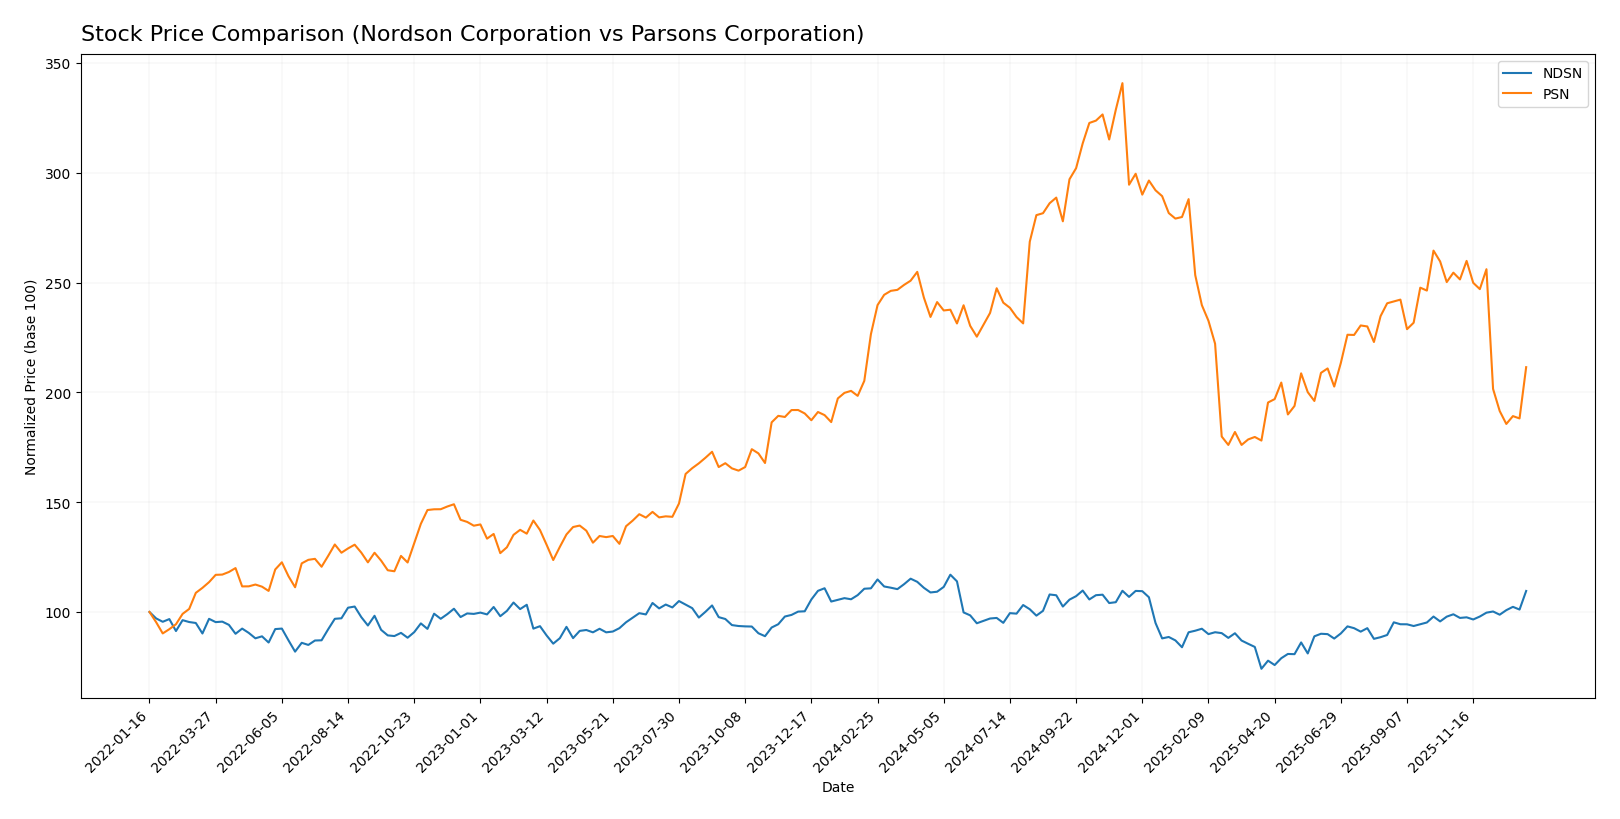
The stock price movements of Nordson Corporation and Parsons Corporation over the past 12 months reveal distinct bearish trends with contrasting recent momentum and volume dynamics.
Trend Analysis
Nordson Corporation’s stock showed a slight bearish trend over the past year with a -1.08% price change, coupled with accelerating momentum and high volatility (std dev 23.45). The recent quarter reversed positively, gaining 10.73%, indicating short-term strength.
Parsons Corporation experienced a more pronounced bearish trend, declining -6.64% over the year with decelerating losses and moderate volatility (std dev 12.98). Recent months saw further weakness, dropping -16.91%, reflecting sustained downward pressure.
Comparing both, Nordson Corporation outperformed Parsons Corporation in market performance during the past year, exhibiting less overall decline and a recent positive price rebound.
Target Prices
There is a clear consensus on target prices for both Nordson Corporation and Parsons Corporation from verified analysts.
| Company | Target High | Target Low | Consensus |
|---|---|---|---|
| Nordson Corporation | 295 | 240 | 274.17 |
| Parsons Corporation | 107 | 70 | 85 |
Analysts expect Nordson’s stock to appreciate moderately above its current price of $261.22, while Parsons is forecasted to have upside potential from $69.93, suggesting positive sentiment for both stocks.
Analyst Opinions Comparison
This section compares analysts’ ratings and grades for Nordson Corporation and Parsons Corporation:
Rating Comparison
NDSN Rating
- Rating: B, evaluated as Very Favorable overall by analysts.
- Discounted Cash Flow Score: 3, reflecting a Moderate valuation based on future cash flow.
- ROE Score: 4, showing a Favorable ability to generate profit from equity.
- ROA Score: 4, indicating Favorable efficiency in using assets to generate earnings.
- Debt To Equity Score: 2, suggesting a Moderate level of financial risk.
- Overall Score: 3, classified as Moderate overall financial standing.
PSN Rating
- Rating: A-, also considered Very Favorable by analysts.
- Discounted Cash Flow Score: 5, indicating a Very Favorable valuation based on future cash flow.
- ROE Score: 4, equally Favorable in profitability from equity.
- ROA Score: 4, also Favorable for asset utilization efficiency.
- Debt To Equity Score: 2, similarly Moderate financial risk assessment.
- Overall Score: 4, viewed as Favorable in overall financial health.
Which one is the best rated?
Based strictly on the provided data, Parsons Corporation holds a higher overall rating (A-) and superior discounted cash flow score (5) compared to Nordson Corporation’s B rating and DCF score of 3. Both have equal ROE, ROA, and debt-to-equity scores, but Parsons’ overall score is higher at 4 versus 3.
Scores Comparison
The following table presents a comparison of the Altman Z-Score and Piotroski Score for Nordson Corporation and Parsons Corporation:
Nordson Corporation Scores
- Altman Z-Score: 4.9, indicating a safe zone from bankruptcy risk.
- Piotroski Score: 7, reflecting strong financial health.
Parsons Corporation Scores
- Altman Z-Score: 3.59, also in the safe zone but lower.
- Piotroski Score: 6, indicating average financial strength.
Which company has the best scores?
Nordson Corporation has a higher Altman Z-Score and a stronger Piotroski Score compared to Parsons Corporation, indicating comparatively better financial stability and strength based on these metrics.
Grades Comparison
Here is a comparison of the recent grades and ratings for Nordson Corporation and Parsons Corporation:
Nordson Corporation Grades
The following table summarizes Nordson Corporation’s grades from reputable grading companies over the past year:
| Grading Company | Action | New Grade | Date |
|---|---|---|---|
| DA Davidson | Maintain | Buy | 2025-12-12 |
| Baird | Maintain | Neutral | 2025-12-12 |
| DA Davidson | Maintain | Buy | 2025-12-11 |
| Keybanc | Maintain | Overweight | 2025-12-11 |
| Oppenheimer | Maintain | Outperform | 2025-08-25 |
| Baird | Maintain | Neutral | 2025-08-22 |
| Keybanc | Maintain | Overweight | 2025-07-15 |
| Baird | Maintain | Neutral | 2025-05-30 |
| Oppenheimer | Upgrade | Outperform | 2025-05-30 |
| Keybanc | Maintain | Overweight | 2025-04-08 |
Nordson’s grades show a consistent pattern of “Buy,” “Neutral,” and “Overweight” ratings, with recent upgrades indicating positive analyst sentiment.
Parsons Corporation Grades
Below is a summary of Parsons Corporation’s grades from established grading firms during the past year:
| Grading Company | Action | New Grade | Date |
|---|---|---|---|
| B of A Securities | Maintain | Buy | 2025-12-30 |
| Stifel | Maintain | Buy | 2025-12-23 |
| Jefferies | Maintain | Hold | 2025-12-11 |
| TD Cowen | Upgrade | Buy | 2025-12-10 |
| Baird | Maintain | Outperform | 2025-12-08 |
| Truist Securities | Maintain | Buy | 2025-12-08 |
| Keybanc | Maintain | Overweight | 2025-12-08 |
| Truist Securities | Maintain | Buy | 2025-12-05 |
| William Blair | Upgrade | Outperform | 2025-11-20 |
| Keybanc | Maintain | Overweight | 2025-10-20 |
Parsons maintains a strong set of “Buy,” “Outperform,” and “Overweight” ratings, with several recent upgrades reflecting improving analyst views.
Which company has the best grades?
Both Nordson and Parsons have a consensus rating of “Buy” with strong support from analysts. Parsons shows a slightly broader range of upgrades and “Outperform” ratings, potentially indicating stronger momentum. Investors might interpret Parsons’s favorable grades as a sign of greater confidence from market analysts, while Nordson’s stable grades suggest consistent but more moderate expectations.
Strengths and Weaknesses
Below is a comparison of key strengths and weaknesses for Nordson Corporation (NDSN) and Parsons Corporation (PSN) based on recent financial and operational data:
| Criterion | Nordson Corporation (NDSN) | Parsons Corporation (PSN) |
|---|---|---|
| Diversification | Well diversified across Advanced Technology, Industrial Precision, and Medical & Fluid solutions segments | Revenue heavily concentrated in Critical Infrastructure and Federal Solutions segments |
| Profitability | Strong profitability with 17.35% net margin and 15.92% ROE; slightly favorable overall ratios | Lower profitability with 3.48% net margin and 9.73% ROE; some ratios unfavorable |
| Innovation | Moderate innovation reflected in stable advanced technology segment and favorable ROIC | Innovation reflected in growing ROIC and very favorable moat rating, indicating strong competitive advantage |
| Global presence | Established global presence in industrial and medical markets | Focused primarily on U.S. federal and infrastructure projects with growing footprint |
| Market Share | Solid market position in precision and medical systems with consistent revenue growth | Increasing market share in specialized federal and critical infrastructure sectors |
Key takeaways: Nordson shows stable profitability and diversification but faces a declining ROIC trend, suggesting caution. Parsons demonstrates strong and improving profitability with a durable competitive advantage, though it has less diversification and some margin weaknesses. Both companies present investment merits, but risk management should consider Nordson’s profitability trend and Parsons’ concentrated revenue base.
Risk Analysis
Below is a comparative table highlighting key risk metrics for Nordson Corporation (NDSN) and Parsons Corporation (PSN) based on the most recent data:
| Metric | Nordson Corporation (NDSN) | Parsons Corporation (PSN) |
|---|---|---|
| Market Risk | Beta 1.025 (Moderate) | Beta 0.664 (Lower) |
| Debt level | Debt-to-Equity 0.69 (Neutral) | Debt-to-Equity 0.59 (Neutral) |
| Regulatory Risk | Moderate, industrial compliance | Higher, defense & infrastructure regulations |
| Operational Risk | Moderate, machinery manufacturing | Elevated due to defense contracts and infrastructure projects |
| Environmental Risk | Moderate, manufacturing emissions | Elevated, infrastructure and defense environmental impact |
| Geopolitical Risk | Low to Moderate, global supply chains | High, exposure to defense and geopolitical tensions |
In summary, Parsons faces higher geopolitical and regulatory risks due to its defense and critical infrastructure focus, which may lead to impactful contract and compliance challenges. Nordson has moderate market and operational risks but benefits from a more diversified industrial machinery base. Investors should weigh Parsons’ higher risk against its strategic defense positioning and Nordson’s steadier, though slightly less growth-oriented, profile.
Which Stock to Choose?
Nordson Corporation (NDSN) shows a favorable income evolution with a steady revenue growth of 18.18% over five years and a strong net margin of 17.35%. Financial ratios are slightly favorable, highlighting solid profitability with a return on equity of 15.92% and adequate liquidity. Its debt level is moderate, and the rating is very favorable with a “B” score.
Parsons Corporation (PSN) demonstrates robust income growth, with revenue up 72.25% over five years and improving profitability metrics, though net margin remains modest at 3.48%. Financial ratios are slightly favorable overall, with a strong moat supported by a growing ROIC and very favorable rating of “A-“. Debt ratios appear moderate and interest coverage is strong.
Investors focused on sustained profitability and stability might find Nordson’s consistent income quality and moderately favorable financial ratios appealing, while those favoring dynamic growth and improving profitability could see Parsons as more suitable given its strong income growth and very favorable moat rating. The choice could depend on the investor’s risk tolerance and strategy.
Disclaimer: Investment carries a risk of loss of initial capital. The past performance is not a reliable indicator of future results. Be sure to understand risks before making an investment decision.
Go Further
I encourage you to read the complete analyses of Nordson Corporation and Parsons Corporation to enhance your investment decisions: