Home > Comparison > Industrials > PH vs NDSN
The strategic rivalry between Parker-Hannifin Corporation and Nordson Corporation shapes the industrial machinery sector’s competitive landscape. Parker-Hannifin operates as a diversified industrial and aerospace systems powerhouse, while Nordson focuses on precision dispensing and coating technologies. This analysis pits Parker-Hannifin’s broad industrial footprint against Nordson’s specialized niche. I will identify which company offers superior risk-adjusted potential for inclusion in a diversified portfolio.
Table of contents
Companies Overview
Two Ohio-based industrial machinery leaders define precision and control technologies in their respective niches.
Parker-Hannifin Corporation: Global Motion and Control Powerhouse
Parker-Hannifin dominates the industrial machinery sector with its diversified industrial and aerospace systems. It generates revenue by manufacturing motion and control technologies for mobile, industrial, and aerospace markets. In 2026, the company emphasizes expanding integrated hydraulic and pneumatic components, reinforcing its leadership across OEMs and aftermarket distributors worldwide.
Nordson Corporation: Precision Fluid Dispensing Innovator
Nordson Corporation specializes in precision dispensing and coating systems for adhesives, coatings, and fluids. It earns through two main segments: Industrial Precision Solutions and Advanced Technology Solutions. The 2026 strategic focus sharpens on automated dispensing innovations and advanced inspection systems, targeting semiconductor, packaging, and specialty coatings industries globally.
Strategic Collision: Similarities & Divergences
Both firms excel in industrial machinery but diverge in product specialization—Parker-Hannifin leans on broad motion control, while Nordson zeroes in on fluid application precision. Their battleground lies in automation technologies serving manufacturing clients. Parker-Hannifin offers scale and aerospace reach; Nordson presents niche technological depth, defining distinct investment profiles within the industrial sector.
Income Statement Comparison
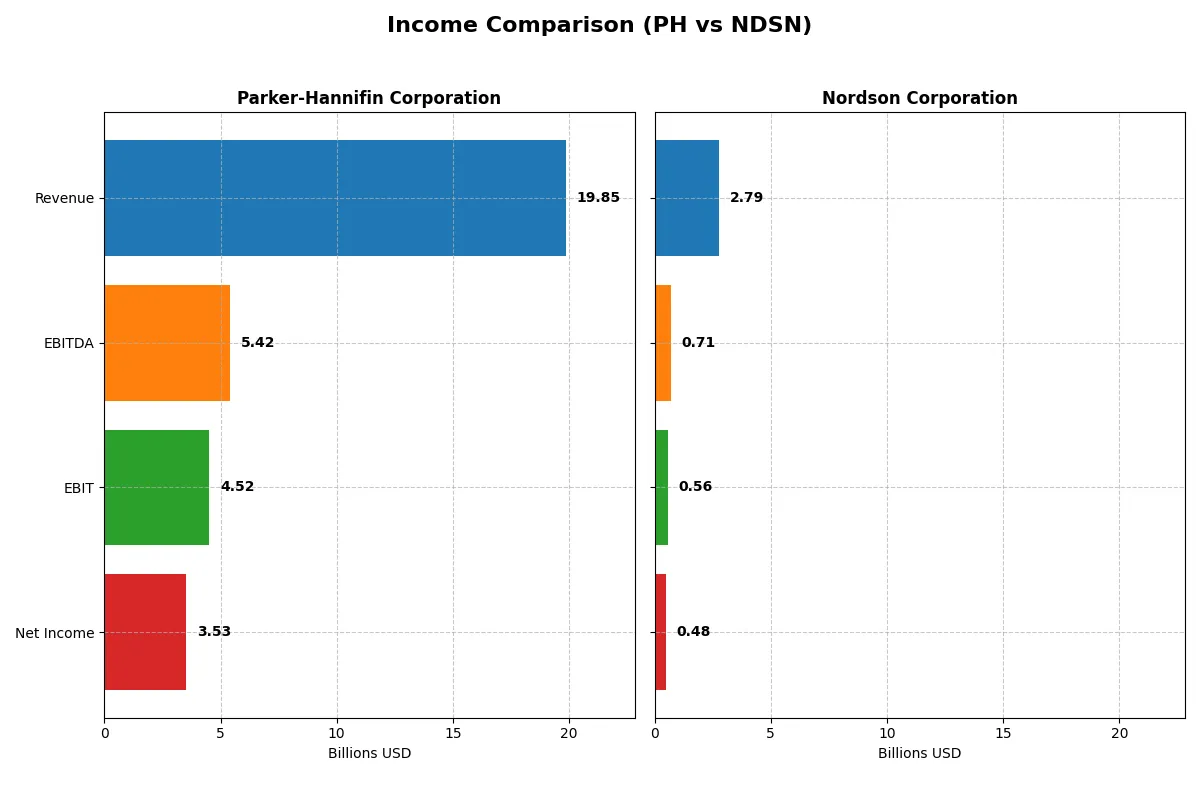
This data dissects the core profitability and scalability of both corporate engines to reveal who dominates the bottom line:
| Metric | Parker-Hannifin Corporation (PH) | Nordson Corporation (NDSN) |
|---|---|---|
| Revenue | 19.85B | 2.79B |
| Cost of Revenue | 12.54B | 1.25B |
| Operating Expenses | 3.26B | 828M |
| Gross Profit | 7.32B | 1.54B |
| EBITDA | 5.42B | 712M |
| EBIT | 4.52B | 561M |
| Interest Expense | 409M | 101M |
| Net Income | 3.53B | 484M |
| EPS | 27.52 | 8.56 |
| Fiscal Year | 2025 | 2025 |
Income Statement Analysis: The Bottom-Line Duel
This income statement comparison reveals the true operational efficiency and profitability strength driving each company’s financial engine.
Parker-Hannifin Corporation Analysis
Parker-Hannifin generates robust revenue near 19.85B in 2025 with net income surging to 3.53B, reflecting a strong upward trajectory over five years. The firm sustains healthy gross margins at 36.85% and net margins at 17.79%, indicating disciplined cost control. Despite a slight revenue dip in 2025, Parker-Hannifin’s EBIT and net margin growth exhibit impressive momentum and operational efficiency.
Nordson Corporation Analysis
Nordson posts a smaller scale with 2.79B revenue in 2025 and net income of 484M, growing modestly over the period. Its gross margin excels at 55.16%, showcasing strong production efficiency, while net margin holds steady at 17.35%. However, EBIT declined 16.8% year-over-year, signaling pressure on operating profits despite stable revenue expansion and solid EPS growth.
Margin Strength vs. Scale and Momentum
Parker-Hannifin leads with significant net income growth and strong margin expansion despite a marginal revenue contraction. Nordson impresses with superior gross margins but faces EBIT headwinds and sluggish net margin trends. For investors, Parker-Hannifin’s scale and growing profitability offer a more compelling profile than Nordson’s higher margin yet challenged operating efficiency.
Financial Ratios Comparison
These vital ratios act as a diagnostic tool to expose the underlying fiscal health, valuation premiums, and capital efficiency of the companies compared below:
| Ratios | Parker-Hannifin (PH) | Nordson (NDSN) |
|---|---|---|
| ROE | 25.8% | 15.9% |
| ROIC | 13.7% | 10.5% |
| P/E | 25.4x | 27.1x |
| P/B | 6.5x | 4.3x |
| Current Ratio | 1.19 | 1.64 |
| Quick Ratio | 0.71 | 1.05 |
| D/E | 0.69 | 0.69 |
| Debt-to-Assets | 32.2% | 35.4% |
| Interest Coverage | 9.93x | 7.04x |
| Asset Turnover | 0.67 | 0.47 |
| Fixed Asset Turnover | 6.76 | 4.70 |
| Payout ratio | 24.4% | 37.0% |
| Dividend yield | 0.96% | 1.36% |
| Fiscal Year | 2025 | 2025 |
Efficiency & Valuation Duel: The Vital Signs
Ratios serve as a company’s DNA, exposing hidden risks and operational strengths essential for informed investment decisions.
Parker-Hannifin Corporation
Parker-Hannifin posts a strong ROE of 25.8% and a robust net margin of 17.8%, signaling excellent profitability. However, its P/E at 25.4 and P/B at 6.55 suggest the stock is stretched. The company returns value through a modest 0.96% dividend yield, balancing payouts with reinvestment in growth and innovation.
Nordson Corporation
Nordson delivers solid profitability with a 15.9% ROE and a 17.4% net margin. Its valuation appears elevated, with a P/E of 27.1, indicating an expensive stock. The firm maintains a 1.36% dividend yield and favors capital allocation toward operational efficiency, supported by a favorable current ratio and quick ratio above 1, enhancing liquidity.
Valuation Stretch vs. Operational Strength
Parker-Hannifin offers superior profitability but trades at a stretched valuation with lower dividend yield. Nordson presents a more balanced liquidity profile with decent profitability but at a higher P/E. Investors focused on earnings quality may prefer Parker-Hannifin, while those valuing operational liquidity and steady dividends might lean toward Nordson.
Which one offers the Superior Shareholder Reward?
I see Parker-Hannifin (PH) pays a modest dividend yield near 0.96% with a payout ratio around 24%, supported by strong free cash flow coverage at 88%. Its buyback program complements dividends, enhancing total yield sustainably. Nordson (NDSN) yields slightly higher at 1.36% with a 37% payout ratio but exhibits a more aggressive buyback cadence. However, NDSN’s higher payout and valuation multiples imply less margin for error. I judge PH’s balanced dividend-buyback mix and prudent coverage as more sustainable, offering a superior total shareholder reward in 2026.
Comparative Score Analysis: The Strategic Profile
The radar chart reveals the fundamental DNA and trade-offs of Parker-Hannifin Corporation and Nordson Corporation, highlighting their financial strengths and vulnerabilities:
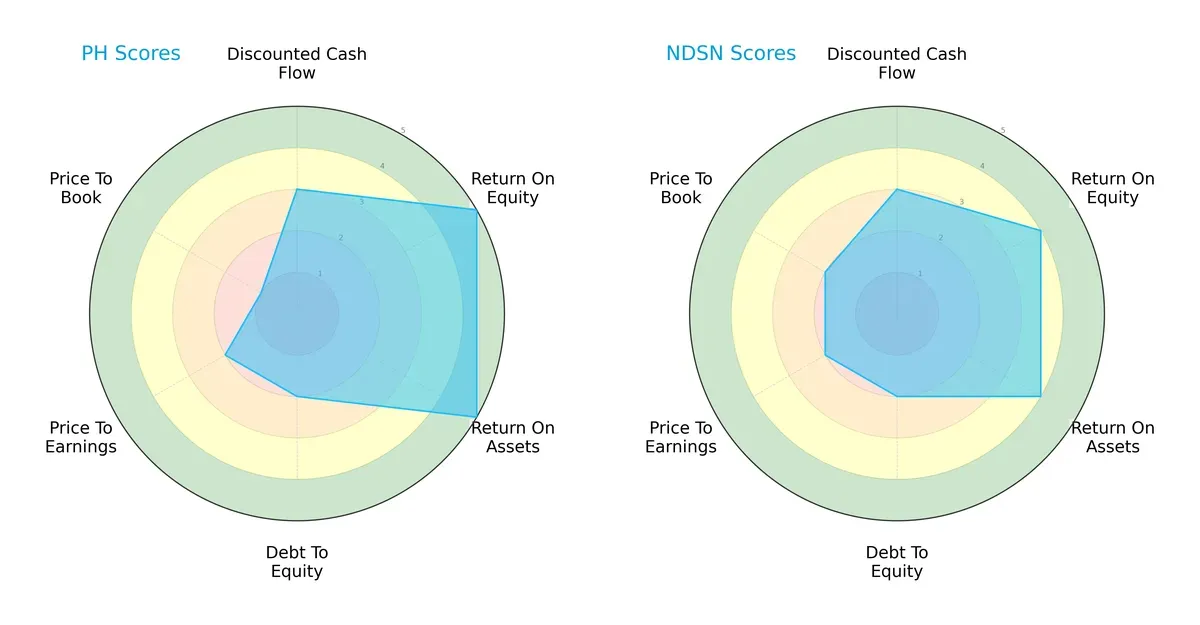
Parker-Hannifin excels in return on equity (5) and assets (5), showing superior operational efficiency. Nordson holds a slight edge in price-to-book valuation (2 vs. 1), suggesting better market pricing discipline. Both share moderate discounted cash flow and debt-to-equity scores (3 and 2 respectively). Overall, Parker-Hannifin’s profile is skewed toward profitability, while Nordson presents a more balanced valuation approach.
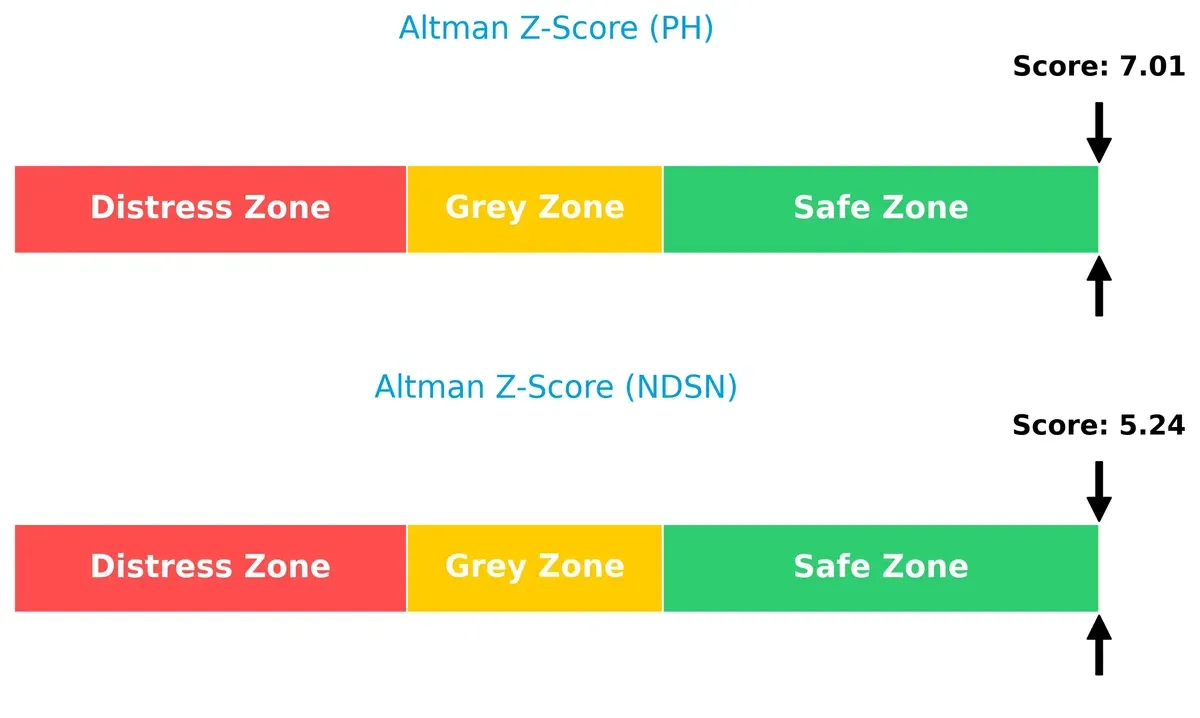
Bankruptcy Risk: Solvency Showdown
Parker-Hannifin’s Altman Z-Score of 7.01 outpaces Nordson’s 5.24, indicating a stronger buffer against bankruptcy risks in this economic cycle:
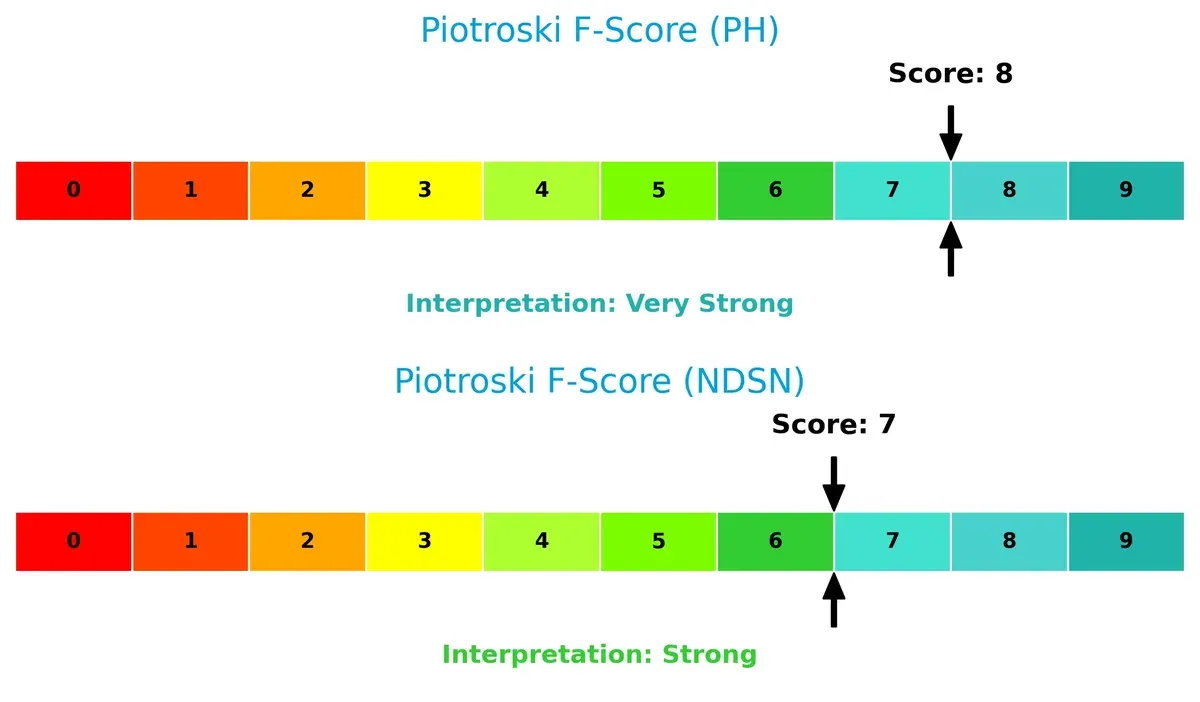
Financial Health: Quality of Operations
Parker-Hannifin scores an 8 on the Piotroski F-Score, slightly ahead of Nordson’s 7, reflecting marginally stronger internal financial controls and operational robustness:
How are the two companies positioned?
This section dissects the operational DNA of PH and NDSN by comparing their revenue distribution and internal dynamics. The goal is to confront their economic moats to reveal which model offers the most resilient competitive advantage today.
Revenue Segmentation: The Strategic Mix
This visual comparison dissects how Parker-Hannifin Corporation and Nordson Corporation diversify their income streams and where their primary sector bets lie:
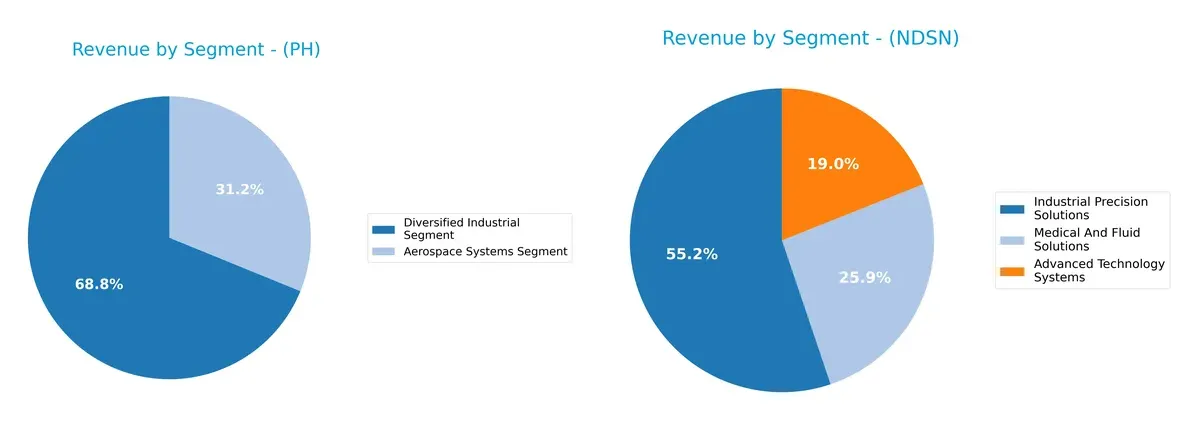
Parker-Hannifin anchors revenue in its Diversified Industrial Segment at $13.7B for 2025, dwarfing its Aerospace Systems at $6.2B. Nordson spreads its $2.7B total more evenly across Industrial Precision Solutions ($1.5B), Medical and Fluid Solutions ($695M), and Advanced Technology Systems ($510M). Parker-Hannifin’s concentration signals infrastructure dominance but elevates sector risk. Nordson’s balanced mix suggests strategic diversification, reducing dependence on any single market.
Strengths and Weaknesses Comparison
This table compares the Strengths and Weaknesses of Parker-Hannifin Corporation and Nordson Corporation:
PH Strengths
- Strong profitability with 25.81% ROE and 17.79% net margin
- High fixed asset turnover at 6.76
- Diversified revenue from Aerospace and Industrial segments
- Leading North American and European market presence
NDSN Strengths
- Solid profitability with 17.35% net margin and 15.92% ROE
- Favorable liquidity ratios (current 1.64, quick 1.05)
- Revenue spread across three distinct segments
- Geographically diversified with Americas, Asia Pacific, Europe exposure
PH Weaknesses
- Unfavorable valuation metrics (PE 25.38, PB 6.55)
- Low quick ratio (0.71) signals weaker short-term liquidity
- Dividend yield below 1%
- Moderate debt levels with 32.16% debt to assets
NDSN Weaknesses
- Higher PE ratio (27.1) and moderately unfavorable PB (4.31)
- Lower asset turnover at 0.47 suggests less efficient asset use
- Interest coverage lower at 5.55
- Dividend yield neutral but not a key strength
Parker-Hannifin excels in profitability and asset efficiency, supported by a broad industrial and aerospace base. Nordson shows stronger liquidity and balanced segment diversification but faces efficiency and valuation challenges. These factors shape their strategic focus on operational efficiency and capital allocation.
The Moat Duel: Analyzing Competitive Defensibility
A structural moat is the only reliable shield protecting long-term profits from relentless competitive erosion in industrial machinery:
Parker-Hannifin Corporation: Durable Innovation and Scale Economies
Parker-Hannifin’s moat stems from deep engineering expertise and broad product integration, reflected in a strong 22.75% EBIT margin and growing ROIC. Its global footprint and aerospace innovations promise to deepen this advantage through 2026.
Nordson Corporation: Precision Niche with Specialized Technology
Nordson’s competitive edge lies in specialized dispensing technology and strong gross margins at 55.16%, contrasting Parker-Hannifin’s scale. However, its declining ROIC signals margin pressure, though new precision applications could offer selective growth.
Moat Strength Battle: Engineering Scale vs. Specialized Precision
Parker-Hannifin holds a wider, more durable moat with a growing ROIC and stable margins. Nordson creates value but faces profitability headwinds. Parker-Hannifin is better positioned to defend market share through innovation and scale.
Which stock offers better returns?
The past year reveals strong price advances for both stocks, with Parker-Hannifin showing remarkable acceleration and Nordson maintaining steady bullish momentum.
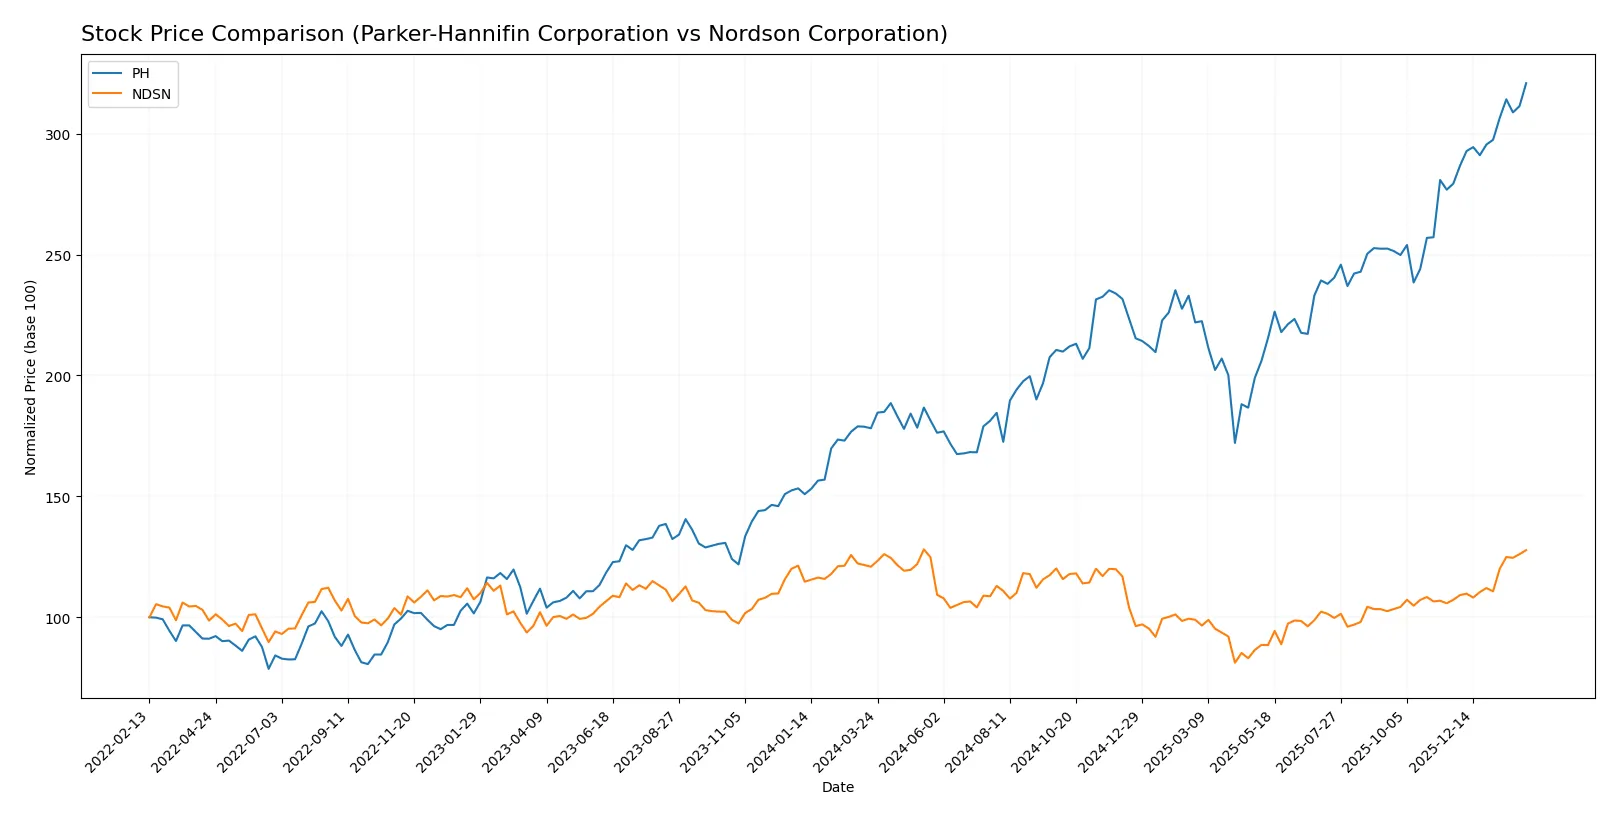
Trend Comparison
Parker-Hannifin’s stock surged 80.11% over the last 12 months, displaying clear acceleration and reaching a high of 964.33, supported by strong buyer dominance and rising volume.
Nordson gained 5.69% over the same period with bullish acceleration, a peak price of 278.89, and moderate volatility, also backed by increasing buyer activity.
Parker-Hannifin delivered a substantially higher market return than Nordson, demonstrating stronger upward momentum and greater price appreciation over the past year.
Target Prices
Analysts present a solid target price consensus for Parker-Hannifin Corporation and Nordson Corporation, reflecting moderate upside potential.
| Company | Target Low | Target High | Consensus |
|---|---|---|---|
| Parker-Hannifin Corporation | 825 | 1,139 | 995.46 |
| Nordson Corporation | 240 | 295 | 274.17 |
The consensus target for Parker-Hannifin exceeds its current price of 964.33, suggesting upside near 3.3%. Nordson’s consensus target of 274.17 aligns closely with its current price of 278.17, indicating a neutral stance from analysts.

Don’t Let Luck Decide Your Entry Point
Optimize your entry points with our advanced ProRealTime indicators. You’ll get efficient buy signals with precise price targets for maximum performance. Start outperforming now!
How do institutions grade them?
Parker-Hannifin Corporation Grades
This table shows recent grades from reliable financial institutions for Parker-Hannifin Corporation.
| Grading Company | Action | New Grade | Date |
|---|---|---|---|
| Jefferies | Maintain | Buy | 2026-01-30 |
| Wells Fargo | Maintain | Overweight | 2026-01-30 |
| JP Morgan | Maintain | Overweight | 2026-01-30 |
| Stifel | Maintain | Hold | 2026-01-30 |
| Citigroup | Maintain | Buy | 2026-01-30 |
| Barclays | Maintain | Overweight | 2026-01-30 |
| Stifel | Maintain | Hold | 2026-01-23 |
| JP Morgan | Maintain | Overweight | 2026-01-16 |
| Morgan Stanley | Maintain | Equal Weight | 2026-01-14 |
| Wells Fargo | Maintain | Overweight | 2026-01-07 |
Nordson Corporation Grades
This table presents recent reliable grades for Nordson Corporation from recognized financial firms.
| Grading Company | Action | New Grade | Date |
|---|---|---|---|
| DA Davidson | Maintain | Buy | 2025-12-12 |
| Baird | Maintain | Neutral | 2025-12-12 |
| DA Davidson | Maintain | Buy | 2025-12-11 |
| Keybanc | Maintain | Overweight | 2025-12-11 |
| Oppenheimer | Maintain | Outperform | 2025-08-25 |
| Baird | Maintain | Neutral | 2025-08-22 |
| Keybanc | Maintain | Overweight | 2025-07-15 |
| Oppenheimer | Upgrade | Outperform | 2025-05-30 |
| Baird | Maintain | Neutral | 2025-05-30 |
| Keybanc | Maintain | Overweight | 2025-04-08 |
Which company has the best grades?
Parker-Hannifin receives consistently positive grades, mostly “Buy” and “Overweight.” Nordson shows a mix of “Buy,” “Overweight,” and several “Neutral” ratings. Parker-Hannifin’s stronger consensus may inspire greater investor confidence.
Risks specific to each company
The following categories identify the critical pressure points and systemic threats facing both firms in the 2026 market environment:
1. Market & Competition
Parker-Hannifin Corporation
- Faces intense competition in diversified industrial and aerospace segments, requiring constant innovation to maintain market share.
Nordson Corporation
- Operates in specialized dispensing and coating systems markets with niche competitors, relying on technological differentiation.
2. Capital Structure & Debt
Parker-Hannifin Corporation
- Maintains moderate leverage with a debt-to-equity ratio of 0.69 and neutral debt-to-assets at 32%, supporting financial flexibility.
Nordson Corporation
- Similar debt-to-equity ratio of 0.69 but slightly higher debt-to-assets at 35%, indicating comparable but slightly higher leverage risk.
3. Stock Volatility
Parker-Hannifin Corporation
- Beta of 1.24 suggests above-market volatility, increasing risk during market downturns.
Nordson Corporation
- Beta close to 1.0 indicates market-level volatility, implying more stable stock price behavior relative to the market.
4. Regulatory & Legal
Parker-Hannifin Corporation
- Aerospace exposure entails compliance with stringent defense and aviation regulations, raising operational risks.
Nordson Corporation
- Focus on industrial precision and medical components involves regulatory scrutiny but less exposure to defense-specific rules.
5. Supply Chain & Operations
Parker-Hannifin Corporation
- Complex global supply chains for industrial and aerospace components create risks from raw material costs and logistics disruptions.
Nordson Corporation
- Niche production processes and less diversified operations may heighten vulnerability to supplier or manufacturing interruptions.
6. ESG & Climate Transition
Parker-Hannifin Corporation
- Industrial and aerospace sectors face increasing pressure to reduce emissions and improve sustainability, requiring capital investments.
Nordson Corporation
- Advanced technology solutions may offer better adaptability to ESG standards but still subject to energy and material use concerns.
7. Geopolitical Exposure
Parker-Hannifin Corporation
- Aerospace segment links to military contracts increases sensitivity to geopolitical tensions and defense spending cycles.
Nordson Corporation
- Primarily commercial industrial markets limit direct geopolitical risk but global supply chains remain exposed to trade policies.
Which company shows a better risk-adjusted profile?
Parker-Hannifin’s primary risk lies in its elevated market volatility and aerospace regulatory demands. Nordson’s main pressure is operational concentration and supply chain sensitivity. Nordson’s lower stock volatility and stronger liquidity ratios suggest a more balanced risk-adjusted profile. However, Parker-Hannifin’s robust Altman Z-Score and stronger profitability metrics indicate solid financial resilience despite these risks.
Final Verdict: Which stock to choose?
Parker-Hannifin’s superpower lies in its robust capital allocation and growing profitability, evidenced by a durable economic moat. Its main point of vigilance is a less-than-ideal liquidity profile, which could pressure operations in downturns. This stock fits best within an aggressive growth portfolio seeking value creation through operational excellence.
Nordson Corporation commands a strategic moat through its recurring revenue streams and solid balance sheet strength. It offers a safer profile relative to Parker-Hannifin, with better liquidity and financial stability. Nordson suits a GARP (Growth at a Reasonable Price) portfolio aiming for steady income combined with moderate growth.
If you prioritize durable profitability with a focus on aggressive value creation, Parker-Hannifin is the compelling choice due to its superior ROIC expansion and operational efficiency. However, if you seek better stability and a safer balance sheet in your portfolio, Nordson offers better downside protection and consistent cash flow, despite a declining ROIC trend.
Disclaimer: Investment carries a risk of loss of initial capital. The past performance is not a reliable indicator of future results. Be sure to understand risks before making an investment decision.
Go Further
I encourage you to read the complete analyses of Parker-Hannifin Corporation and Nordson Corporation to enhance your investment decisions: