Home > Comparison > Industrials > OTIS vs NDSN
The strategic rivalry between Otis Worldwide Corporation and Nordson Corporation shapes the industrial machinery sector’s evolution. Otis excels as a capital-intensive manufacturer and servicer of elevators and escalators worldwide. In contrast, Nordson focuses on high-precision dispensing and coating systems, emphasizing advanced technology solutions. This analysis pits Otis’s infrastructure dominance against Nordson’s innovation-driven model to identify which company delivers superior risk-adjusted returns for a diversified industrial portfolio.
Table of contents
Companies Overview
Otis Worldwide Corporation and Nordson Corporation both hold pivotal roles in the industrial machinery sector, shaping their respective markets with distinct specializations.
Otis Worldwide Corporation: Leader in Vertical Transportation
Otis dominates the elevator and escalator market through its core business of manufacturing, installing, and servicing vertical transportation systems. Its revenue streams split between new equipment sales and extensive maintenance services. In 2026, Otis strategically focuses on expanding its global service network, leveraging 34,000 service mechanics to sustain steady recurring revenue.
Nordson Corporation: Precision Fluid Dispensing Innovator
Nordson specializes in engineering and marketing industrial precision solutions for dispensing adhesives, coatings, and fluids. Its revenue derives from Industrial Precision Solutions and Advanced Technology Solutions segments, targeting a wide range of manufacturing applications. The company’s 2026 strategy emphasizes enhancing automation and specialty coatings to capture growth in high-tech manufacturing sectors.
Strategic Collision: Similarities & Divergences
Both companies excel in industrial machinery but diverge sharply in business philosophy: Otis relies on a vast service infrastructure and direct installation, while Nordson pursues advanced automation with a mix of direct and distributor sales. Their primary battleground is the industrial equipment market, where Otis focuses on infrastructure projects and Nordson targets precision manufacturing. This creates distinct investment profiles: stable service-driven cash flow versus innovation-led growth potential.
Income Statement Comparison
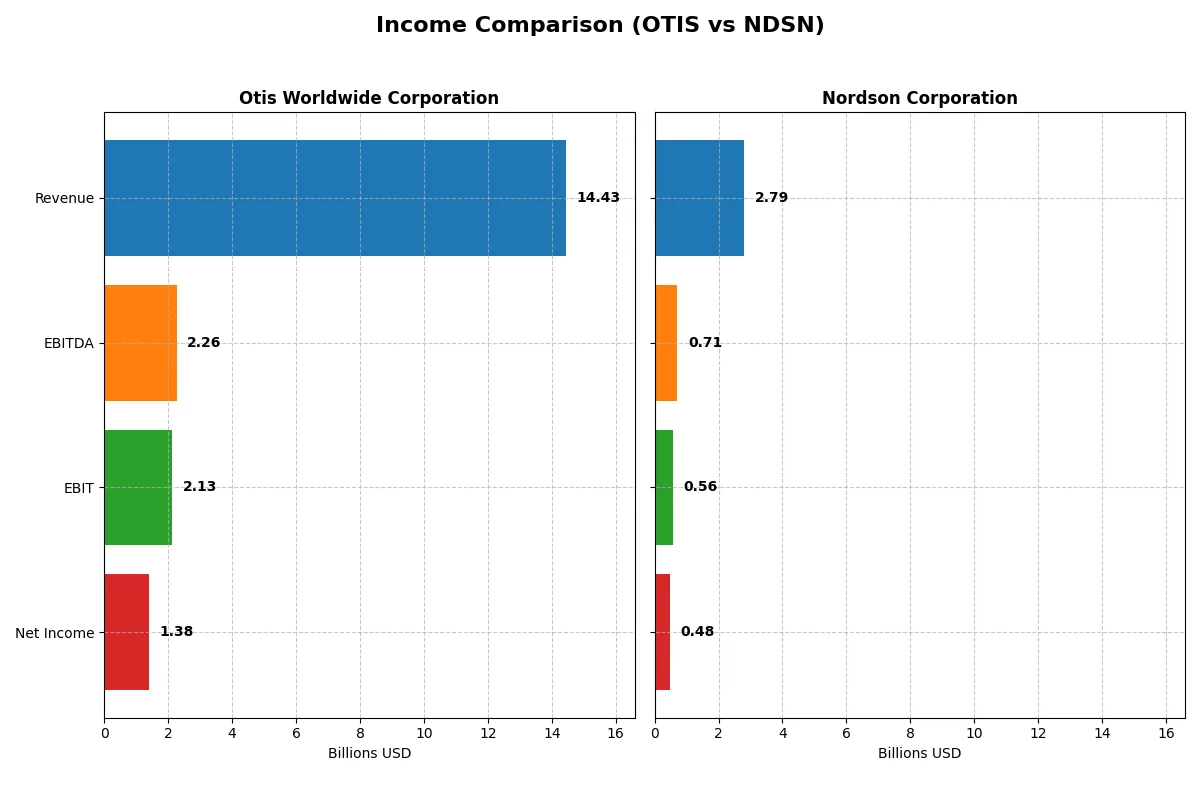
This data dissects the core profitability and scalability of both corporate engines to reveal who dominates the bottom line:
| Metric | Otis Worldwide Corporation (OTIS) | Nordson Corporation (NDSN) |
|---|---|---|
| Revenue | 14.43B | 2.79B |
| Cost of Revenue | 10.04B | 1.25B |
| Operating Expenses | 2.20B | 828M |
| Gross Profit | 4.40B | 1.54B |
| EBITDA | 2.26B | 712M |
| EBIT | 2.13B | 561M |
| Interest Expense | 196M | 101M |
| Net Income | 1.38B | 484M |
| EPS | 3.53 | 8.56 |
| Fiscal Year | 2025 | 2025 |
Income Statement Analysis: The Bottom-Line Duel
This income statement comparison reveals which company runs a more efficient and profitable corporate engine in the current market landscape.
Otis Worldwide Corporation Analysis
Otis’s revenue climbed modestly to $14.4B in 2025, with net income at $1.38B, marking an 11% growth over five years. The firm sustains healthy gross margins near 30.5% and net margins around 9.6%, reflecting solid operational control. However, a slight net margin contraction last year signals emerging pressure on profitability despite stable revenue.
Nordson Corporation Analysis
Nordson posted $2.79B in revenue for 2025, growing steadily by 18% over the past five years. It impresses with a robust 55% gross margin and a 17.4% net margin, demonstrating superior profitability and cost management. Though EBIT declined nearly 17% last year, its consistent EPS growth indicates efficient capital utilization and shareholder value creation.
Margin Strength vs. Growth Consistency
Nordson leads with stronger margins and higher revenue growth over the longer term, despite last year’s EBIT setback. Otis delivers steadier net income gains but faces recent margin pressure. For investors prioritizing profitability and growth momentum, Nordson’s profile offers a more compelling fundamental edge.
Financial Ratios Comparison
These vital ratios act as a diagnostic tool to expose the underlying fiscal health, valuation premiums, and capital efficiency of the companies compared below:
| Ratios | Otis Worldwide Corporation (OTIS) | Nordson Corporation (NDSN) |
|---|---|---|
| ROE | -25.7% (2025) | 15.9% (2025) |
| ROIC | 40.7% (2025) | 10.5% (2025) |
| P/E | 24.8x (2025) | 27.1x (2025) |
| P/B | -6.4x (2025) | 4.3x (2025) |
| Current Ratio | 0.85 (2025) | 1.64 (2025) |
| Quick Ratio | 0.77 (2025) | 1.05 (2025) |
| D/E (Debt-to-Equity) | -1.62 (2025) | 0.69 (2025) |
| Debt-to-Assets | 82.1% (2025) | 35.4% (2025) |
| Interest Coverage | 11.2x (2025) | 7.0x (2025) |
| Asset Turnover | 1.35 (2025) | 0.47 (2025) |
| Fixed Asset Turnover | 11.1 (2025) | 4.7 (2025) |
| Payout Ratio | 46.7% (2025) | 37.0% (2025) |
| Dividend Yield | 1.88% (2025) | 1.36% (2025) |
| Fiscal Year | 2025 | 2025 |
Efficiency & Valuation Duel: The Vital Signs
Ratios act as a company’s DNA, revealing hidden risks and operational excellence that shape investor confidence and valuation benchmarks.
Otis Worldwide Corporation
Otis shows a mixed profitability profile, with an unfavorable ROE of -25.67% but a strong ROIC of 40.74%, indicating effective capital deployment. The stock trades at a neutral P/E of 24.85, suggesting fair valuation. Otis offers a modest 1.88% dividend yield, rewarding shareholders while balancing reinvestment in R&D.
Nordson Corporation
Nordson delivers solid profitability, with a 15.92% ROE and a robust 17.35% net margin. However, its valuation is stretched, trading at a higher P/E of 27.1 and P/B of 4.31. The company maintains a moderate 1.36% dividend yield, reflecting steady returns amid growth investments and operational efficiency.
Valuation Balance vs. Profitability Strength
Otis balances operational efficiency and capital returns despite weak equity profitability, while Nordson excels in profitability but commands a premium valuation. Investors seeking a blend of value and capital discipline may lean towards Otis, whereas those prioritizing profitability growth might favor Nordson’s profile.
Which one offers the Superior Shareholder Reward?
I compare Otis Worldwide Corporation (OTIS) and Nordson Corporation (NDSN) through their dividend yields, payout ratios, and share buybacks. Otis offers a 1.88% dividend yield with a 47% payout, well covered by free cash flow. Nordson yields 1.36% with a 37% payout, also comfortably covered. Otis shows moderate buyback activity supporting returns, while Nordson’s stronger free cash flow (11.7/share vs. Otis’s 3.7/share) fuels more aggressive buybacks and reinvestment. Nordson’s higher margins and robust cash flow suggest a more sustainable distribution model. I see Nordson as offering a superior total return profile in 2026.
Comparative Score Analysis: The Strategic Profile
The radar chart reveals the fundamental DNA and trade-offs of Otis Worldwide Corporation and Nordson Corporation, highlighting their distinct financial strengths and vulnerabilities:
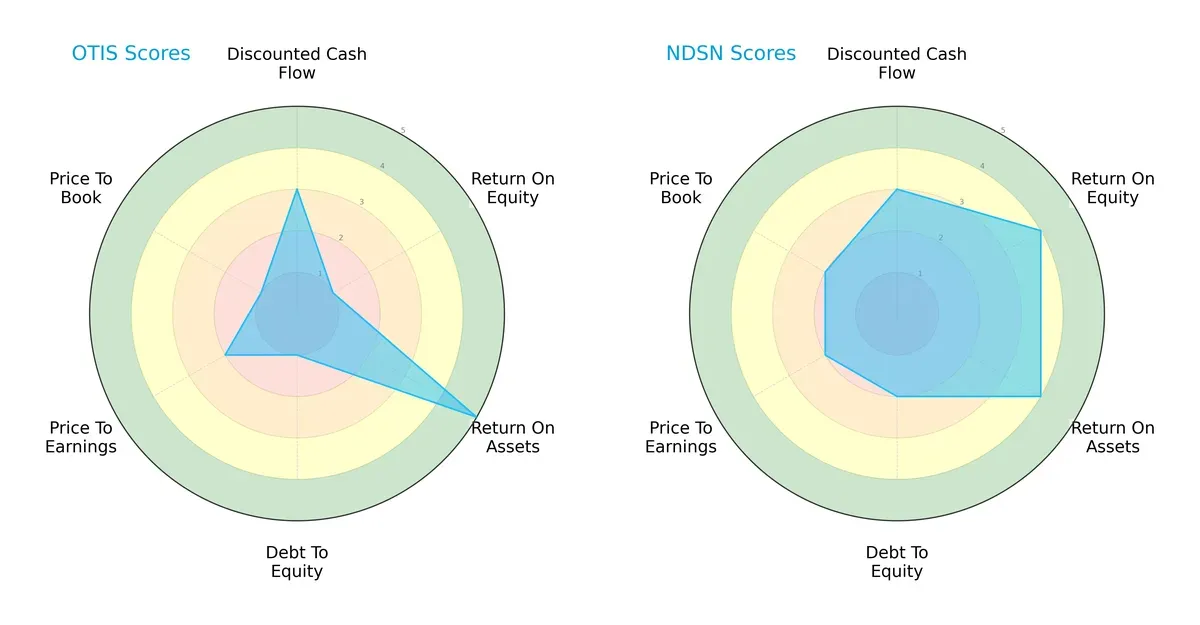
Nordson displays a more balanced financial profile with favorable ROE (4) and ROA (4) scores, and moderate debt-to-equity (2) and valuation metrics (PE and PB at 2). Otis has an edge in asset efficiency (ROA 5) but suffers from very unfavorable equity returns (ROE 1) and high leverage risk (debt-to-equity 1). Otis’s valuation scores (PE 2, PB 1) suggest possible undervaluation but also signal concerns. Overall, Nordson relies on consistent profitability and moderate leverage, while Otis depends heavily on asset utilization amid financial risk.
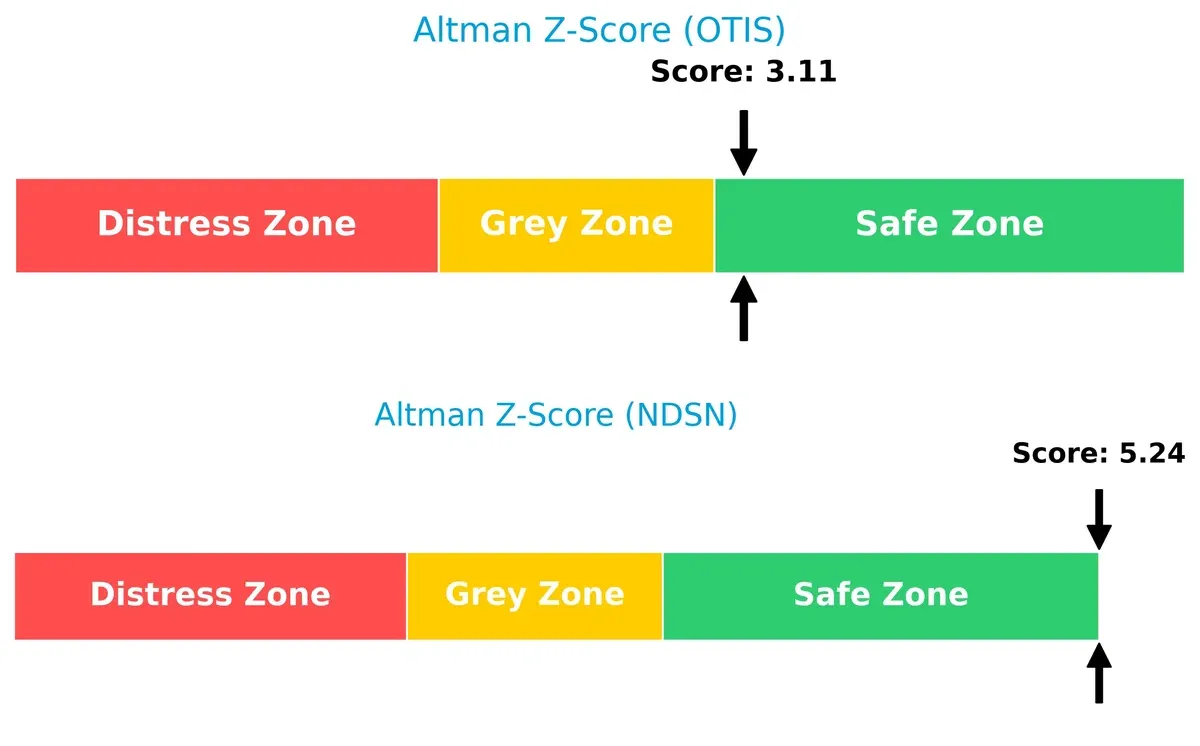
Bankruptcy Risk: Solvency Showdown
The Altman Z-Scores place both firms safely above distress levels, with Nordson at 5.24 and Otis at 3.11, implying robust solvency for long-term survival in this economic cycle:
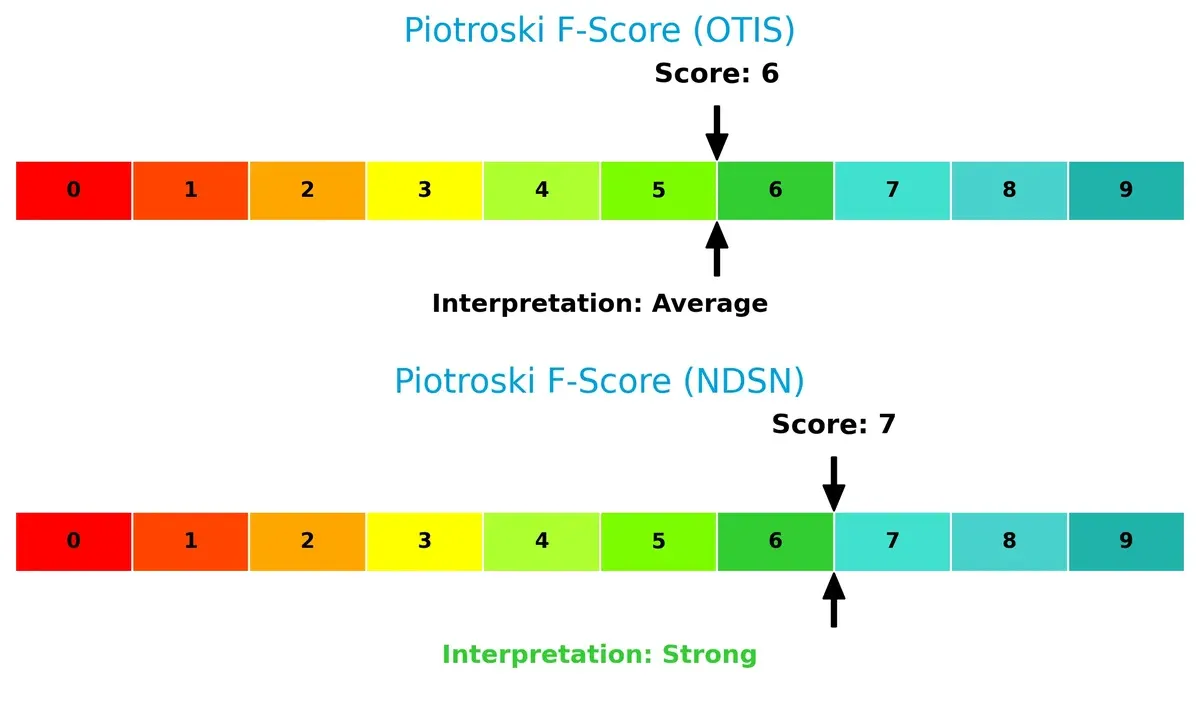
Financial Health: Quality of Operations
Nordson’s Piotroski F-Score of 7 versus Otis’s 6 indicates stronger financial health and operational quality. Otis’s slightly lower score raises mild red flags on internal metrics compared to Nordson’s stronger performance:
How are the two companies positioned?
This section dissects Otis and Nordson’s operational DNA by comparing their revenue distribution and internal dynamics. The goal is to confront their economic moats to identify the most resilient, sustainable competitive advantage today.
Revenue Segmentation: The Strategic Mix
This visual comparison dissects how Otis Worldwide Corporation and Nordson Corporation diversify their income streams and where their primary sector bets lie:
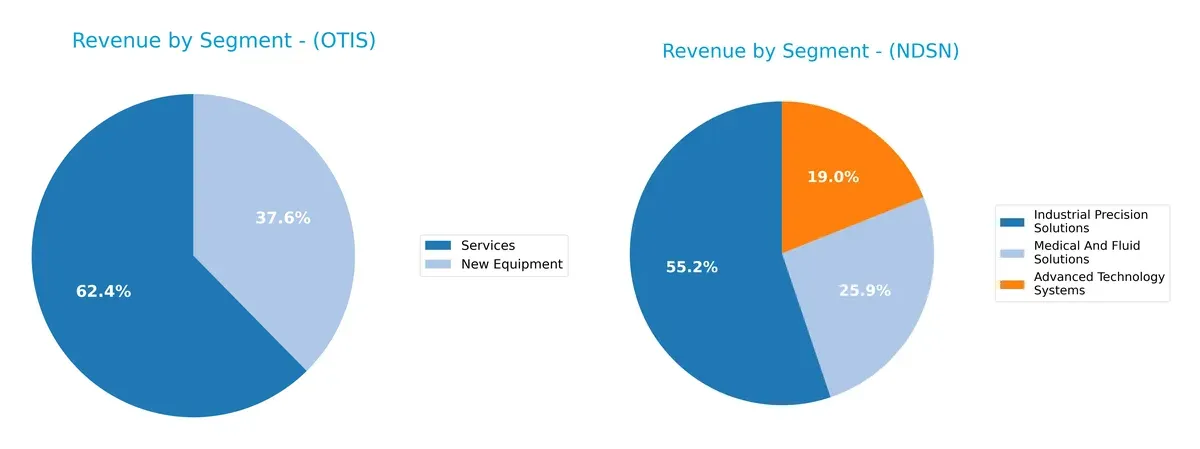
Otis anchors its revenue in two core segments: Services at $8.9B and New Equipment at $5.4B in 2024. This mix reflects a stable dual-revenue ecosystem with less concentration risk. Nordson, by contrast, pivots on three smaller but varied segments, led by Industrial Precision Solutions at $1.48B, Advanced Technology Systems at $510M, and Medical And Fluid Solutions at $695M. Nordson’s broader segmentation suggests strategic diversification but at smaller absolute scale compared to Otis.
Strengths and Weaknesses Comparison
This table compares the strengths and weaknesses of Otis Worldwide Corporation and Nordson Corporation:
Otis Strengths
- High ROIC at 40.74% surpasses WACC of 7.4%
- Strong asset and fixed asset turnover rates
- Favorable interest coverage ratio supports debt service
- Balanced revenue from new equipment and services
- Significant US and China market exposure
Nordson Strengths
- Strong net margin at 17.35% and positive ROE of 15.92%
- Favorable ROIC of 10.49% above neutral WACC
- Solid current and quick ratios indicate liquidity strength
- Diversified product segments across technology and medical solutions
- Geographic presence across Americas, Asia Pacific, and Europe
Otis Weaknesses
- Negative ROE at -25.67% signals shareholder return issues
- Low current and quick ratios below 1 present liquidity concerns
- High debt-to-assets ratio at 82.14% implies leverage risk
- Negative price-to-book ratio unusual and concerning
- Heavy reliance on US and China may limit diversification
Nordson Weaknesses
- Elevated P/E at 27.1 and unfavorable P/B of 4.31 may signal overvaluation
- Asset turnover at 0.47 trails sector averages
- Debt-to-assets and D/E ratios are neutral but warrant monitoring
- Moderate dividend yield at 1.36%
Otis shows operational efficiency with strong asset utilization but faces financial leverage and liquidity challenges. Nordson exhibits robust profitability and liquidity but faces valuation concerns and lower asset turnover. These factors shape each company’s strategic focus on capital management and market expansion.
The Moat Duel: Analyzing Competitive Defensibility
A structural moat is the only shield protecting long-term profits from competition’s relentless erosion. Let’s dissect how Otis and Nordson defend their turf:
Otis Worldwide Corporation: Switching Costs Powerhouse
Otis leverages immense switching costs through its vast service network and maintenance contracts. Its 33% ROIC premium over WACC confirms strong value creation. New infrastructure projects in Asia could deepen this moat in 2026.
Nordson Corporation: Precision Engineering Moat
Nordson’s moat lies in its highly specialized adhesive and fluid control systems, distinct from Otis’s service model. Despite value creation, its 2.5% ROIC premium and shrinking trend signal margin pressure. Expansion into semiconductor coatings offers fresh growth avenues.
Service Network vs. Specialized Engineering: The Moat Showdown
Otis’s switching-cost moat is wider and more durable than Nordson’s precision engineering edge. Otis’s growing ROIC and stable margins better equip it to defend market share against competitive threats in 2026.
Which stock offers better returns?
The past year shows contrasting price moves: Otis Worldwide Corp declines steadily while Nordson Corp accelerates with strong gains and rising buyer dominance.
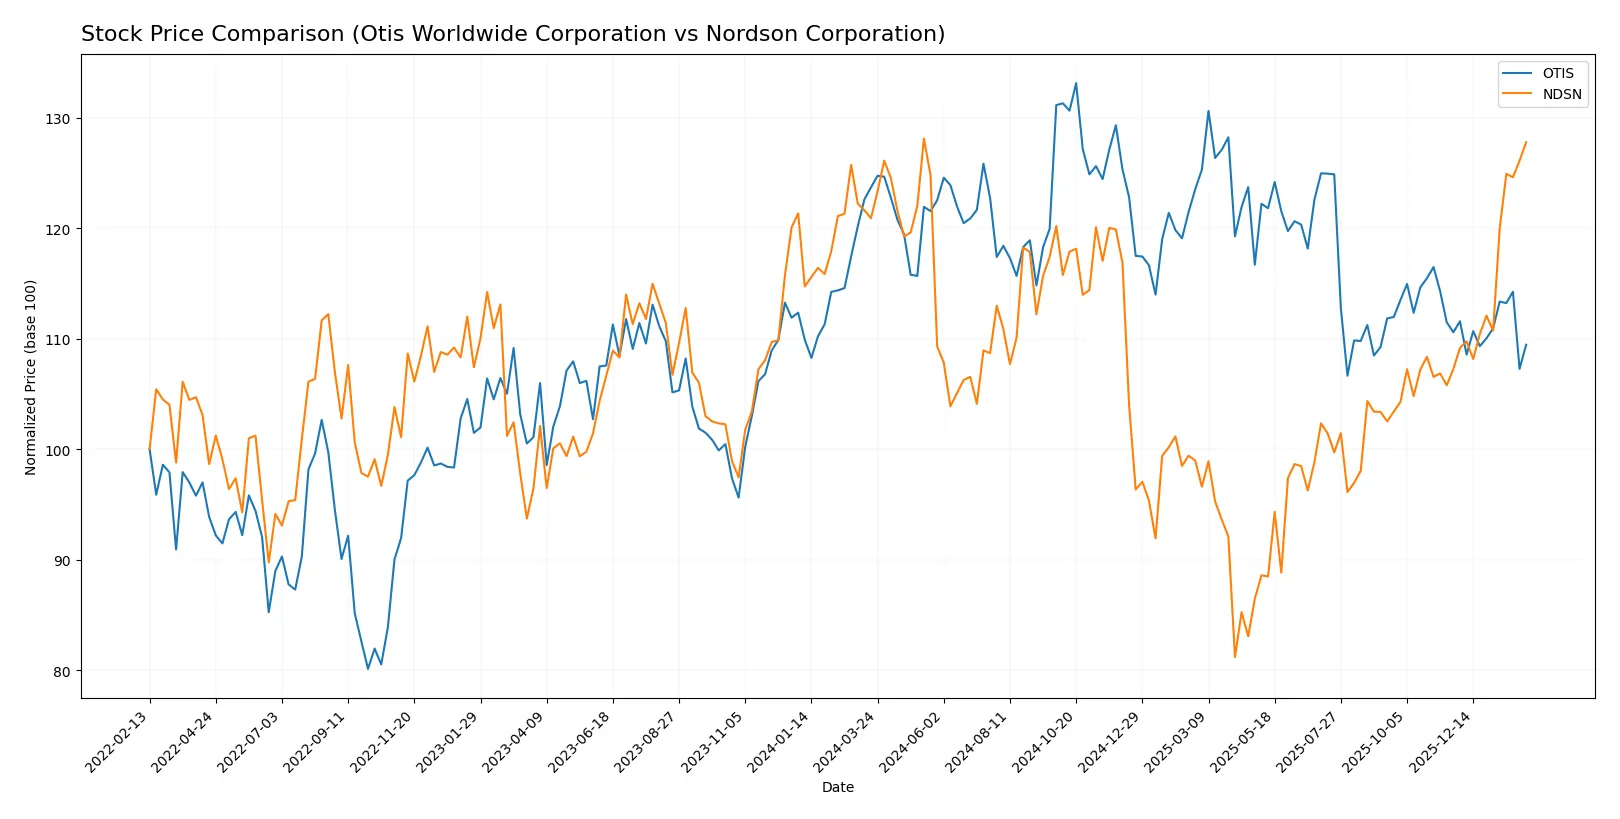
Trend Comparison
Otis Worldwide Corporation’s stock dropped 11.51% over the past 12 months, marking a bearish trend with accelerating decline and moderate volatility. The stock ranged between 84.93 and 106.01 during this period.
Nordson Corporation’s stock rose 5.69% over 12 months, reflecting a bullish trend with accelerating gains and high volatility. Recent months show a 19.14% surge, indicating strong upward momentum.
Nordson’s stock outperformed Otis, delivering positive returns versus Otis’s notable decline. Nordson exhibits stronger market performance and buyer dominance.
Target Prices
Analysts show a positive outlook with clear target price ranges for Otis Worldwide Corporation and Nordson Corporation.
| Company | Target Low | Target High | Consensus |
|---|---|---|---|
| Otis Worldwide Corporation | 92 | 109 | 97.75 |
| Nordson Corporation | 240 | 295 | 274.17 |
The consensus targets for both firms suggest upside potential versus current prices: Otis at $87.16 and Nordson at $278.17, reflecting analyst confidence in their operational execution and market positioning.

Don’t Let Luck Decide Your Entry Point
Optimize your entry points with our advanced ProRealTime indicators. You’ll get efficient buy signals with precise price targets for maximum performance. Start outperforming now!
How do institutions grade them?
The following tables summarize recent institutional grades for Otis Worldwide Corporation and Nordson Corporation:
Otis Worldwide Corporation Grades
This table shows the latest grades from major financial institutions for Otis Worldwide Corporation.
| Grading Company | Action | New Grade | Date |
|---|---|---|---|
| JP Morgan | Maintain | Overweight | 2026-01-16 |
| Wells Fargo | Maintain | Equal Weight | 2025-12-15 |
| Barclays | Maintain | Underweight | 2025-10-30 |
| JP Morgan | Maintain | Overweight | 2025-10-15 |
| Wolfe Research | Upgrade | Outperform | 2025-10-08 |
| Wells Fargo | Maintain | Equal Weight | 2025-10-06 |
| JP Morgan | Maintain | Overweight | 2025-09-18 |
| RBC Capital | Maintain | Outperform | 2025-07-28 |
| Wolfe Research | Upgrade | Peer Perform | 2025-07-25 |
| Wells Fargo | Maintain | Equal Weight | 2025-07-24 |
Nordson Corporation Grades
This table presents recent grades from recognized institutions for Nordson Corporation.
| Grading Company | Action | New Grade | Date |
|---|---|---|---|
| DA Davidson | Maintain | Buy | 2025-12-12 |
| Baird | Maintain | Neutral | 2025-12-12 |
| DA Davidson | Maintain | Buy | 2025-12-11 |
| Keybanc | Maintain | Overweight | 2025-12-11 |
| Oppenheimer | Maintain | Outperform | 2025-08-25 |
| Baird | Maintain | Neutral | 2025-08-22 |
| Keybanc | Maintain | Overweight | 2025-07-15 |
| Oppenheimer | Upgrade | Outperform | 2025-05-30 |
| Baird | Maintain | Neutral | 2025-05-30 |
| Keybanc | Maintain | Overweight | 2025-04-08 |
Which company has the best grades?
Nordson Corporation consistently receives Buy and Overweight ratings, suggesting stronger institutional confidence. Otis Worldwide’s grades are more mixed, ranging from Underweight to Outperform. Investors might view Nordson’s higher grades as a signal of relative strength.
Risks specific to each company
The following categories identify critical pressure points and systemic threats facing Otis Worldwide Corporation and Nordson Corporation in the 2026 market environment:
1. Market & Competition
Otis Worldwide Corporation
- Faces stiff competition in elevator and escalator markets globally; innovation and service quality are key battlegrounds.
Nordson Corporation
- Operates in precision dispensing and coating systems with niche industrial applications, facing competition from specialized tech firms.
2. Capital Structure & Debt
Otis Worldwide Corporation
- High debt-to-assets ratio (82%) signals significant leverage risk despite strong interest coverage.
Nordson Corporation
- Moderate leverage with debt-to-assets near 35%, showing balanced capital structure and manageable financial risk.
3. Stock Volatility
Otis Worldwide Corporation
- Beta around 1.01 indicates market-level volatility, reflecting sensitivity to industrial sector cycles.
Nordson Corporation
- Beta near 1.00 suggests stock moves roughly in line with market trends, implying moderate volatility.
4. Regulatory & Legal
Otis Worldwide Corporation
- Subject to safety and building regulations worldwide, with potential liabilities from product failures.
Nordson Corporation
- Faces compliance risks in environmental and product safety regulations, especially for advanced material handling systems.
5. Supply Chain & Operations
Otis Worldwide Corporation
- Large service network (34,000 mechanics) is a strength but also exposes it to operational disruptions.
Nordson Corporation
- Smaller workforce (8,000 employees) with complex product lines may face supply chain bottlenecks in advanced tech components.
6. ESG & Climate Transition
Otis Worldwide Corporation
- Pressured to innovate energy-efficient products and reduce carbon footprint due to global urbanization trends.
Nordson Corporation
- ESG risks tied to chemical handling and emissions in coating processes; opportunities in sustainable product development.
7. Geopolitical Exposure
Otis Worldwide Corporation
- Significant international exposure, especially in China, subjects it to trade tensions and regulatory shifts.
Nordson Corporation
- Global footprint in industrial markets but less concentrated exposure, reducing geopolitical risk impact.
Which company shows a better risk-adjusted profile?
Nordson’s balanced debt levels and stronger profitability metrics offer a more resilient risk profile. Otis’s high leverage and weaker equity returns raise caution despite operational scale. Nordson’s safer Altman Z-score (5.24 vs. 3.11) and stronger Piotroski score (7 vs. 6) underscore its financial stability. However, Otis’s extensive service network and market position remain competitive advantages if it manages debt prudently.
Final Verdict: Which stock to choose?
Otis Worldwide Corporation’s superpower lies in its robust capital efficiency and durable competitive moat, demonstrated by a ROIC far exceeding its cost of capital. This strength fuels consistent value creation despite its stretched liquidity position—a key point of vigilance. It fits well in portfolios seeking steady industrial growth with an appetite for operational leverage.
Nordson Corporation commands a strategic moat through its high-margin niche and recurring revenue streams, offering a cushion of financial stability absent in Otis. Its solid balance sheet and favorable income quality make it suitable for investors favoring GARP strategies that blend growth with reasonable safety.
If you prioritize capital efficiency and a proven track record of value creation, Otis outshines as the compelling choice due to its strong operating returns. However, if you seek better stability and recurring revenue security, Nordson offers a superior safety profile and growth consistency, commanding a premium valuation but potentially lower volatility.
Disclaimer: Investment carries a risk of loss of initial capital. The past performance is not a reliable indicator of future results. Be sure to understand risks before making an investment decision.
Go Further
I encourage you to read the complete analyses of Otis Worldwide Corporation and Nordson Corporation to enhance your investment decisions: