In the competitive industrial machinery sector, Nordson Corporation (NDSN) and JBT Marel Corporation (JBTM) stand out as innovative players with overlapping market footprints. Nordson specializes in precision dispensing and coating technologies, while JBT Marel focuses on advanced food processing systems and automation solutions. This comparison aims to clarify which company presents a more compelling investment opportunity in 2026, helping you make an informed decision for your portfolio.
Table of contents
Companies Overview
I will begin the comparison between Nordson Corporation and JBT Marel Corporation by providing an overview of these two companies and their main differences.
Nordson Corporation Overview
Nordson Corporation engineers, manufactures, and markets systems to dispense, apply, and control adhesives, coatings, polymers, and other fluids worldwide. It operates through two segments: Industrial Precision Solutions and Advanced Technology Solutions. Nordson serves multiple industries with automated dispensing, coating, assembly, and inspection technologies. Founded in 1935, it is headquartered in Westlake, Ohio, with a market cap of $14.6B and employs approximately 8,000 people.
JBT Marel Corporation Overview
JBT Marel Corporation delivers technology solutions for the food and beverage industry globally, offering processing, packaging, and automated material handling systems. Its products serve diverse markets including meat, seafood, bakery, pharmaceuticals, and fast-moving consumer goods. Formerly known as John Bean Technologies, it rebranded in 2025. Headquartered in Chicago, Illinois, JBT Marel has a market cap of $8.1B and employs about 11,700 staff.
Key similarities and differences
Both companies operate in the industrial machinery sector, focusing on specialized equipment and automation solutions. Nordson primarily targets fluid dispensing and coating applications across various manufacturing sectors, while JBT Marel concentrates on comprehensive processing and packaging technologies for the food and beverage industry. Nordson is older and larger by market cap, whereas JBT Marel has a broader global footprint and workforce.
Income Statement Comparison
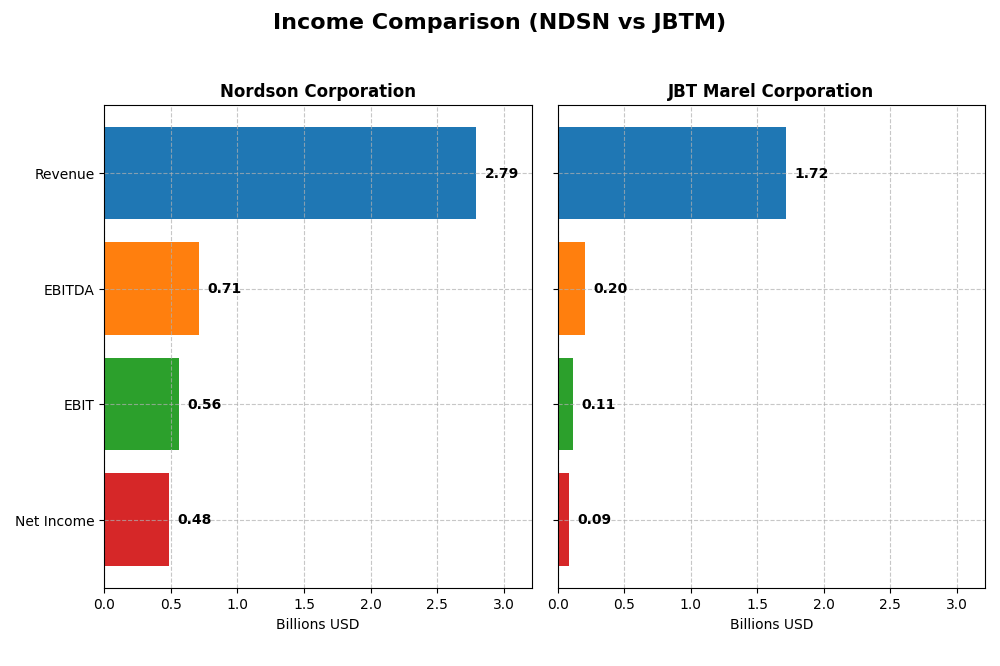
This table compares key income statement metrics of Nordson Corporation and JBT Marel Corporation for their most recent fiscal years, providing a snapshot of their financial performance.
| Metric | Nordson Corporation (NDSN) | JBT Marel Corporation (JBTM) |
|---|---|---|
| Market Cap | 14.6B | 8.1B |
| Revenue | 2.79B | 1.72B |
| EBITDA | 712M | 204M |
| EBIT | 561M | 115M |
| Net Income | 484M | 85M |
| EPS | 8.56 | 2.67 |
| Fiscal Year | 2025 | 2024 |
Income Statement Interpretations
Nordson Corporation
Nordson’s revenue rose steadily from $2.36B in 2021 to $2.79B in 2025, reflecting an 18.18% growth over five years. Net income also grew, albeit more modestly, by 6.63% over the same period to $484M in 2025. Margins have remained generally stable, with a 55.16% gross margin and a 17.35% net margin in 2025. However, EBIT declined by 16.79% in the most recent year, indicating some pressure on operating profitability despite overall positive trends.
JBT Marel Corporation
JBTM’s revenue showed a slight decline overall, from $1.73B in 2020 to $1.72B in 2024, with a negative 0.68% growth over five years. Net income dropped significantly by 21.51% in the same period, reaching $85M in 2024. Although the gross margin was a favorable 36.51%, EBIT margin and net margin were neutral at 6.69% and 4.98%, respectively. The most recent year revealed a sharp contraction in EBIT and net margin, declining 35.29% and 85.78%, signaling challenges in profitability.
Which one has the stronger fundamentals?
Nordson exhibits stronger fundamentals with consistent revenue and net income growth, higher and stable gross and net margins, and a favorable overall income statement evaluation. In contrast, JBTM faces declining revenues, net income, and profitability margins, reflected in an unfavorable income statement opinion. Nordson’s resilience in margins and earnings growth, despite some EBIT pressure, contrasts with JBTM’s significant profitability deterioration.
Financial Ratios Comparison
The following table presents a side-by-side comparison of key financial ratios for Nordson Corporation and JBT Marel Corporation, based on their most recent fiscal year data.
| Ratios | Nordson Corporation (2025) | JBT Marel Corporation (2024) |
|---|---|---|
| ROE | 15.9% | 5.5% |
| ROIC | 10.5% | 3.7% |
| P/E | 27.1 | 47.6 |
| P/B | 4.31 | 2.63 |
| Current Ratio | 1.64 | 3.48 |
| Quick Ratio | 1.05 | 3.04 |
| D/E (Debt to Equity) | 0.69 | 0.81 |
| Debt-to-Assets | 35.4% | 36.7% |
| Interest Coverage | 7.04 | 6.10 |
| Asset Turnover | 0.47 | 0.50 |
| Fixed Asset Turnover | 4.70 | 7.34 |
| Payout ratio | 37.0% | 15.3% |
| Dividend yield | 1.36% | 0.32% |
Interpretation of the Ratios
Nordson Corporation
Nordson presents a balanced financial profile with favorable net margin (17.35%), ROE (15.92%), and ROIC (10.49%), signaling efficient profitability and capital use. Some caution is warranted due to unfavorable PE (27.1) and PB (4.31) ratios, indicating potential overvaluation. The dividend yield of 1.36% is moderate, supported by sustainable payout metrics without excessive repurchases.
JBT Marel Corporation
JBT Marel’s ratios reveal weaknesses, including low net margin (4.98%), ROE (5.53%), and ROIC (3.65%), pointing to profitability challenges. Despite a favorable WACC (7.48%) and interest coverage (5.92), the company’s dividend yield is low at 0.32%, reflecting limited returns to shareholders. The current ratio is high but marked unfavorable, suggesting possible asset management issues.
Which one has the best ratios?
Nordson Corporation holds a more favorable ratio profile with half of its key metrics rated positively, demonstrating stronger profitability and financial health. In contrast, JBT Marel shows a higher proportion of unfavorable ratios, indicating weaker operational efficiency and shareholder returns. Overall, Nordson’s ratios suggest a relatively more solid financial footing.
Strategic Positioning
This section compares the strategic positioning of Nordson Corporation and JBT Marel Corporation, including market position, key segments, and exposure to technological disruption:
Nordson Corporation
- Strong market cap of 14.6B in industrial machinery with moderate competitive pressure.
- Diversified segments: Industrial Precision, Advanced Technology, and Medical & Fluid Solutions.
- Exposure through advanced dispensing and coating systems, including semiconductor equipment.
JBT Marel Corporation
- Market cap of 8.1B in industrial machinery, facing competitive challenges.
- Concentrated on food and beverage technology solutions across multiple industries.
- Exposure via automation and processing technologies in food, beverage, and health sectors.
Nordson Corporation vs JBT Marel Corporation Positioning
Nordson pursues a diversified approach across multiple industrial and medical segments, offering broad exposure but complex management. JBT Marel focuses on specialized technology for food and beverage processing, which limits diversification but may allow targeted innovation and market penetration.
Which has the best competitive advantage?
Nordson shows a slightly favorable moat with positive value creation despite declining ROIC, indicating some competitive advantage. JBT Marel has a very unfavorable moat, shedding value with declining profitability, suggesting weaker competitive positioning.
Stock Comparison
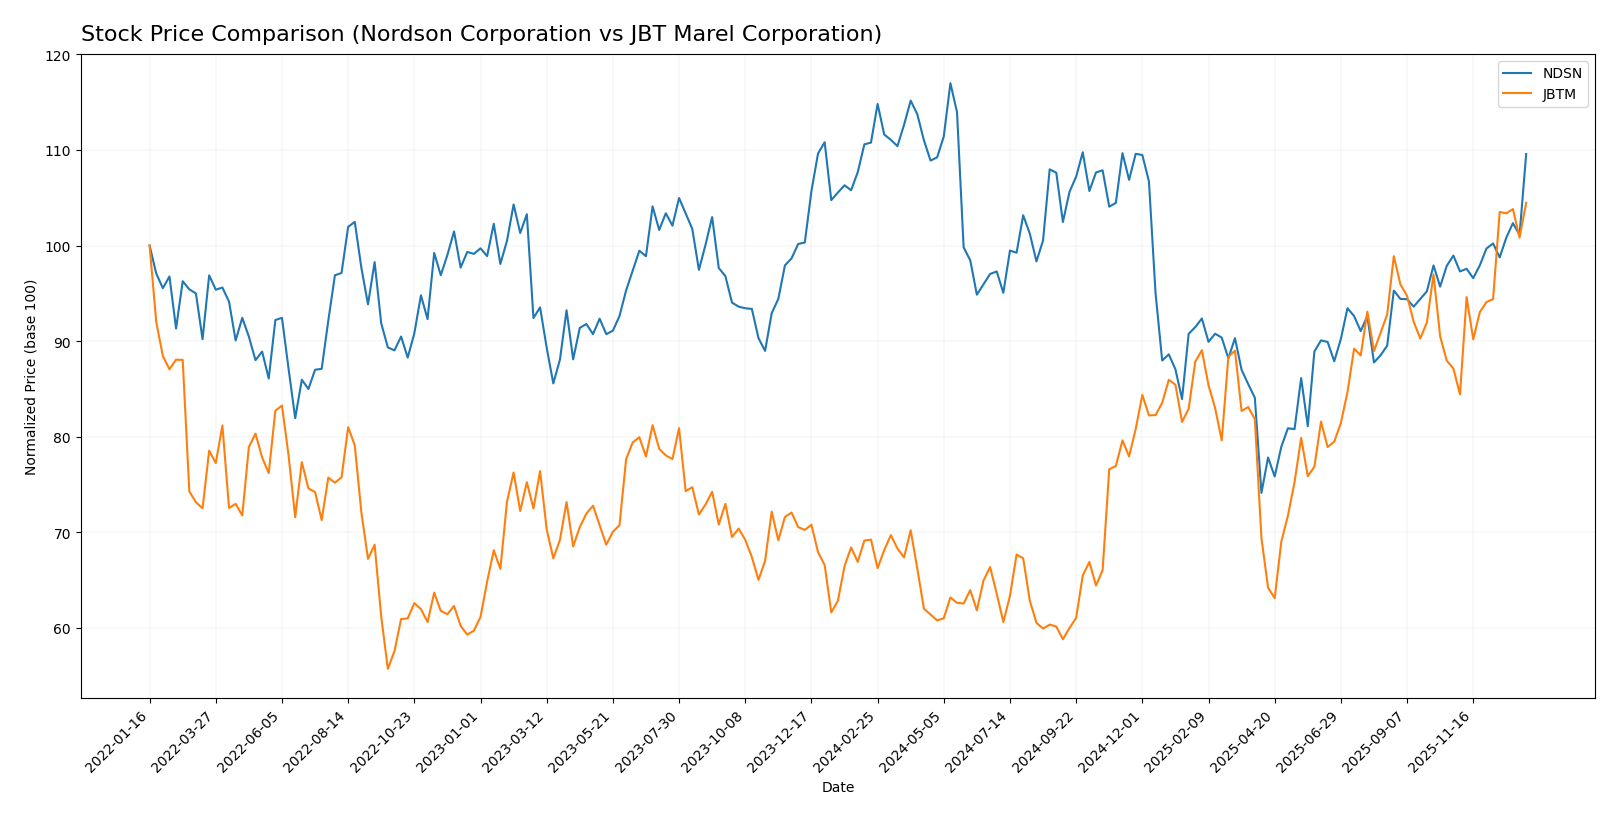
The stock price movements of Nordson Corporation and JBT Marel Corporation over the past year reveal contrasting dynamics, with JBTM showing strong gains and NDSN experiencing mild declines followed by a recent recovery.
Trend Analysis
Nordson Corporation’s stock price decreased by 1.08% over the past 12 months, indicating a neutral to slightly bearish trend with accelerating momentum and notable volatility reflected by a 23.45 std deviation. The stock hit a high of 278.89 and a low of 176.73.
JBT Marel Corporation’s stock price increased by 50.89% over the same period, showing a clear bullish trend with accelerating upward momentum and moderate volatility at a 19.24 std deviation. The stock ranged between 87.85 and 156.04 in price.
Comparing the two, JBT Marel Corporation delivered significantly higher market performance with a strong bullish trend, while Nordson Corporation’s stock showed a near-neutral to bearish trend with less pronounced gains.
Target Prices
The current analyst consensus indicates moderate upside potential for both Nordson Corporation and JBT Marel Corporation based on target price estimates.
| Company | Target High | Target Low | Consensus |
|---|---|---|---|
| Nordson Corporation | 295 | 240 | 274.17 |
| JBT Marel Corporation | 180 | 169 | 174.5 |
Analysts expect Nordson’s stock to rise from its current 261.22 USD toward a consensus target of 274.17 USD, suggesting modest growth potential. JBT Marel’s consensus target of 174.5 USD also indicates upside from its current 156.04 USD price, reflecting positive market sentiment.
Analyst Opinions Comparison
This section compares analysts’ ratings and grades for Nordson Corporation and JBT Marel Corporation:
Rating Comparison
NDSN Rating
- Rating: B, considered very favorable by analysts.
- Discounted Cash Flow Score: 3, indicating a moderate valuation based on future cash flows.
- ROE Score: 4, favorable, reflecting efficient profit generation from shareholders’ equity.
- ROA Score: 4, favorable, demonstrating effective asset utilization for earnings.
- Debt To Equity Score: 2, moderate, suggesting a balanced approach to financial risk.
- Overall Score: 3, moderate, summarizing the company’s financial standing.
JBTM Rating
- Rating: C, also considered very favorable.
- Discounted Cash Flow Score: 3, showing a similar moderate valuation.
- ROE Score: 1, very unfavorable, indicating poor efficiency in generating equity profits.
- ROA Score: 1, very unfavorable, showing weak asset use to generate earnings.
- Debt To Equity Score: 2, moderate, also indicating balanced financial risk.
- Overall Score: 2, moderate, reflecting a lower but still moderate financial standing.
Which one is the best rated?
Based strictly on the data, Nordson Corporation is better rated than JBT Marel Corporation, with higher ROE, ROA, and overall scores. Both have moderate discounted cash flow and debt-to-equity scores.
Scores Comparison
Here is a comparison of the Altman Z-Score and Piotroski Score for the two companies:
NDSN Scores
- Altman Z-Score: 4.9, classified in the safe zone.
- Piotroski Score: 7, indicating strong financial health.
JBTM Scores
- Altman Z-Score: 1.75, classified in the distress zone.
- Piotroski Score: 2, indicating very weak financial health.
Which company has the best scores?
Based on the provided data, NDSN has significantly better scores with a safe zone Altman Z-Score and a strong Piotroski Score. JBTM scores fall into the distress and very weak categories, indicating higher financial risk.
Grades Comparison
The following section presents the latest grades for Nordson Corporation and JBT Marel Corporation:
Nordson Corporation Grades
This table shows recent grades from reputable grading companies for Nordson Corporation.
| Grading Company | Action | New Grade | Date |
|---|---|---|---|
| DA Davidson | Maintain | Buy | 2025-12-12 |
| Baird | Maintain | Neutral | 2025-12-12 |
| DA Davidson | Maintain | Buy | 2025-12-11 |
| Keybanc | Maintain | Overweight | 2025-12-11 |
| Oppenheimer | Maintain | Outperform | 2025-08-25 |
| Baird | Maintain | Neutral | 2025-08-22 |
| Keybanc | Maintain | Overweight | 2025-07-15 |
| Baird | Maintain | Neutral | 2025-05-30 |
| Oppenheimer | Upgrade | Outperform | 2025-05-30 |
| Keybanc | Maintain | Overweight | 2025-04-08 |
Nordson Corporation’s grades show a stable positive outlook with multiple buy, overweight, and outperform ratings maintained or upgraded recently.
JBT Marel Corporation Grades
This table displays recent grades from recognized grading firms for JBT Marel Corporation.
| Grading Company | Action | New Grade | Date |
|---|---|---|---|
| Jefferies | Upgrade | Buy | 2025-12-10 |
| William Blair | Upgrade | Outperform | 2025-08-06 |
JBT Marel Corporation has received recent upgrades from hold and market perform to buy and outperform, indicating improved analyst sentiment.
Which company has the best grades?
Both companies hold a consensus “Buy” rating; however, Nordson Corporation benefits from a broader and more consistent set of buy and outperform grades. This wider analyst support may suggest more balanced market confidence, potentially influencing investor decisions towards greater stability and positive momentum.
Strengths and Weaknesses
Below is a comparison of key strengths and weaknesses for Nordson Corporation (NDSN) and JBT Marel Corporation (JBTM) based on their recent financial and operational data.
| Criterion | Nordson Corporation (NDSN) | JBT Marel Corporation (JBTM) |
|---|---|---|
| Diversification | Broad product mix including Advanced Technology Systems, Industrial Precision Solutions, and Medical & Fluid Solutions, providing revenue stability | Less diversified product portfolio, focused mainly on food processing equipment |
| Profitability | High net margin (17.35%) and ROE (15.92%), profitable with favorable ROIC (10.49%) | Lower profitability with net margin at 4.98%, ROE 5.53%, and ROIC 3.65%, all unfavorable |
| Innovation | Consistent investment in advanced technologies, reflected in steady revenue from Advanced Technology Systems | Innovation efforts less pronounced, reflected by weaker profitability and market response |
| Global presence | Strong global footprint with diversified industrial segments | Global presence exists but not as broad or diversified, limiting market penetration |
| Market Share | Solid market position in industrial and medical equipment with ongoing value creation | Market share pressure evident from value destruction and declining profitability |
Key takeaway: Nordson Corporation demonstrates stronger diversification, profitability, and innovation capacity, supporting a slightly favorable investment stance despite a declining ROIC trend. Conversely, JBT Marel shows weaker profitability and value destruction, suggesting higher investment risk.
Risk Analysis
Below is a comparative table highlighting key risks for Nordson Corporation (NDSN) and JBT Marel Corporation (JBTM) based on the latest financial and operational data from 2025 and 2024 respectively.
| Metric | Nordson Corporation (NDSN) | JBT Marel Corporation (JBTM) |
|---|---|---|
| Market Risk | Beta 1.025, moderate market sensitivity; P/E 27.1 (unfavorable) | Beta 1.002, stable market sensitivity; P/E 47.63 (unfavorable) |
| Debt level | Debt-to-Equity 0.69 (neutral); interest coverage 5.55 (favorable) | Debt-to-Equity 0.81 (neutral); interest coverage 5.92 (favorable) |
| Regulatory Risk | Moderate; industrial machinery sector with standard compliance requirements | Moderate; food processing technology with complex food safety regulations |
| Operational Risk | Asset turnover 0.47 (unfavorable); strong fixed asset turnover 4.7 | Asset turnover 0.5 (neutral); high fixed asset turnover 7.34 |
| Environmental Risk | Industry exposure to environmental regulations on coatings and chemicals | Exposure to sustainability demands in food technology and packaging |
| Geopolitical Risk | US-based with global sales; moderate exposure to trade policies | Global presence including volatile regions; higher geopolitical exposure |
Nordson shows a balanced risk profile with moderate market risk and solid debt coverage, supported by a strong Altman Z-score (4.9, safe zone) and good Piotroski score (7, strong). JBT Marel carries higher risk, reflected in a low Altman Z-score (1.75, distress zone) and weak Piotroski score (2), indicating financial distress and operational challenges. The most impactful risk for JBTM is its financial health, increasing bankruptcy risk, while Nordson’s market valuation and operational efficiency require monitoring. Investors should weigh these risks carefully with regard to their risk tolerance and portfolio diversification.
Which Stock to Choose?
Nordson Corporation (NDSN) shows a generally favorable income evolution with stable revenue growth and solid profitability metrics, including a 17.35% net margin. Its financial ratios reveal strengths in return on equity (15.92%) and asset management, while debt levels remain moderate. The company holds a very favorable overall rating of B.
JBT Marel Corporation (JBTM) presents an unfavorable income evolution marked by declining net income and margins, with a modest 4.98% net margin. Financial ratios indicate weaker profitability and returns, despite low debt levels and a very favorable rating of C, reflecting mixed financial health signals.
For investors, NDSN’s slightly favorable rating and stronger income and ratio performance might appeal to those favoring quality and stability, while JBTM’s profile with very unfavorable profitability but recent bullish price trends could be more aligned with risk-tolerant or growth-focused investors seeking potential turnaround opportunities.
Disclaimer: Investment carries a risk of loss of initial capital. The past performance is not a reliable indicator of future results. Be sure to understand risks before making an investment decision.
Go Further
I encourage you to read the complete analyses of Nordson Corporation and JBT Marel Corporation to enhance your investment decisions: