Nordson Corporation and ATS Corporation both operate in the industrial machinery sector, specializing in automation and precision manufacturing solutions. While Nordson focuses on advanced dispensing and coating systems, ATS delivers comprehensive automation services and digital factory solutions. Their shared market space and commitment to innovation make them natural competitors. In this article, I will analyze both companies to identify which presents the most compelling opportunity for your investment portfolio.
Table of contents
Companies Overview
I will begin the comparison between Nordson Corporation and ATS Corporation by providing an overview of these two companies and their main differences.
Nordson Corporation Overview
Nordson Corporation engineers, manufactures, and markets products and systems to dispense, apply, and control adhesives, coatings, polymers, sealants, biomaterials, and other fluids worldwide. Operating through Industrial Precision Solutions and Advanced Technology Solutions segments, Nordson serves industries including packaged goods, semiconductor, and paper converting. Founded in 1935 and headquartered in Westlake, Ohio, it employs 8,000 people and trades on NASDAQ with a market cap of $14.6B.
ATS Corporation Overview
ATS Corporation provides automation solutions globally, including designing, building, and servicing automated manufacturing and assembly systems. Offering pre- and post-automation services, contract manufacturing, and digital solutions, ATS serves sectors such as life sciences, transportation, electronics, and energy. Founded in 1978 and headquartered in Cambridge, Canada, ATS has 7,500 employees, trades on NYSE, and holds a market cap of $2.8B.
Key similarities and differences
Both Nordson and ATS operate in the industrial machinery sector with a focus on automation and precision systems, serving diverse manufacturing industries. Nordson emphasizes dispensing and coating technologies with a broader product range, while ATS specializes in automation system integration and digital factory solutions. Market capitalization and geographic headquarters differ significantly, with Nordson being larger and US-based, and ATS smaller with Canadian roots.
Income Statement Comparison
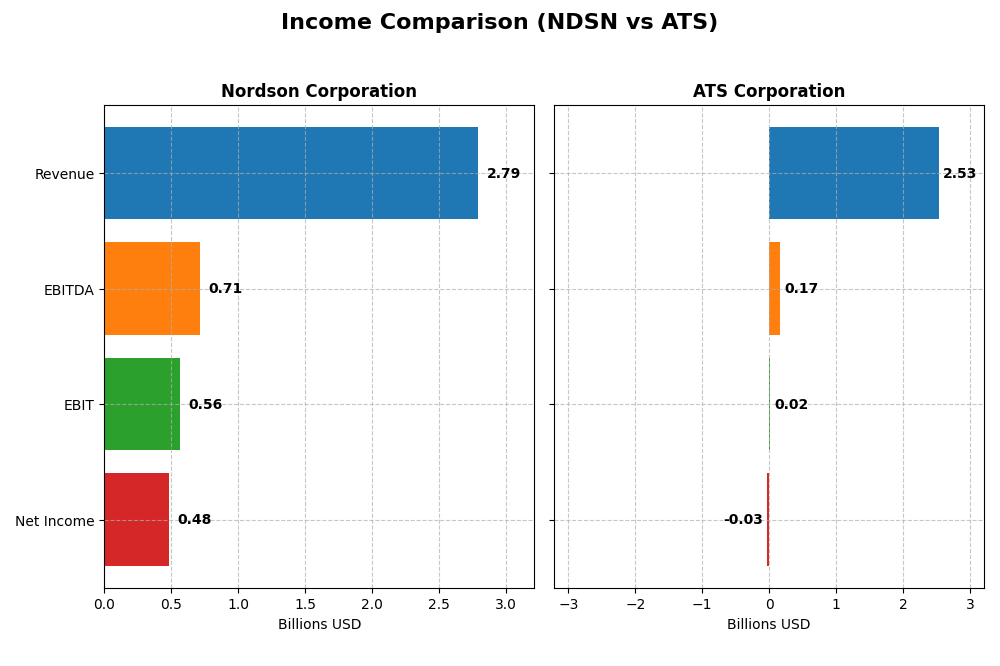
The table below presents key income statement metrics for Nordson Corporation and ATS Corporation for their most recent fiscal years, facilitating a straightforward financial comparison.
| Metric | Nordson Corporation (NDSN) | ATS Corporation (ATS) |
|---|---|---|
| Market Cap | 14.6B USD | 2.8B CAD |
| Revenue | 2.79B USD | 2.53B CAD |
| EBITDA | 712M USD | 168M CAD |
| EBIT | 561M USD | 15.3M CAD |
| Net Income | 484M USD | -28M CAD |
| EPS | 8.56 USD | -0.29 CAD |
| Fiscal Year | 2025 | 2025 |
Income Statement Interpretations
Nordson Corporation
From 2021 to 2025, Nordson Corporation showed steady revenue growth of 18.18%, with net income increasing by 6.63% over the period. Gross and EBIT margins remained favorable, though net margin declined slightly by 9.78%. In 2025, revenue growth slowed to 3.78%, EBIT fell by 16.79%, but EPS improved by 4.93%, indicating mixed recent performance.
ATS Corporation
ATS Corporation experienced a significant revenue increase of 77.15% from 2021 to 2025 but suffered a sharp decline in net income by 143.76%. Gross margin was favorable at 25.53%, while EBIT margin was neutral and net margin negative at -1.11%. The 2025 year saw a 16.47% revenue decline and steep falls in EBIT (-95.18%) and EPS (-114.72%), reflecting deteriorating profitability.
Which one has the stronger fundamentals?
Nordson Corporation displays stronger fundamentals with consistent revenue and net income growth, alongside healthy margins and a mostly favorable income statement evaluation. ATS Corporation’s higher revenue growth is offset by persistent net losses and deteriorating margins, resulting in an unfavorable income statement assessment. Overall, Nordson’s fundamentals appear more stable and resilient over the examined period.
Financial Ratios Comparison
The table below presents a side-by-side comparison of key financial ratios for Nordson Corporation (NDSN) and ATS Corporation (ATS) based on their most recent fiscal year data.
| Ratios | Nordson Corporation (NDSN) FY 2025 | ATS Corporation (ATS) FY 2025 |
|---|---|---|
| ROE | 15.9% | -1.6% |
| ROIC | 10.5% | 0.09% |
| P/E | 27.1 | -125.3 |
| P/B | 4.31 | 2.06 |
| Current Ratio | 1.64 | 1.69 |
| Quick Ratio | 1.05 | 1.41 |
| D/E (Debt-to-Equity) | 0.69 | 1.00 |
| Debt-to-Assets | 35.4% | 36.8% |
| Interest Coverage | 7.04 | 0.09 |
| Asset Turnover | 0.47 | 0.55 |
| Fixed Asset Turnover | 4.70 | 5.66 |
| Payout Ratio | 37.0% | 0% |
| Dividend Yield | 1.36% | 0% |
Interpretation of the Ratios
Nordson Corporation
Nordson shows a solid financial profile with favorable net margin (17.35%), ROE (15.92%), and ROIC (10.49%), indicating effective profitability and capital use. However, high PE (27.1) and PB (4.31) ratios suggest possible overvaluation risks. The company pays dividends with a moderate yield of 1.36%, reflecting a stable payout supported by cash flow, though investors should monitor valuation levels.
ATS Corporation
ATS exhibits weak profitability metrics, including negative net margin (-1.11%) and ROE (-1.64%), signaling operational challenges. Although the current and quick ratios are favorable, poor interest coverage (0.16) raises concerns about debt servicing. ATS does not pay dividends, likely due to losses and reinvestment priority, which aligns with their focus on operational turnaround and growth.
Which one has the best ratios?
Nordson’s ratios are predominantly favorable with strong profitability and liquidity, while ATS struggles with negative returns and coverage issues despite some liquidity strengths. The overall assessment favors Nordson’s financial health, as ATS presents higher risks with its current earnings and debt situation.
Strategic Positioning
This section compares the strategic positioning of Nordson Corporation and ATS Corporation, focusing on market position, key segments, and exposure to technological disruption:
Nordson Corporation
- Strong market presence in industrial machinery with NASDAQ listing and 14.6B market cap.
- Diversified segments: Industrial Precision, Advanced Technology, and Medical & Fluid Solutions.
- Exposure to technological disruption through advanced dispensing and inspection systems.
ATS Corporation
- Smaller market cap of 2.8B on NYSE, facing higher beta and competitive pressure.
- Focuses on automation solutions across multiple industries including life sciences and energy.
- Provides connected factory floor management and digital solutions enhancing automation.
Nordson Corporation vs ATS Corporation Positioning
Nordson displays a diversified business model across precision solutions and medical segments, benefiting from broad industrial exposure. ATS concentrates on automation and digital factory management, serving varied markets but with less segment diversification and lower scale.
Which has the best competitive advantage?
Nordson’s moat is slightly favorable with value creation despite declining ROIC, indicating some sustainable advantage. ATS shows a very unfavorable moat with value destruction and steeply declining profitability, reflecting weaker competitive positioning.
Stock Comparison
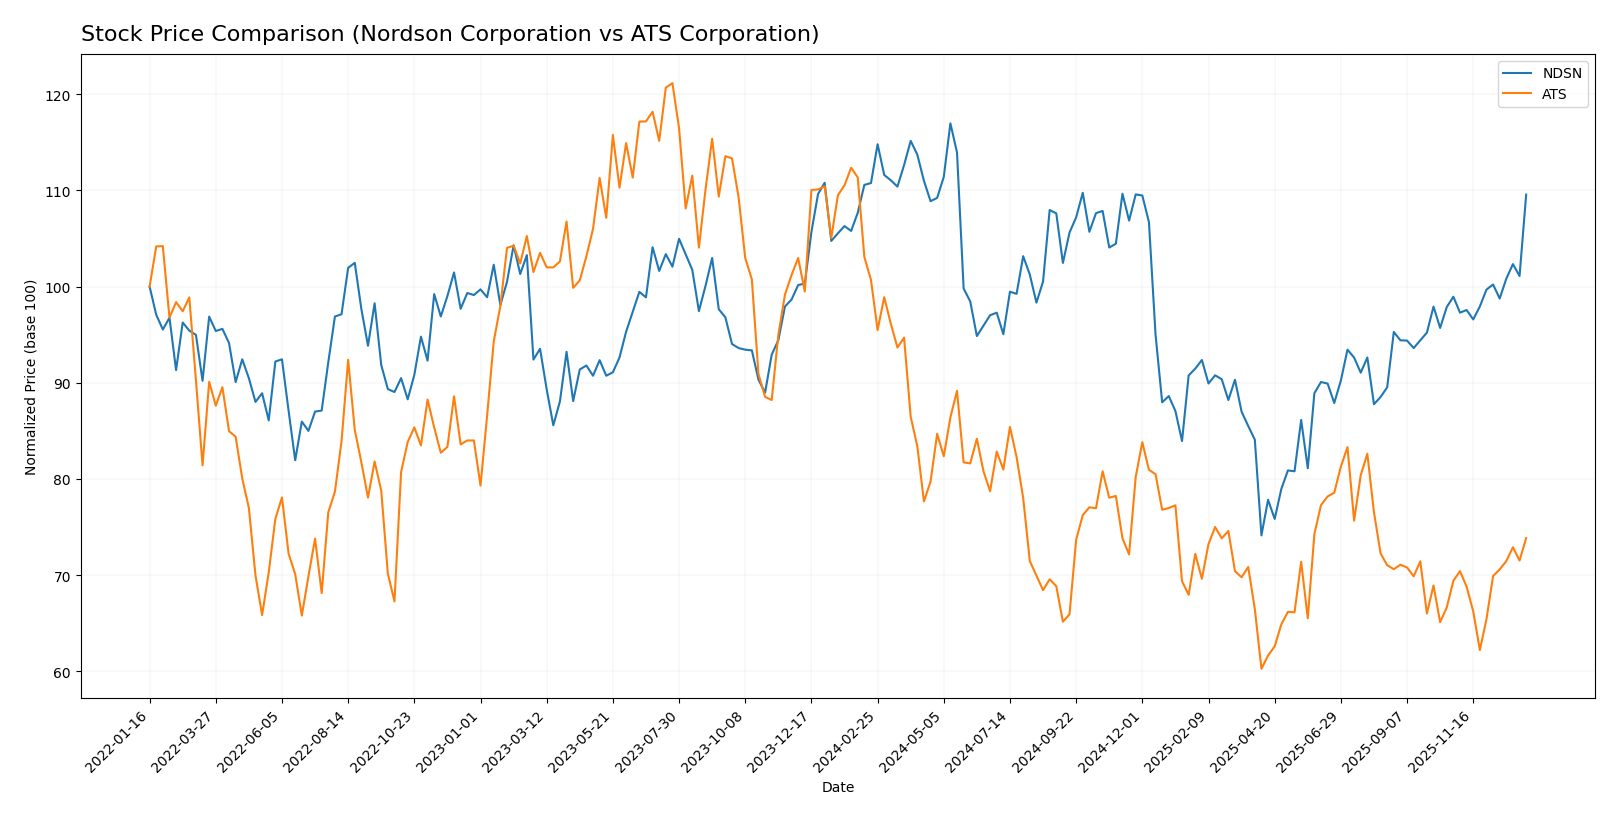
The stock price movements of Nordson Corporation (NDSN) and ATS Corporation (ATS) over the past 12 months reveal contrasting bearish trends with recent acceleration phases and notable price fluctuations.
Trend Analysis
Nordson Corporation’s stock showed a bearish trend over the past year with a -1.08% price change, marked by acceleration and a high volatility of 23.45. The stock reached a peak of 278.89 and a low of 176.73, with a recent strong rebound of +10.73%.
ATS Corporation exhibited a pronounced bearish trend with a -26.66% price change and accelerating decline. Volatility remained low at 3.24, with the stock trading between 39.27 and 23.5. Its recent upward movement of +6.39% shows early signs of recovery.
Comparing the two, Nordson’s stock delivered a less severe negative performance and a stronger recent rebound, indicating higher market resilience and better short-term recovery than ATS.
Target Prices
The current analyst consensus for target prices reflects moderate upside potential for these industrial machinery companies.
| Company | Target High | Target Low | Consensus |
|---|---|---|---|
| Nordson Corporation | 295 | 240 | 274.17 |
| ATS Corporation | 34 | 34 | 34 |
Analysts expect Nordson Corporation’s stock to rise modestly from its current price of $261.22, while ATS Corporation’s target price of $34 suggests upside from the current $28.80, indicating overall positive outlooks.
Analyst Opinions Comparison
This section compares analysts’ ratings and grades for Nordson Corporation and ATS Corporation:
Rating Comparison
Nordson Corporation Rating
- Rating: B, indicating a very favorable overall evaluation.
- Discounted Cash Flow Score: 3, showing moderate valuation.
- ROE Score: 4, favorable efficiency in generating equity returns.
- ROA Score: 4, favorable asset utilization effectiveness.
- Debt To Equity Score: 2, moderate financial risk level.
- Overall Score: 3, moderate financial standing.
ATS Corporation Rating
- Rating: C, reflecting a very favorable overall evaluation.
- Discounted Cash Flow Score: 3, also a moderate valuation.
- ROE Score: 1, very unfavorable equity return efficiency.
- ROA Score: 1, very unfavorable asset utilization.
- Debt To Equity Score: 1, very unfavorable financial risk.
- Overall Score: 2, moderate but lower than Nordson’s score.
Which one is the best rated?
Based strictly on provided data, Nordson Corporation holds superior ratings with higher ROE, ROA, and debt-to-equity scores, resulting in a better overall score and a more favorable rating compared to ATS Corporation.
Scores Comparison
The company scores comparison between Nordson Corporation and ATS Corporation is as follows:
Nordson Corporation Scores
- Altman Z-Score: 4.9, indicating a safe zone with low bankruptcy risk.
- Piotroski Score: 7, categorized as strong financial health.
ATS Corporation Scores
- Altman Z-Score: 1.68, indicating distress zone with high bankruptcy risk.
- Piotroski Score: 3, categorized as very weak financial health.
Which company has the best scores?
Nordson Corporation shows stronger financial stability with a safe zone Altman Z-Score and a strong Piotroski Score. ATS Corporation scores indicate financial distress and very weak health, based on the provided data.
Grades Comparison
Here is a comparison of the recent grades from reputable grading companies for Nordson Corporation and ATS Corporation:
Nordson Corporation Grades
This table shows Nordson Corporation’s latest grades by verified grading firms.
| Grading Company | Action | New Grade | Date |
|---|---|---|---|
| DA Davidson | Maintain | Buy | 2025-12-12 |
| Baird | Maintain | Neutral | 2025-12-12 |
| DA Davidson | Maintain | Buy | 2025-12-11 |
| Keybanc | Maintain | Overweight | 2025-12-11 |
| Oppenheimer | Maintain | Outperform | 2025-08-25 |
| Baird | Maintain | Neutral | 2025-08-22 |
| Keybanc | Maintain | Overweight | 2025-07-15 |
| Baird | Maintain | Neutral | 2025-05-30 |
| Oppenheimer | Upgrade | Outperform | 2025-05-30 |
| Keybanc | Maintain | Overweight | 2025-04-08 |
Nordson’s grades mostly indicate a positive outlook with consistent “Buy,” “Overweight,” and “Outperform” ratings and no downgrades.
ATS Corporation Grades
Here are the recent grades for ATS Corporation from well-known grading companies.
| Grading Company | Action | New Grade | Date |
|---|---|---|---|
| JP Morgan | Maintain | Neutral | 2024-08-13 |
| Goldman Sachs | Maintain | Sell | 2024-08-13 |
| JP Morgan | Maintain | Neutral | 2024-05-24 |
ATS’s grades show a more cautious sentiment, with “Neutral” and “Sell” ratings and no upgrades or positive actions.
Which company has the best grades?
Nordson Corporation holds a stronger grading profile with multiple “Buy,” “Overweight,” and “Outperform” ratings from respected firms, suggesting a favorable market view. ATS Corporation’s more conservative “Neutral” and “Sell” assessments may imply higher uncertainty. This difference could influence investors’ confidence and risk appetite when considering these stocks.
Strengths and Weaknesses
Below is a comparative overview of key strengths and weaknesses for Nordson Corporation (NDSN) and ATS Corporation (ATS) based on the most recent financial and operational data.
| Criterion | Nordson Corporation (NDSN) | ATS Corporation (ATS) |
|---|---|---|
| Diversification | Well diversified across Advanced Technology, Industrial Precision, and Medical & Fluid Solutions segments with revenues above $2.7B in 2024. | Limited data on product diversification; appears less diversified. |
| Profitability | Strong profitability with 17.35% net margin, 15.92% ROE, and 10.49% ROIC in 2025; creating value but ROIC is declining. | Negative profitability: -1.11% net margin, -1.64% ROE, and near zero ROIC; destroying value with sharply declining profitability. |
| Innovation | Solid innovation reflected by favorable fixed asset turnover (4.7) and investment in advanced systems. | Moderate innovation with favorable fixed asset turnover (5.66) but poor profitability limits impact. |
| Global presence | Established global footprint reflected in product segmentation and strong market penetration. | Data insufficient, but financials suggest weaker global positioning. |
| Market Share | Stable market share in industrial and medical segments supported by consistent revenue growth. | Market share appears weak or shrinking given poor financial performance and value destruction. |
Key takeaways: Nordson shows solid diversification and profitability, though profitability trends warrant caution. ATS faces significant challenges with declining returns and negative margins, indicating higher investment risk for now. Risk management favors Nordson for investors seeking relative stability.
Risk Analysis
Below is a comparative table of key risks for Nordson Corporation (NDSN) and ATS Corporation (ATS) based on the most recent 2025 financial and operational data:
| Metric | Nordson Corporation (NDSN) | ATS Corporation (ATS) |
|---|---|---|
| Market Risk | Beta 1.025, moderate market sensitivity | Beta 1.268, higher market volatility exposure |
| Debt level | Debt/Equity 0.69, moderate leverage | Debt/Equity 1.0, high leverage concerns |
| Regulatory Risk | US industrial regulations, stable compliance environment | Canadian and US industrial regulations, with some complexity due to cross-border operations |
| Operational Risk | Well diversified segments, stable operations | Recent operational challenges reflected in negative profitability |
| Environmental Risk | Moderate, industrial machinery sector compliance | Moderate, with growing pressure in automation solutions |
| Geopolitical Risk | Primarily US exposure, lower geopolitical risk | Exposure to US & Canada markets, moderate geopolitical risk |
Nordson shows a stronger financial position and operational stability, with moderate market risk and manageable debt. ATS faces higher financial distress risks, indicated by its distressed Altman Z-Score (1.68) and weak profitability, making debt servicing and operational execution more vulnerable. Investors should weigh ATS’s elevated financial and operational risks against potential recovery prospects.
Which Stock to Choose?
Nordson Corporation (NDSN) shows stable income growth with a favorable global income statement evaluation. Its profitability ratios, including a 15.9% ROE and 10.5% ROIC, are positive, supported by moderate debt levels and a very favorable overall rating of B.
ATS Corporation (ATS) exhibits a challenging income evolution marked by unfavorable profitability and income statement metrics, including a negative net margin and ROE. It carries higher debt with weak interest coverage and holds a very unfavorable rating of C.
Investors seeking quality and consistent value creation might find NDSN more aligned with stability and profitability, while those with a tolerance for risk and a focus on potential turnaround or growth could see ATS as a speculative option. The ratings and financial profiles suggest differing risk-return profiles depending on investment objectives.
Disclaimer: Investment carries a risk of loss of initial capital. The past performance is not a reliable indicator of future results. Be sure to understand risks before making an investment decision.
Go Further
I encourage you to read the complete analyses of Nordson Corporation and ATS Corporation to enhance your investment decisions: