Home > Comparison > Technology > NOK vs ZBRA
The strategic rivalry between Nokia Oyj and Zebra Technologies Corporation shapes the evolving landscape of communication equipment. Nokia operates as a global network infrastructure titan, blending hardware and cloud services, while Zebra excels as a focused enterprise asset intelligence provider with specialized tracking solutions. This clash highlights a contrast between broad-scale connectivity and niche technological integration. This analysis aims to identify which company delivers superior risk-adjusted returns for a diversified portfolio in the technology sector.
Table of contents
Companies Overview
Nokia and Zebra Technologies stand as pivotal players in communication equipment with distinct market footprints and business models.
Nokia Oyj: Global Network Solutions Leader
Nokia dominates the communication equipment sector by providing mobile, fixed, and cloud network infrastructure worldwide. Its core revenue comes from radio access networks, optical transport, and cloud services spanning 2G to 5G technologies. In 2026, Nokia strategically focuses on expanding its cloud and virtualization services to support digital industries and hyperscalers.
Zebra Technologies Corporation: Enterprise Asset Intelligence Specialist
Zebra Technologies excels in the automatic identification and data capture industry, generating revenue through printers, barcode scanners, RFID readers, and rugged mobile computers. Its 2026 strategy emphasizes integrated software solutions and robotics automation to enhance real-time asset tracking and workforce management across multiple industries.
Strategic Collision: Similarities & Divergences
Nokia pursues a broad network infrastructure approach, while Zebra targets enterprise asset intelligence with specialized hardware and software. Both compete over connectivity and data capture but in divergent arenas—Nokia in large-scale network systems, Zebra in localized enterprise visibility. Their distinct investment profiles reflect Nokia’s scale and diversification versus Zebra’s niche innovation and higher beta risk.
Income Statement Comparison
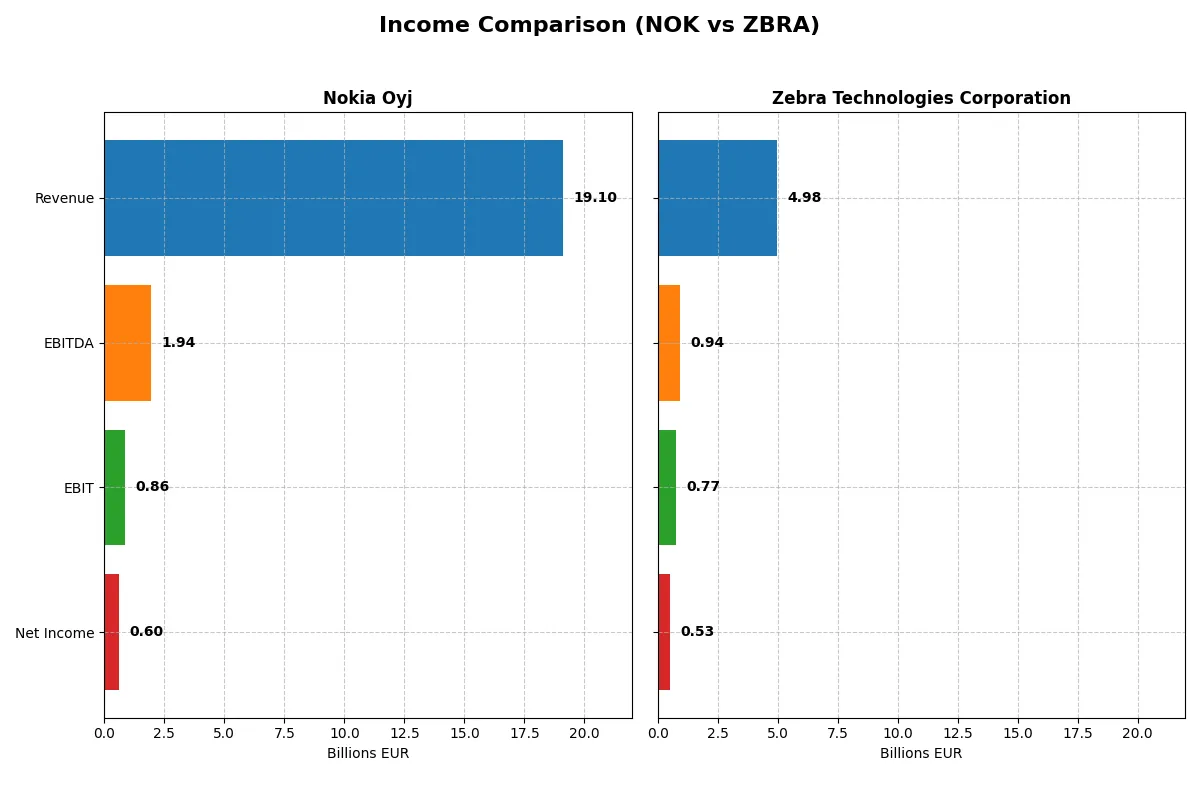
This data dissects the core profitability and scalability of both corporate engines to reveal who dominates the bottom line:
| Metric | Nokia Oyj (NOK) | Zebra Technologies Corporation (ZBRA) |
|---|---|---|
| Revenue | 19.1B EUR | 4.98B USD |
| Cost of Revenue | 11.1B EUR | 2.57B USD |
| Operating Expenses | 6.46B EUR | 1.67B USD |
| Gross Profit | 8.04B EUR | 2.41B USD |
| EBITDA | 1.94B EUR | 937M USD |
| EBIT | 862M EUR | 765M USD |
| Interest Expense | 0 EUR | 129M USD |
| Net Income | 604M EUR | 528M USD |
| EPS | 0.11 EUR | 10.25 USD |
| Fiscal Year | 2025 | 2024 |
Income Statement Analysis: The Bottom-Line Duel
This income statement comparison reveals which company runs its operations with superior efficiency and profitability.
Nokia Oyj Analysis
Nokia’s revenue declined from 24.9B EUR in 2022 to 19.1B EUR in 2025, showing a -13.95% drop over five years. Net income plunged nearly 63%, hitting 604M EUR in 2025. Its gross margin remains decent at 42%, but net margin eroded to 3.16%, reflecting weakening profitability and efficiency challenges in the latest fiscal year.
Zebra Technologies Corporation Analysis
Zebra’s revenue grew steadily to 4.98B USD in 2024, rising 11.98% over five years. Net income also improved, reaching 528M USD, with net margin at a strong 10.6%. Gross margin expanded to 48.44%, and EBIT margin climbed to 15.36%, signaling robust margin management and accelerating profitability momentum in the latest year.
Margin Strength vs. Revenue Contraction
Zebra clearly outperforms Nokia on margin health and growth trajectory. Nokia’s revenue and net income have contracted sharply, dragging margins down, while Zebra expands both top-line and bottom-line with solid margin improvement. For investors, Zebra’s profile offers more attractive operational efficiency and growth potential.
Financial Ratios Comparison
These vital ratios act as a diagnostic tool to expose the underlying fiscal health, valuation premiums, and capital efficiency of the companies analyzed:
| Ratios | Nokia Oyj (NOK) | Zebra Technologies (ZBRA) |
|---|---|---|
| ROE | 2.9% | 14.7% |
| ROIC | 3.8% | 9.7% |
| P/E | 49.4 | 37.7 |
| P/B | 1.42 | 5.55 |
| Current Ratio | 1.58 | 1.43 |
| Quick Ratio | 1.36 | 1.03 |
| D/E (Debt-to-Equity) | 0.25 | 0.66 |
| Debt-to-Assets | 13.9% | 29.6% |
| Interest Coverage | 0 | 5.75 |
| Asset Turnover | 0.51 | 0.63 |
| Fixed Asset Turnover | 7.68 | 10.55 |
| Payout ratio | 120% | 0% |
| Dividend yield | 2.43% | 0% |
| Fiscal Year | 2025 | 2024 |
Efficiency & Valuation Duel: The Vital Signs
Ratios form the company’s DNA, exposing hidden risks and operational strengths that numbers alone cannot reveal.
Nokia Oyj
Nokia shows weak profitability with a low ROE of 2.88% and a modest net margin of 3.16%. Its valuation is stretched, marked by a high P/E of 49.36 despite a reasonable P/B of 1.42. The firm supports shareholders with a 2.43% dividend yield, signaling steady income amid reinvestment in R&D.
Zebra Technologies Corporation
Zebra delivers stronger profitability with a net margin of 10.6% and a solid ROE of 14.72%. The stock remains expensive, trading at a 37.67 P/E and a high 5.55 P/B ratio. It offers no dividend, instead channeling cash flow into growth and innovation, reflecting a focus on long-term value creation.
Valuation Stretch vs. Operational Efficiency
Nokia presents a safer balance with favorable liquidity and dividend returns but struggles in profitability. Zebra boasts superior margins and returns but carries a premium valuation and no yield. Investors prioritizing income may lean Nokia, while growth seekers may favor Zebra’s operational edge despite higher risk.
Which one offers the Superior Shareholder Reward?
I compare Nokia Oyj and Zebra Technologies by their payout approaches. Nokia pays a 2.4% dividend yield with a 120% payout ratio in 2025, signaling aggressive, possibly unsustainable dividends. Zebra pays no dividends, instead reinvesting heavily in growth, supported by 94% free cash flow buyback coverage. Nokia’s buybacks are less emphasized, raising sustainability concerns. Zebra’s high operating margins (15%) and consistent free cash flow underpin a robust buyback strategy, favoring long-term value creation. I judge Zebra Technologies offers a superior total return profile for 2026 investors due to growth reinvestment and sustainable capital allocation.
Comparative Score Analysis: The Strategic Profile
The radar chart reveals the fundamental DNA and trade-offs of Nokia Oyj and Zebra Technologies Corporation, highlighting their core financial strengths and weaknesses:
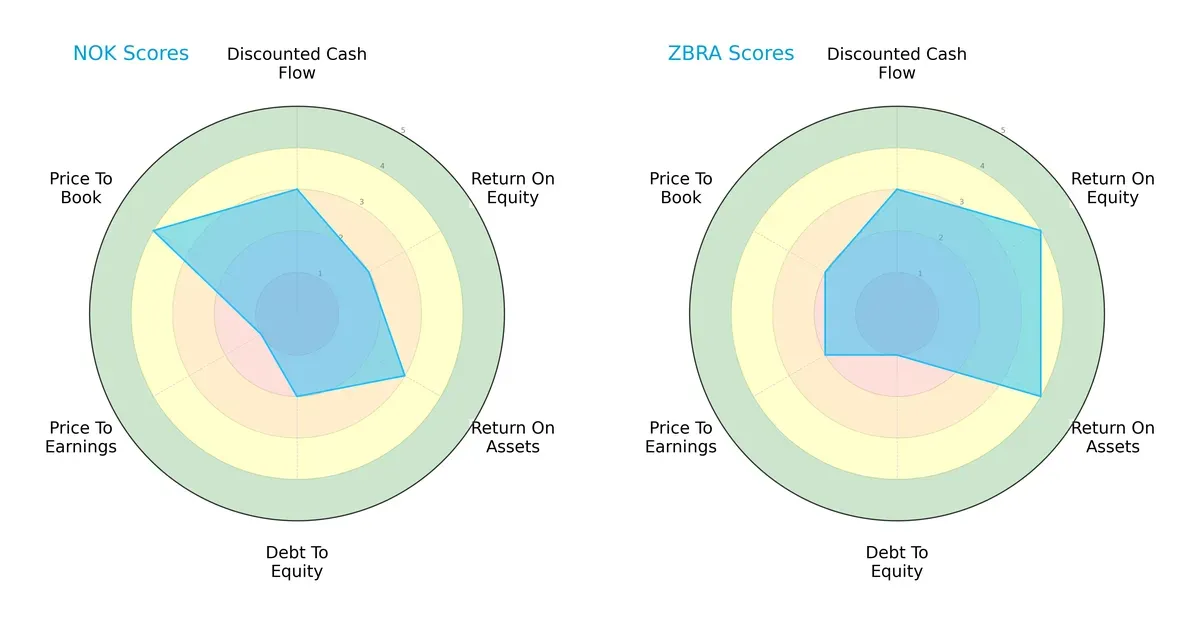
Zebra excels with high ROE (4) and ROA (4) scores, signaling superior profitability and asset efficiency. Nokia shows a more favorable price-to-book ratio (4 vs. 2) but lags in earnings valuation (P/E score 1 vs. 2). Zebra’s debt-to-equity score (1) suggests higher leverage risk compared to Nokia’s moderate 2. Overall, Nokia offers a balanced risk profile, while Zebra leans on operational efficiency for its edge.
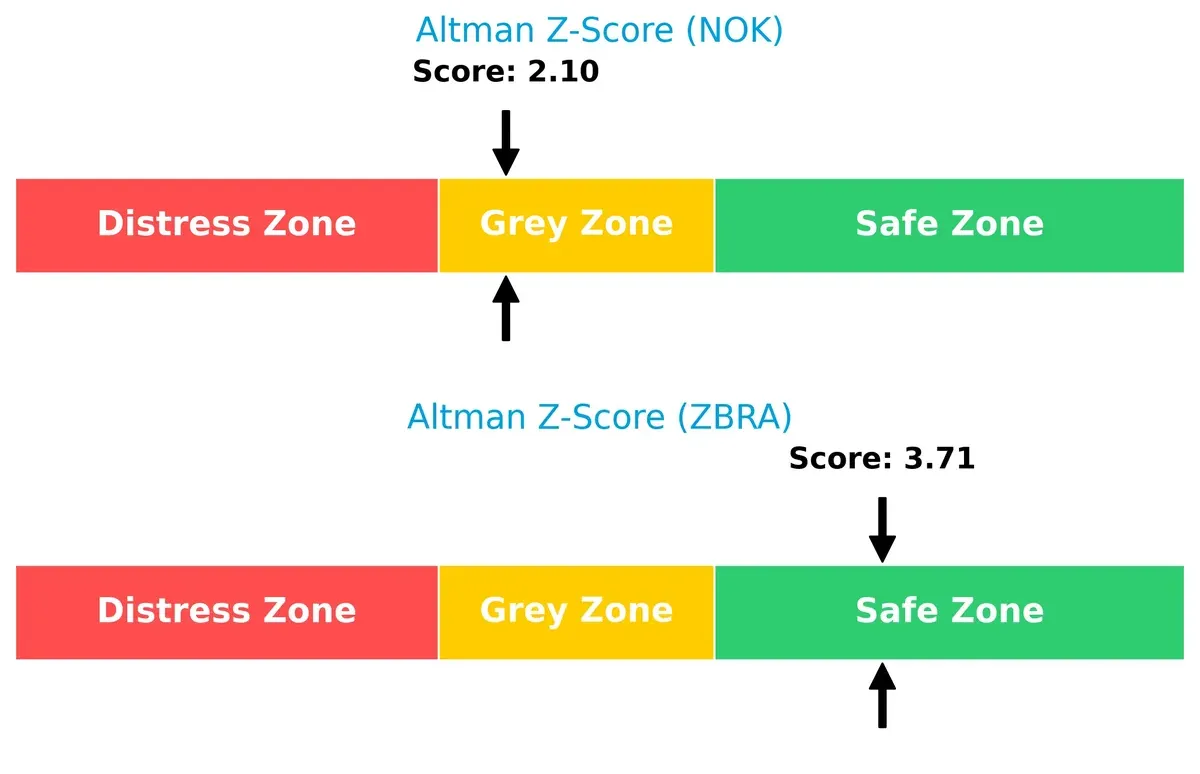
Bankruptcy Risk: Solvency Showdown
Zebra’s Altman Z-Score of 3.71 places it firmly in the safe zone, indicating robust long-term survival potential. Nokia’s 2.10 score situates it in the grey zone, implying moderate risk in this economic cycle:
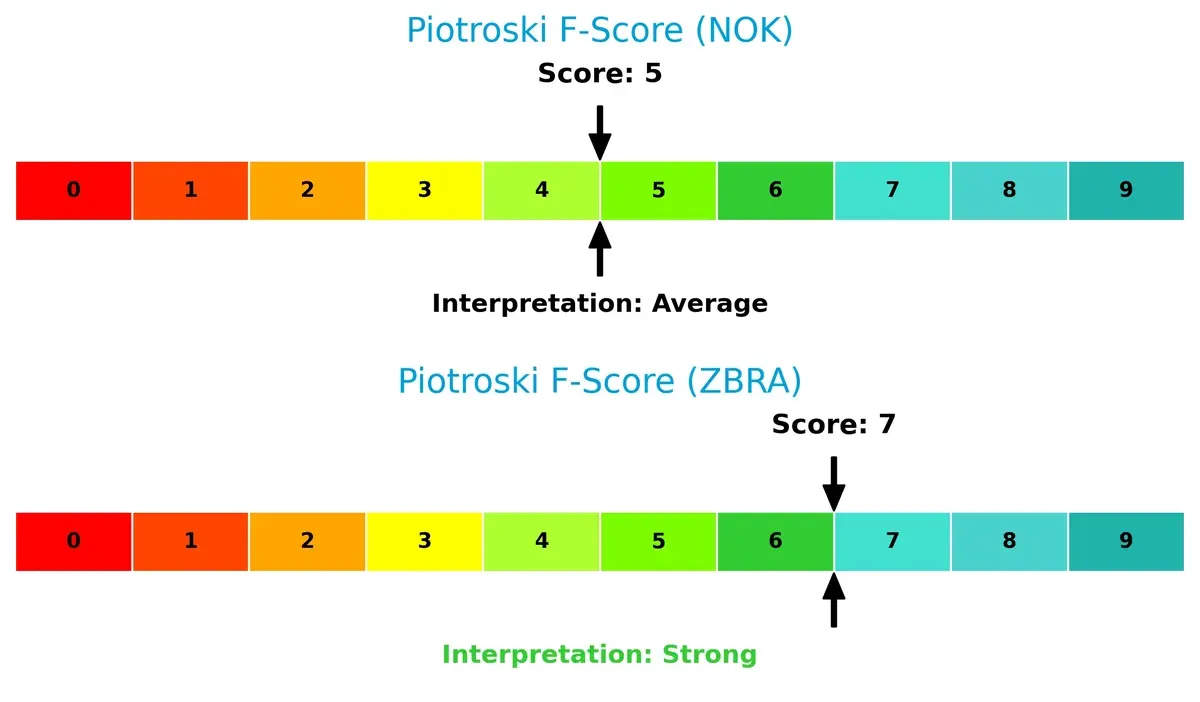
Financial Health: Quality of Operations
Zebra’s Piotroski F-Score of 7 reflects strong financial health and operational quality. Nokia’s score of 5 is average, signaling potential red flags in internal metrics and weaker fundamentals compared to Zebra:
How are the two companies positioned?
This section dissects Nokia’s and Zebra’s operational DNA by comparing revenue distribution and internal strengths and weaknesses. The goal is to confront their economic moats and reveal which business model offers the most resilient competitive advantage today.
Revenue Segmentation: The Strategic Mix
This visual comparison dissects how Nokia Oyj and Zebra Technologies diversify their income streams, revealing their primary sector bets and strategic priorities:
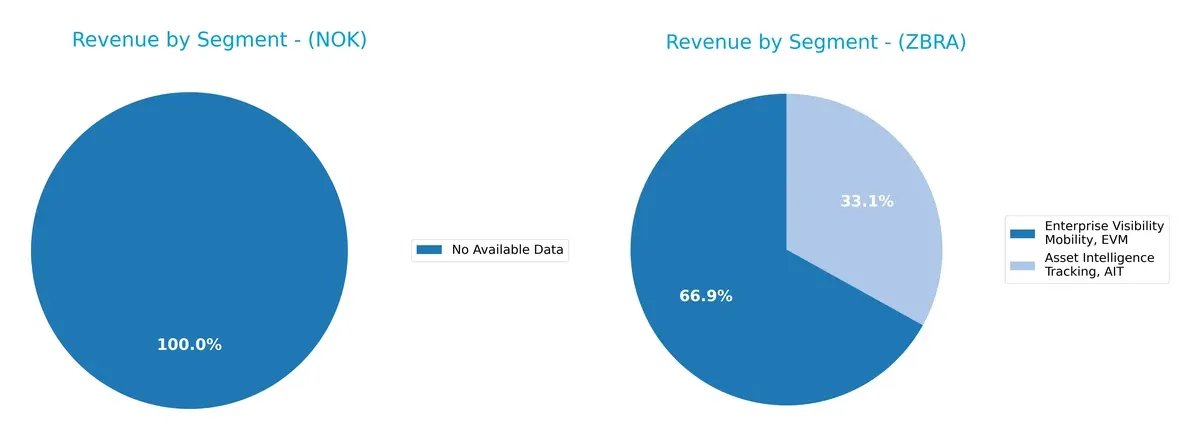
I did not find enough data to evaluate the segmentation of Nokia Oyj. Zebra Technologies, however, anchors revenue in “Enterprise Visibility Mobility, EVM” with $3.33B in 2024, dwarfing “Asset Intelligence Tracking, AIT” at $1.65B. This concentration highlights Zebra’s stronghold in enterprise infrastructure, with a moderate secondary segment providing diversification and mitigating some concentration risk.
Strengths and Weaknesses Comparison
This table compares the strengths and weaknesses of Nokia and Zebra based on diversification, profitability, financials, innovation, global presence, and market share:
Nokia Strengths
- Strong global presence with significant revenue across multiple regions
- Favorable liquidity ratios indicate solid short-term financial health
- Low debt-to-assets ratio supports financial stability
- Dividend yield of 2.43% appeals to income investors
- Fixed asset turnover favorable, showing efficient asset use
Zebra Strengths
- Higher net margin reflects better profitability
- Favorable quick ratio and interest coverage indicate healthy financials
- Strong fixed asset turnover demonstrates efficient capital use
- Diverse product segments contribute to revenue stability
- Presence across Asia Pacific, EMEA, Latin America, and North America
Nokia Weaknesses
- Low profitability metrics: net margin, ROE, and ROIC all unfavorable
- High P/E ratio suggests expensive valuation relative to earnings
- Market valuation may not reflect operational performance
- Asset turnover only neutral, indicating moderate efficiency
Zebra Weaknesses
- WACC unfavorable, implying higher capital costs
- High P/B ratio signals potential overvaluation
- No dividend yield may deter income-focused investors
- Moderate leverage with debt-to-equity neutral
- ROE and ROIC neutral, showing average returns
Nokia’s strengths lie in its diversified global footprint and balanced financial structure. However, weak profitability and high valuation multiples could constrain growth. Zebra demonstrates stronger profitability and operational efficiency but faces challenges with capital costs and valuation metrics. Each company’s profile suggests different strategic priorities in managing financial health and market expectations.
The Moat Duel: Analyzing Competitive Defensibility
A structural moat is the only true shield protecting long-term profits from relentless competitive erosion. Let’s dissect how these two firms defend their turf:
Nokia Oyj: Intangible Assets and Network Expertise
Nokia’s moat hinges on its vast patent portfolio and deep telecom network expertise. This yields stable margins despite recent revenue declines. However, profitability has slipped sharply through 2025, threatening its competitive edge in 5G expansion.
Zebra Technologies Corporation: Cost Advantage and Enterprise Integration
Zebra leverages cost-efficient manufacturing and integrated asset intelligence solutions. Its superior margins and double-digit revenue growth highlight a more robust moat. Expansion into cloud-based services could strengthen its market grip by 2026.
Verdict: Intangible Assets vs. Cost Leadership
Both firms struggle with declining ROICs below WACC, signaling value erosion. Yet, Zebra’s consistent revenue and margin expansion indicate a wider moat. I see Zebra better positioned to defend and grow market share amid intensifying competition.
Which stock offers better returns?
Nokia Oyj’s stock surged 81.3% over the past year, showing clear acceleration, while Zebra Technologies Corporation declined 18.44% with decelerating losses.
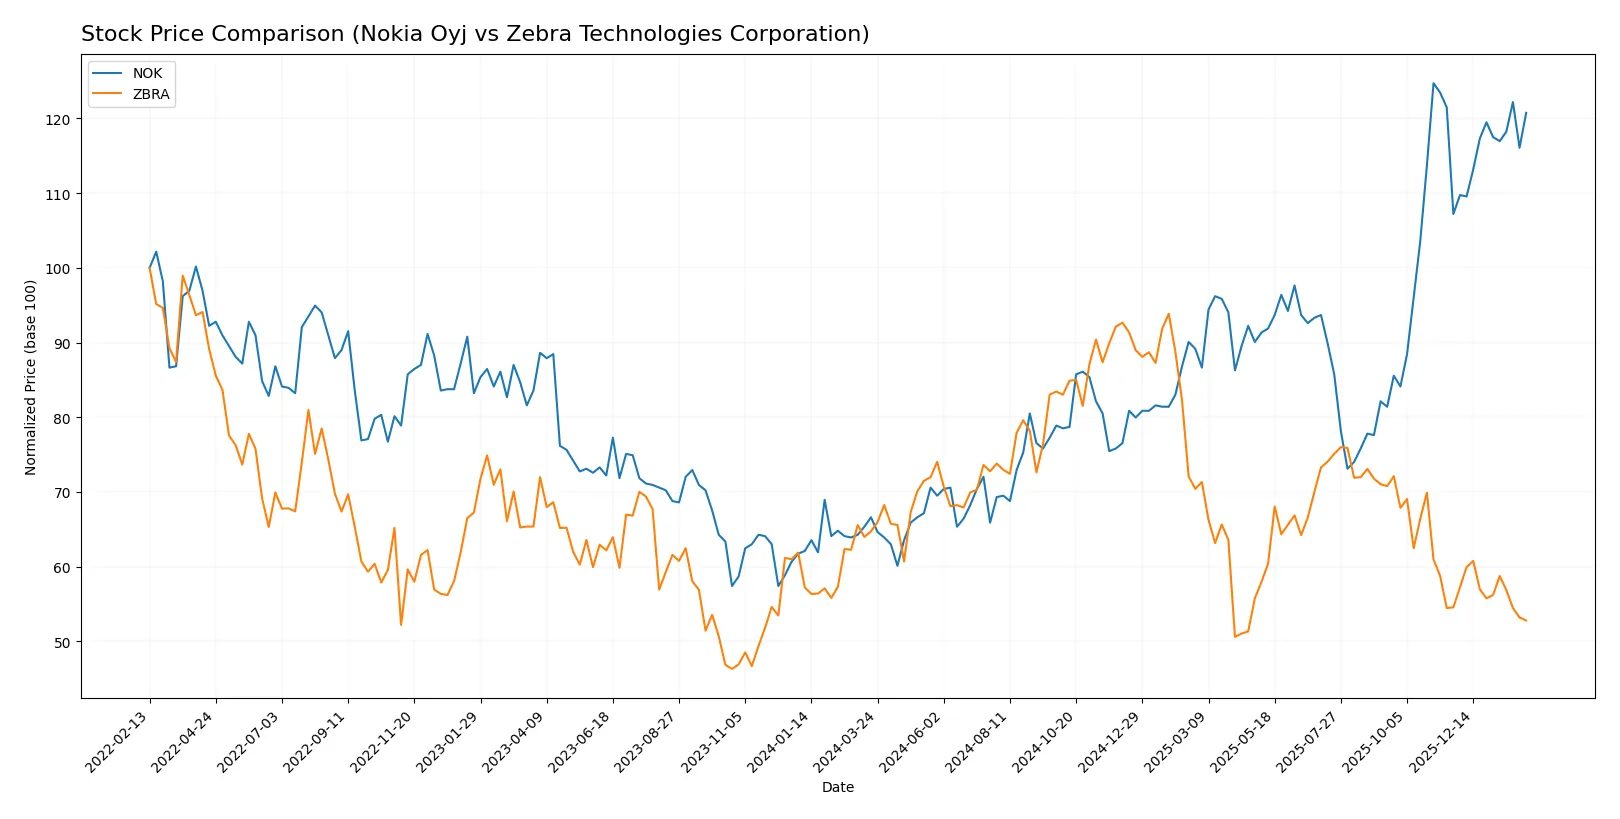
Trend Comparison
Nokia Oyj’s stock rose 81.3% over 12 months, marking a bullish trend with accelerating gains and low volatility (0.91 std deviation). It hit a high of 6.91 and a low of 3.33.
Zebra Technologies Corporation’s stock fell 18.44% over 12 months, showing a bearish trend with decelerating losses and very high volatility (48.44 std deviation). Its price ranged from 223.49 to 414.61.
Nokia delivered the highest market performance, outperforming Zebra by a wide margin with strong upward momentum and steadier trading.
Target Prices
Analysts present a mixed but constructive target consensus for Nokia Oyj and Zebra Technologies Corporation.
| Company | Target Low | Target High | Consensus |
|---|---|---|---|
| Nokia Oyj | 5.0 | 8.5 | 6.69 |
| Zebra Technologies Corporation | 291 | 368 | 329.5 |
Nokia’s consensus target matches its current price, signaling fair valuation. Zebra’s consensus target of 329.5 suggests significant upside from its current 233.16, indicating strong analyst optimism.

Don’t Let Luck Decide Your Entry Point
Optimize your entry points with our advanced ProRealTime indicators. You’ll get efficient buy signals with precise price targets for maximum performance. Start outperforming now!
How do institutions grade them?
Nokia Oyj Grades
The following table summarizes recent grades from reputable firms for Nokia Oyj:
| Grading Company | Action | New Grade | Date |
|---|---|---|---|
| JP Morgan | Maintain | Overweight | 2025-12-01 |
| Jefferies | Upgrade | Buy | 2025-10-28 |
| JP Morgan | Maintain | Overweight | 2025-10-24 |
| JP Morgan | Maintain | Overweight | 2025-07-29 |
| JP Morgan | Maintain | Overweight | 2025-02-21 |
| Craig-Hallum | Maintain | Buy | 2025-01-06 |
| JP Morgan | Upgrade | Overweight | 2024-12-09 |
| JP Morgan | Maintain | Neutral | 2024-10-21 |
| Northland Capital Markets | Maintain | Outperform | 2024-10-18 |
| Northland Capital Markets | Maintain | Outperform | 2024-09-04 |
Zebra Technologies Corporation Grades
Here are the recent institutional grades for Zebra Technologies Corporation:
| Grading Company | Action | New Grade | Date |
|---|---|---|---|
| Barclays | Maintain | Overweight | 2026-01-12 |
| Truist Securities | Maintain | Hold | 2025-12-18 |
| Barclays | Maintain | Overweight | 2025-10-29 |
| Truist Securities | Maintain | Hold | 2025-10-29 |
| Citigroup | Maintain | Neutral | 2025-10-29 |
| Citigroup | Maintain | Neutral | 2025-10-09 |
| Truist Securities | Maintain | Hold | 2025-10-08 |
| Needham | Maintain | Buy | 2025-08-06 |
| Truist Securities | Maintain | Hold | 2025-08-06 |
| Morgan Stanley | Maintain | Equal Weight | 2025-08-06 |
Which company has the best grades?
Nokia Oyj has received consistently higher grades, with multiple “Overweight” and “Outperform” ratings, compared to Zebra’s mix of “Hold,” “Neutral,” and fewer “Buy” ratings. This divergence could influence investor sentiment and perceived growth potential.
Risks specific to each company
The following categories identify the critical pressure points and systemic threats facing both firms in the 2026 market environment:
1. Market & Competition
Nokia Oyj
- Faces intense competition in telecom infrastructure, struggling with low net margins and high P/E ratio.
Zebra Technologies Corporation
- Operates in niche enterprise asset intelligence; higher margins but faces valuation pressure with high P/B ratio.
2. Capital Structure & Debt
Nokia Oyj
- Maintains low debt (D/E 0.25), strong interest coverage, signaling financial stability.
Zebra Technologies Corporation
- Higher leverage (D/E 0.66), moderate interest coverage, increasing financial risk.
3. Stock Volatility
Nokia Oyj
- Low beta at 0.555 suggests defensive stock with lower volatility.
Zebra Technologies Corporation
- High beta of 1.656 signals greater stock price swings and market sensitivity.
4. Regulatory & Legal
Nokia Oyj
- Subject to stringent telecom regulations worldwide, potential compliance costs.
Zebra Technologies Corporation
- Faces regulatory scrutiny in technology and supply chain sectors but less exposure than telecom.
5. Supply Chain & Operations
Nokia Oyj
- Complex global supply chain for network equipment may face disruptions.
Zebra Technologies Corporation
- Relies on component sourcing for manufacturing printers and scanners, exposed to supply delays.
6. ESG & Climate Transition
Nokia Oyj
- Increasing pressure to innovate sustainable network solutions and reduce carbon footprint.
Zebra Technologies Corporation
- Needs to enhance ESG credentials amid growing demand for responsible sourcing and energy efficiency.
7. Geopolitical Exposure
Nokia Oyj
- High exposure to European and global telecom markets, vulnerable to geopolitical tensions.
Zebra Technologies Corporation
- Primarily US-based but global customer base exposes it to trade uncertainties.
Which company shows a better risk-adjusted profile?
Nokia’s most impactful risk is its weak profitability despite a stable capital structure and low volatility. Zebra’s greatest risk lies in its elevated leverage and stock volatility, despite stronger profitability. Overall, Nokia offers a better risk-adjusted profile, supported by its lower beta and more conservative debt levels. However, Nokia’s modest Altman Z-Score in the grey zone signals caution. Zebra’s strong Piotroski score and safe Altman Z-Score reflect financial strength but come with higher risk from leverage and market swings.
Final Verdict: Which stock to choose?
Nokia Oyj’s superpower lies in its robust balance sheet and operational stability. It maintains a healthy liquidity position and low leverage, supporting resilience in turbulent markets. However, its declining profitability and value destruction require vigilance. Nokia suits defensive or income-focused portfolios prioritizing stability over rapid growth.
Zebra Technologies commands a strategic moat through its specialized technology and recurring revenue streams. Its superior profitability and strong cash conversion cycle offer better growth visibility and operational efficiency. Relative to Nokia, Zebra carries higher financial risk but fits well in GARP (Growth at a Reasonable Price) portfolios seeking innovation with moderate risk tolerance.
If you prioritize capital preservation and steady income, Nokia offers a compelling choice due to its financial stability and favorable balance sheet metrics. However, if you seek growth backed by technological differentiation and can tolerate higher risk, Zebra outshines with stronger profitability and operational momentum. Both present distinct risk-return profiles aligned with different investor strategies.
Disclaimer: Investment carries a risk of loss of initial capital. The past performance is not a reliable indicator of future results. Be sure to understand risks before making an investment decision.
Go Further
I encourage you to read the complete analyses of Nokia Oyj and Zebra Technologies Corporation to enhance your investment decisions: