Home > Comparison > Utilities > NEE vs XEL
The strategic rivalry between NextEra Energy, Inc. and Xcel Energy Inc. defines the current trajectory of the regulated electric utility sector. NextEra operates as a capital-intensive clean energy pioneer with extensive renewable assets. Xcel blends regulated electric and natural gas utilities with diversified fuel sources. This analysis pits NextEra’s growth-driven green transition against Xcel’s stable, multi-commodity model to identify the superior risk-adjusted choice for a diversified portfolio.
Table of contents
Companies Overview
NextEra Energy and Xcel Energy dominate the regulated electric utility sector with distinct regional footprints and energy strategies.
NextEra Energy, Inc.: Clean Energy Powerhouse
NextEra Energy stands as a leader in regulated electric utilities, generating and selling power primarily through wind, solar, nuclear, coal, and natural gas. Its core revenue engine relies on long-term contracted clean energy assets and a vast transmission network. In 2021, the company emphasized expanding renewable generation and battery storage, serving about 11M people across Florida’s east and lower west coasts.
Xcel Energy Inc.: Diversified Utility Operator
Xcel Energy operates as a regulated electric and natural gas utility, generating electricity from diverse sources including coal, nuclear, natural gas, hydro, and biomass. Its revenue stream also includes natural gas sales and pipeline leasing. In 2021, Xcel focused on integrating renewable energy while supporting natural gas infrastructure, serving 3.7M electric and 2.1M gas customers across eight U.S. states.
Strategic Collision: Similarities & Divergences
Both companies prioritize regulated utility operations and renewable energy integration but diverge in scope and asset mix. NextEra’s clean energy leadership contrasts with Xcel’s balanced mix of electric and gas utilities. Their battleground centers on capturing market share in renewables and grid modernization. Investors face a trade-off: NextEra offers growth via green innovation, while Xcel presents stability through diversified utility services.
Income Statement Comparison
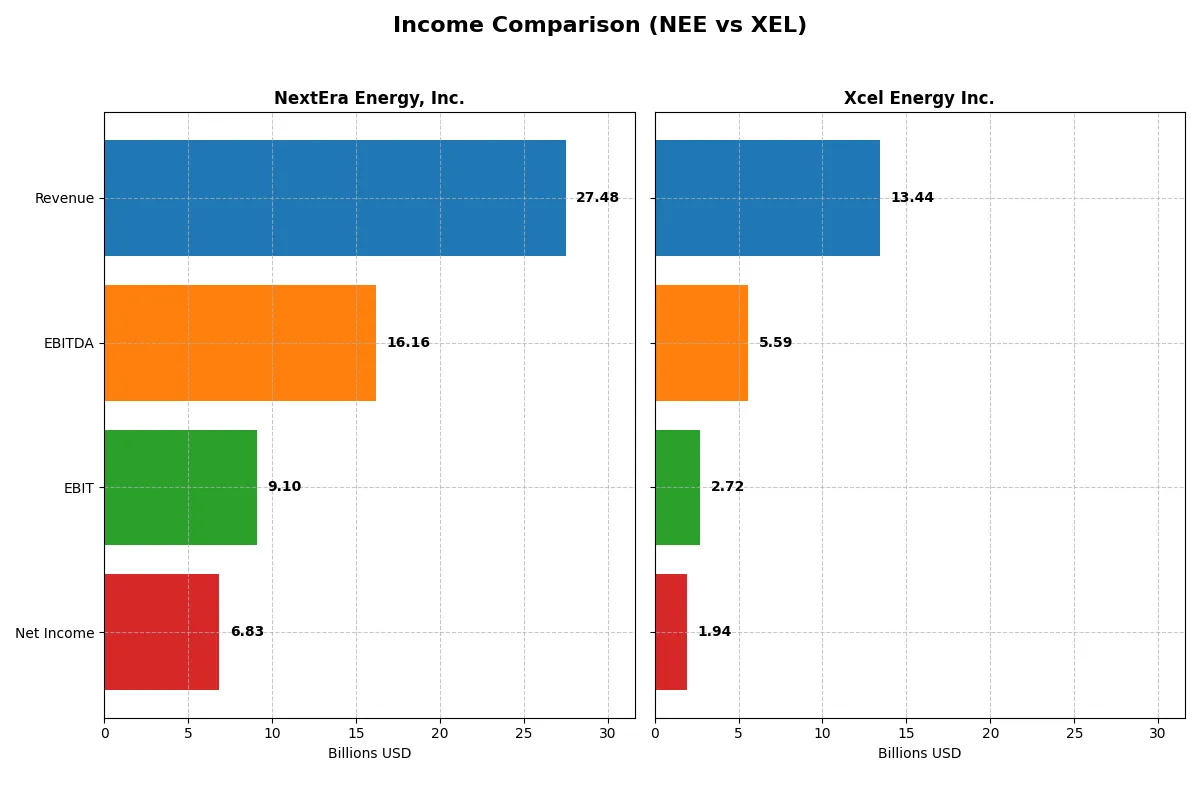
This data dissects the core profitability and scalability of both corporate engines to reveal who dominates the bottom line:
| Metric | NextEra Energy, Inc. (NEE) | Xcel Energy Inc. (XEL) |
|---|---|---|
| Revenue | 27.48B | 13.44B |
| Cost of Revenue | 10.22B | 7.29B |
| Operating Expenses | 8.98B | 3.76B |
| Gross Profit | 17.26B | 6.15B |
| EBITDA | 16.17B | 5.59B |
| EBIT | 9.10B | 2.72B |
| Interest Expense | 4.57B | 1.18B |
| Net Income | 6.83B | 1.94B |
| EPS | 3.31 | 3.44 |
| Fiscal Year | 2025 | 2024 |
Income Statement Analysis: The Bottom-Line Duel
This income statement comparison uncovers the true efficiency and profitability of each company’s operational engine over recent years.
NextEra Energy, Inc. Analysis
NextEra Energy shows strong revenue growth from $17.1B in 2021 to $27.5B in 2025. Its gross margin remains robust at 62.8%, reflecting efficient cost control. Despite rising interest expenses, net income climbed from $3.57B in 2021 to $6.83B in 2025, though net margin dipped slightly last year indicating pressure on profitability momentum.
Xcel Energy Inc. Analysis
Xcel Energy’s revenue grew moderately from $11.5B in 2020 to peak at $15.3B in 2022 but slipped to $13.4B in 2024. Its gross margin of 45.7% is healthy but notably lower than NextEra’s. Net income rose steadily to $1.94B in 2024 with improving net margin and EPS, signaling steady operational leverage despite a recent revenue decline.
Margin Dominance vs. Steady Growth
NextEra commands higher margins and greater scale, translating into superior net income and stronger long-term growth. Xcel offers stability with consistent net margin expansion despite revenue volatility. For investors, NextEra’s profile suits those seeking robust margin power, while Xcel appeals to those favoring steady, resilient earnings growth.
Financial Ratios Comparison
These vital ratios act as a diagnostic tool to expose the underlying fiscal health, valuation premiums, and capital efficiency of the companies compared below:
| Ratios | NextEra Energy, Inc. (NEE) | Xcel Energy Inc. (XEL) |
|---|---|---|
| ROE | 12.5% | 9.9% |
| ROIC | 4.2% | 3.6% |
| P/E | 24.5 | 19.6 |
| P/B | 3.07 | 1.95 |
| Current Ratio | 0.60 | 0.67 |
| Quick Ratio | 0.49 | 0.57 |
| D/E (Debt-to-Equity) | 1.75 | 1.55 |
| Debt-to-Assets | 44.9% | 43.1% |
| Interest Coverage | 1.81 | 2.02 |
| Asset Turnover | 0.13 | 0.19 |
| Fixed Asset Turnover | 0.18 | 0.23 |
| Payout Ratio | 68.5% | 60.7% |
| Dividend Yield | 2.79% | 3.09% |
| Fiscal Year | 2025 | 2024 |
Efficiency & Valuation Duel: The Vital Signs
Financial ratios act as the company’s DNA, exposing hidden risks and operational strengths vital for investor decision-making.
NextEra Energy, Inc.
NextEra posts a solid 12.5% ROE with a strong net margin of 24.87%, signaling decent profitability. Its P/E at 24.54 suggests a fairly valued stock, though a high P/B at 3.07 flags possible overvaluation. The 2.79% dividend yield rewards shareholders despite weak liquidity and leverage metrics.
Xcel Energy Inc.
Xcel delivers a lower 9.9% ROE and a 14.4% net margin, reflecting modest profitability. The P/E of 19.64 and P/B of 1.95 indicate a more reasonably priced stock. A 3.09% dividend yield slightly surpasses peers, yet the company faces challenges in liquidity and asset efficiency ratios.
Balanced Risk Meets Valuation Discipline
NextEra offers stronger profitability but carries stretched balance sheet signals and higher valuation multiples. Xcel presents a more conservative valuation and stable dividend, albeit with lower returns. Investors seeking growth might lean toward NextEra; those prioritizing valuation discipline may prefer Xcel.
Which one offers the Superior Shareholder Reward?
NextEra Energy (NEE) and Xcel Energy (XEL) both reward shareholders through dividends and buybacks, but their approaches diverge. NEE yields around 2.8% with a high payout ratio (~68%) and inconsistent free cash flow, reflecting aggressive reinvestment and buybacks. XEL offers a slightly higher yield (~3.1%) with a moderate payout ratio (~61%) but negative free cash flow, signaling heavier capex pressure. NEE’s buyback intensity appears more sustainable given its robust operating margins and reinvestment in growth. I conclude NEE delivers a superior total return profile in 2026 due to balanced cash returns and growth reinvestment, unlike XEL’s stretched free cash flow and higher debt leverage.
Comparative Score Analysis: The Strategic Profile
The radar chart reveals the fundamental DNA and trade-offs of NextEra Energy, Inc. and Xcel Energy Inc., highlighting their financial strengths and valuation contrasts:
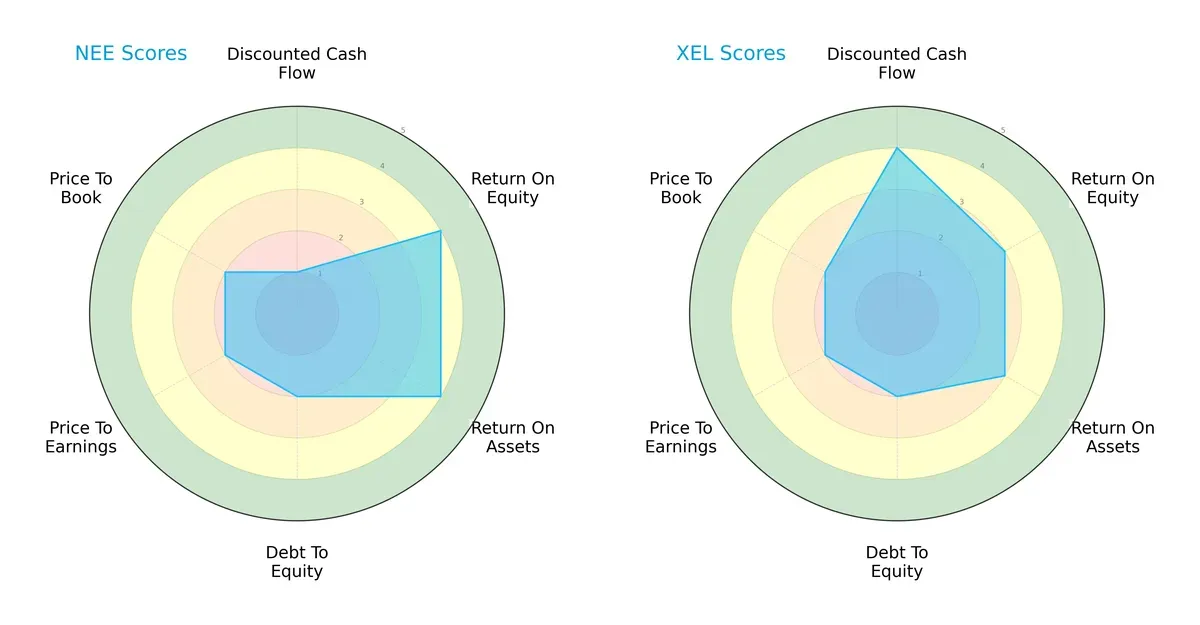
NextEra shows superior operational efficiency with higher ROE and ROA scores (4 vs. 3 each), reflecting stronger profit generation and asset utilization. Xcel outperforms on discounted cash flow (4 vs. 1), signaling better valuation based on future cash flows. Both share moderate debt-to-equity and valuation scores, but NextEra’s profile is less balanced, relying heavily on operational strength. Xcel delivers a more well-rounded financial stance.
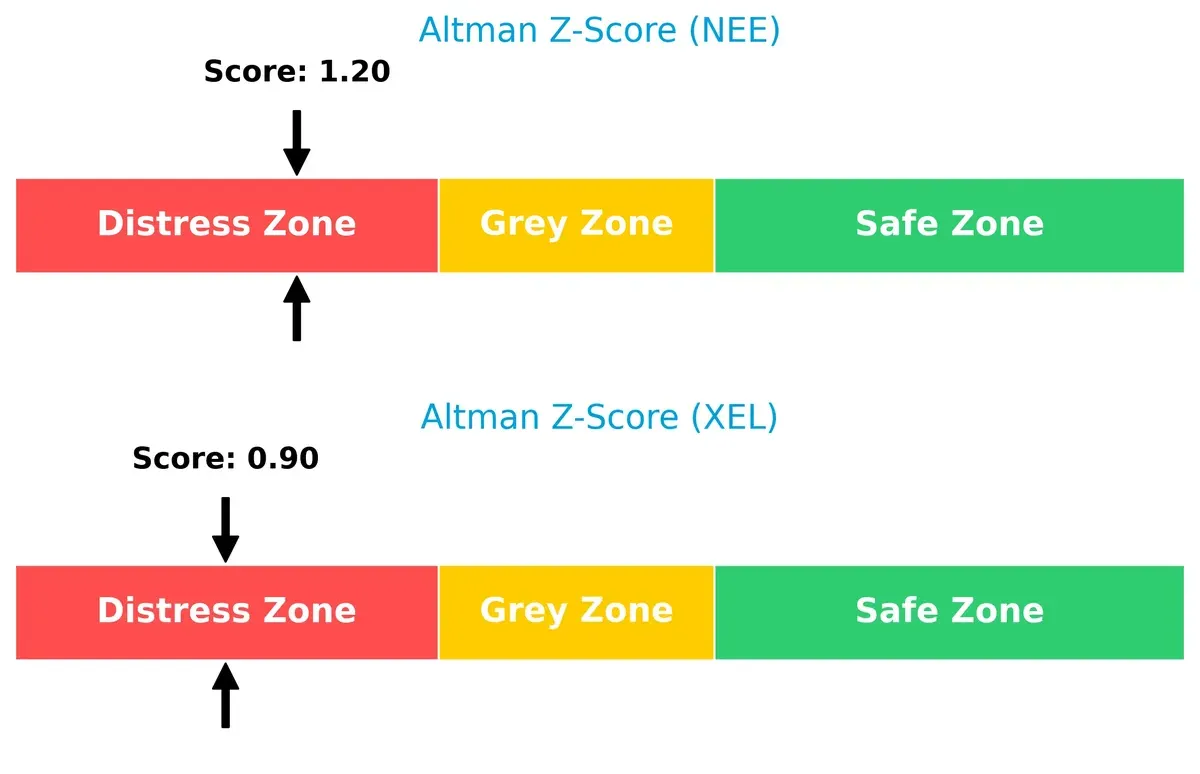
Bankruptcy Risk: Solvency Showdown
NextEra’s Altman Z-Score of 1.20 slightly exceeds Xcel’s 0.90, both indicating distress zone risk but with NextEra showing marginally better long-term survival odds in this cycle:
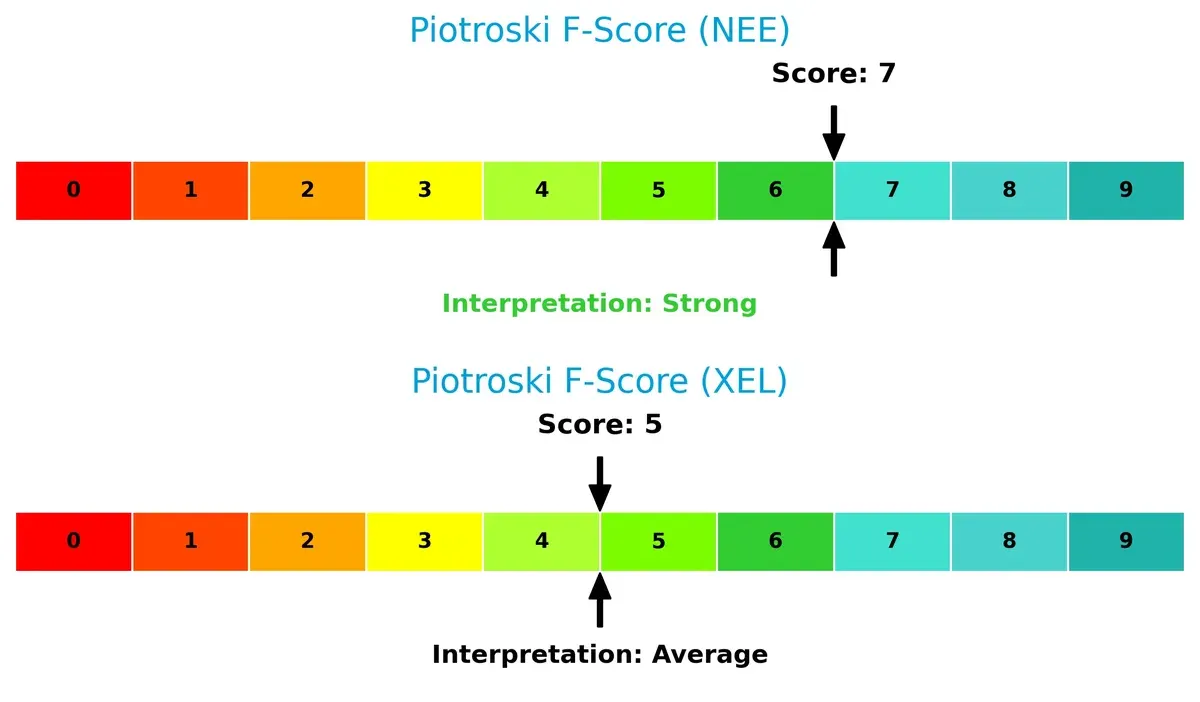
Financial Health: Quality of Operations
NextEra’s Piotroski F-Score of 7 suggests strong financial health, outperforming Xcel’s average score of 5. This indicates NextEra maintains more robust internal metrics and operational quality, while Xcel presents modest red flags:
How are the two companies positioned?
This section dissects the operational DNA of NextEra Energy and Xcel Energy by comparing their revenue distribution and internal dynamics. The goal is to confront their economic moats to reveal which business model delivers the most resilient and sustainable competitive advantage today.
Revenue Segmentation: The Strategic Mix
This visual comparison dissects how NextEra Energy, Inc. and Xcel Energy Inc. diversify their income streams and where their primary sector bets lie:
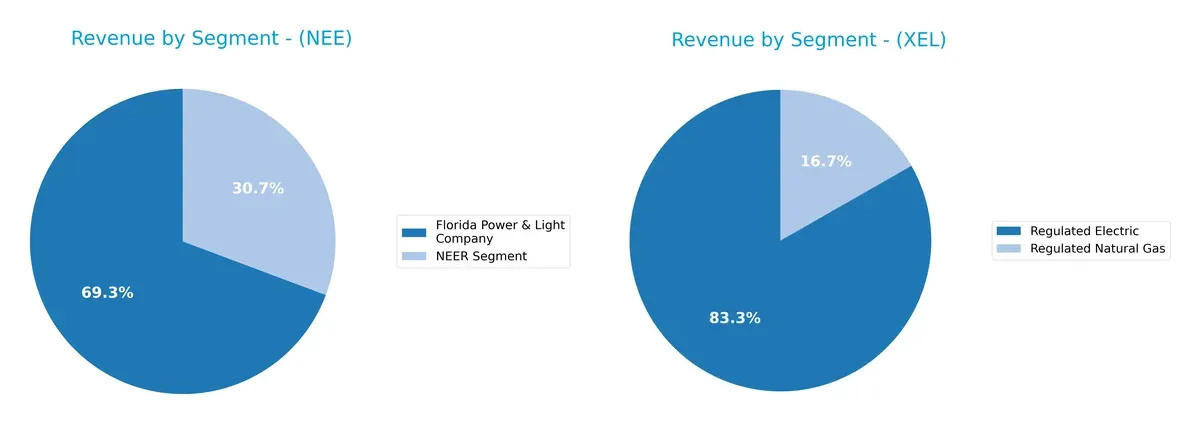
NextEra Energy anchors its revenues in Florida Power & Light Company with $17B, while its NEER segment adds $7.5B, showing a moderate two-pronged focus. Xcel Energy pivots more evenly, with $22.3B from Regulated Electric and $4.5B from Regulated Natural Gas. NextEra’s reliance on a dominant utility segment suggests infrastructure strength, while Xcel’s diversified regulated mix reduces concentration risk and enhances stability.
Strengths and Weaknesses Comparison
This table compares the strengths and weaknesses of NextEra Energy (NEE) and Xcel Energy (XEL):
NEE Strengths
- Higher net margin at 24.87%
- Favorable WACC at 6.52%
- Strong dividend yield at 2.79%
- Large revenue from Florida Power & Light segment generates stable cash flow
XEL Strengths
- Favorable net margin at 14.4%
- Favorable WACC at 5.18%
- Higher dividend yield at 3.09%
- Diversified revenue streams across regulated electric and natural gas sectors
NEE Weaknesses
- Unfavorable ROIC below WACC at 4.23%
- Low current and quick ratios under 0.6 indicate liquidity risks
- High debt-to-equity of 1.75 signals leverage concerns
- Unfavorable asset turnover reflects low operational efficiency
XEL Weaknesses
- Unfavorable ROE at 9.92% and ROIC at 3.64%
- Low current and quick ratios under 0.7 pose liquidity constraints
- Debt-to-equity at 1.55 remains elevated
- Asset turnover also low, impacting capital utilization
Both companies exhibit strong dividend yields and favorable cost of capital. However, liquidity and operational efficiency remain concerns for both, requiring careful capital management in their strategies.
The Moat Duel: Analyzing Competitive Defensibility
A structural moat is the only thing protecting long-term profits from the erosion of competition. Here’s how NextEra Energy and Xcel Energy stack up:
NextEra Energy, Inc. (NEE): Innovation-Driven Renewable Moat
NextEra’s advantage lies in intangible assets and cost leadership from early renewable investments. Its high margins reflect operational efficiency. Expanding battery storage in 2026 could deepen this moat.
Xcel Energy Inc. (XEL): Regulated Utility Footprint Moat
Xcel’s moat stems from regulated market positions and stable cash flows, contrasting NextEra’s tech-driven edge. Its margin stability supports moderate competitive resilience. Growth hinges on expanding renewables amid regulatory shifts.
Innovation vs. Regulation: The Battle for Utility Supremacy
NextEra’s innovation moat is wider, fueled by rising ROIC and renewable scale. Xcel’s shrinking ROIC signals weakening defensibility. I see NextEra better equipped to protect and grow its market share over the next cycle.
Which stock offers better returns?
The past year saw strong gains in both stocks, with NextEra Energy showing steady acceleration and Xcel Energy experiencing deceleration despite similar overall returns.
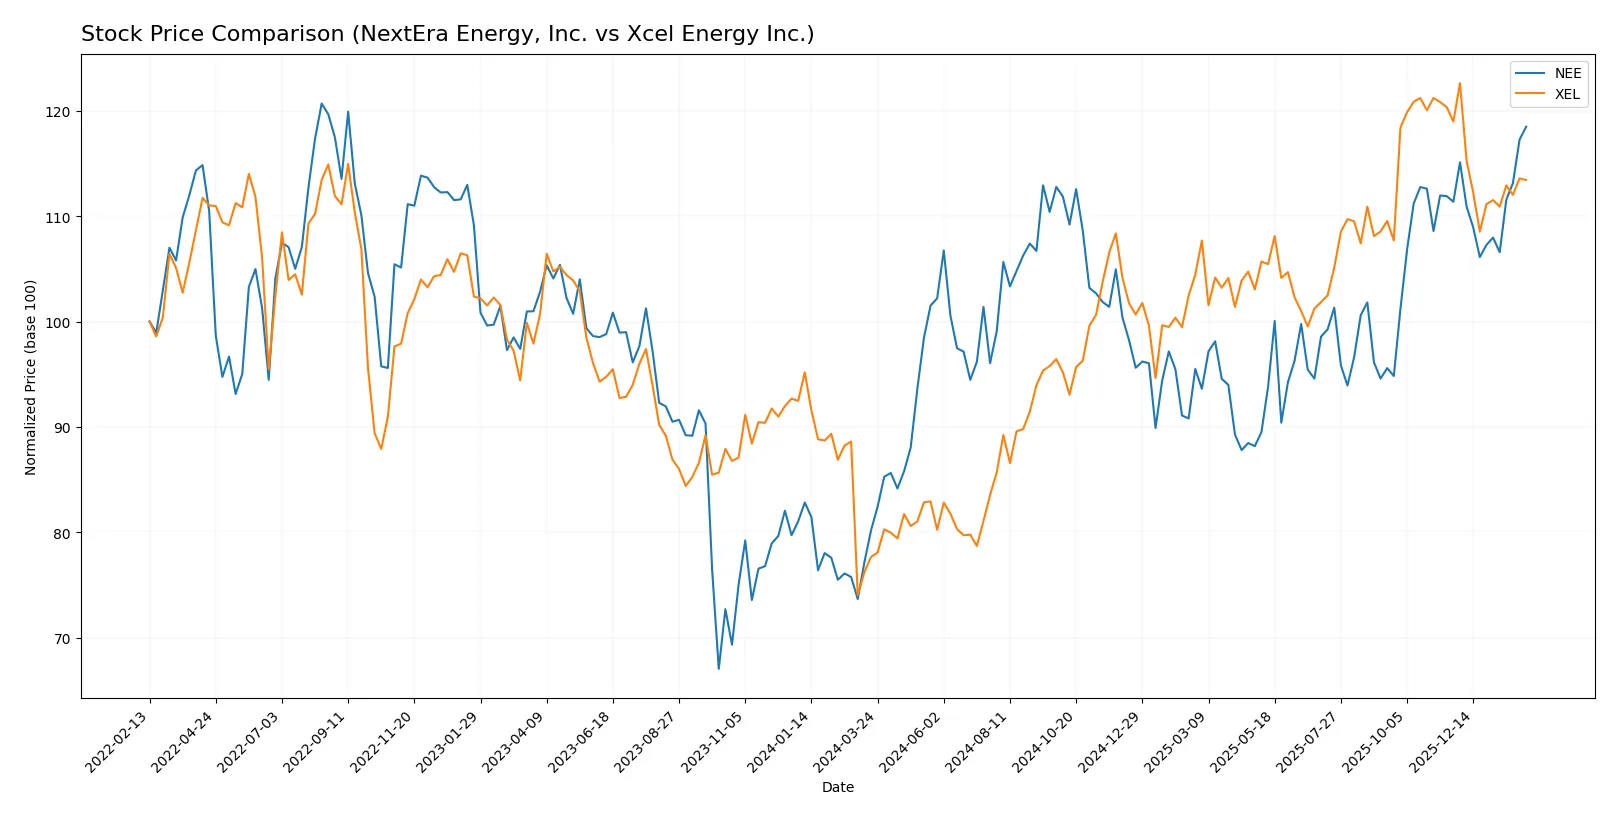
Trend Comparison
NextEra Energy’s stock rose 47.84% over the past year, marking a bullish trend with acceleration and a volatility level (std dev) of 6.34. The price ranged from 60.08 to 88.82.
Xcel Energy’s stock increased 46.09% over the same period, also bullish but with deceleration and higher volatility at 8.24. Its price fluctuated between 51.99 and 82.11.
NextEra Energy delivered a slightly higher return and accelerating momentum, outperforming Xcel Energy, whose recent trend turned bearish with a 4.67% price decline.
Target Prices
Analysts present a balanced target price consensus for these regulated electric utilities.
| Company | Target Low | Target High | Consensus |
|---|---|---|---|
| NextEra Energy, Inc. | 84 | 104 | 93.09 |
| Xcel Energy Inc. | 81 | 95 | 87.7 |
NextEra’s consensus target exceeds its current price ($88.82), suggesting modest upside. Xcel’s target consensus also surpasses its current price ($75.95), indicating potential appreciation but with a narrower margin.

Don’t Let Luck Decide Your Entry Point
Optimize your entry points with our advanced ProRealTime indicators. You’ll get efficient buy signals with precise price targets for maximum performance. Start outperforming now!
How do institutions grade them?
The following summarizes recent institutional grades for NextEra Energy, Inc. and Xcel Energy Inc.:
NextEra Energy, Inc. Grades
This table shows the latest grades from reputable financial institutions for NextEra Energy, Inc.
| Grading Company | Action | New Grade | Date |
|---|---|---|---|
| Mizuho | Maintain | Neutral | 2026-01-28 |
| Argus Research | Maintain | Buy | 2026-01-28 |
| BMO Capital | Maintain | Outperform | 2026-01-27 |
| Wells Fargo | Maintain | Overweight | 2026-01-20 |
| Barclays | Maintain | Equal Weight | 2026-01-15 |
| Jefferies | Maintain | Hold | 2025-12-31 |
| UBS | Maintain | Buy | 2025-12-17 |
| JP Morgan | Maintain | Overweight | 2025-12-11 |
| BMO Capital | Maintain | Outperform | 2025-12-10 |
| UBS | Maintain | Buy | 2025-12-10 |
Xcel Energy Inc. Grades
This table presents the most recent grades from recognized financial institutions for Xcel Energy Inc.
| Grading Company | Action | New Grade | Date |
|---|---|---|---|
| Barclays | Maintain | Overweight | 2026-01-15 |
| UBS | Maintain | Neutral | 2025-12-17 |
| Keybanc | Maintain | Overweight | 2025-12-12 |
| JP Morgan | Maintain | Overweight | 2025-12-11 |
| Barclays | Maintain | Overweight | 2025-11-05 |
| Citigroup | Maintain | Buy | 2025-11-03 |
| UBS | Maintain | Neutral | 2025-10-31 |
| Mizuho | Maintain | Outperform | 2025-10-27 |
| Jefferies | Maintain | Buy | 2025-10-16 |
| BMO Capital | Maintain | Outperform | 2025-10-15 |
Which company has the best grades?
NextEra Energy, Inc. holds a diverse range of grades from Neutral to Outperform and Buy, reflecting mixed but generally positive sentiment. Xcel Energy Inc. mostly receives Overweight and Buy ratings, indicating a slightly stronger consensus among analysts. Investors might interpret Xcel’s higher frequency of bullish grades as a signal of relatively stronger analyst confidence.
Risks specific to each company
The following categories identify critical pressure points and systemic threats facing NextEra Energy, Inc. (NEE) and Xcel Energy Inc. (XEL) in the 2026 market environment:
1. Market & Competition
NextEra Energy, Inc. (NEE)
- Dominates large clean energy markets with 28,564 MW capacity but faces intense competition in renewables.
Xcel Energy Inc. (XEL)
- Smaller scale with 3.7M electric customers, competing regionally with diverse energy sources.
2. Capital Structure & Debt
NextEra Energy, Inc. (NEE)
- High debt-to-equity ratio (1.75) and low interest coverage (1.99) signal financial risk.
Xcel Energy Inc. (XEL)
- Slightly lower leverage (1.55) and better interest coverage (2.3) indicate more manageable debt.
3. Stock Volatility
NextEra Energy, Inc. (NEE)
- Beta of 0.76 suggests moderate sensitivity to market swings.
Xcel Energy Inc. (XEL)
- Lower beta of 0.48 reflects more stable stock behavior amid market fluctuations.
4. Regulatory & Legal
NextEra Energy, Inc. (NEE)
- Operates in highly regulated states with exposure to evolving clean energy mandates.
Xcel Energy Inc. (XEL)
- Faces multi-state regulatory complexity, balancing electric and natural gas utilities.
5. Supply Chain & Operations
NextEra Energy, Inc. (NEE)
- Large transmission infrastructure (77,000 circuit miles) exposes it to operational risks and maintenance costs.
Xcel Energy Inc. (XEL)
- Diverse energy mix requires complex supply chain management across several states.
6. ESG & Climate Transition
NextEra Energy, Inc. (NEE)
- Leading clean energy developer; strong ESG positioning but capital intensive transition.
Xcel Energy Inc. (XEL)
- Also committed to renewables; slower transition pace but lower capital strain.
7. Geopolitical Exposure
NextEra Energy, Inc. (NEE)
- Primarily US-focused with limited international exposure, reducing geopolitical risk.
Xcel Energy Inc. (XEL)
- Concentrated in US Midwest and Southwest; regional policy shifts could impact operations.
Which company shows a better risk-adjusted profile?
NextEra’s most impactful risk is its capital structure, with high leverage and weak liquidity raising financial distress concerns. Xcel’s key risk lies in regulatory complexity across states and energy segments. Xcel shows a better risk-adjusted profile, evidenced by lower debt ratios, more stable stock beta, and a moderate Piotroski score. Notably, NextEra’s Altman Z-score places it deeper in the distress zone, signaling elevated bankruptcy risk despite its market leadership.
Final Verdict: Which stock to choose?
NextEra Energy’s superpower lies in its robust income growth and bullish price momentum, signaling an evolving strength despite value destruction concerns. Its capital-intensive model and weak liquidity ratios warrant vigilance. It suits investors targeting aggressive growth with tolerance for operational complexity.
Xcel Energy holds a strategic moat with a more stable dividend yield and moderate valuation metrics, reflecting a defensive posture in a volatile energy sector. Its slightly more conservative financial profile compared to NextEra offers a steadier growth path. It fits well within a GARP (Growth at a Reasonable Price) portfolio.
If you prioritize high growth potential and can endure financial leverage risks, NextEra outshines with accelerating momentum and improving profitability. However, if you seek better stability and a balanced risk-return profile, Xcel offers a safer harbor with steady income and more conservative capital management. Both warrant careful risk assessment aligned with your investment horizon.
Disclaimer: Investment carries a risk of loss of initial capital. The past performance is not a reliable indicator of future results. Be sure to understand risks before making an investment decision.
Go Further
I encourage you to read the complete analyses of NextEra Energy, Inc. and Xcel Energy Inc. to enhance your investment decisions: