Home > Comparison > Utilities > NEE vs WEC
The strategic rivalry between NextEra Energy, Inc. and WEC Energy Group, Inc. shapes the Utilities sector’s future in the U.S. NextEra operates as a capital-intensive, clean energy powerhouse with vast renewable assets. In contrast, WEC focuses on regulated electric and natural gas distribution with a diversified energy mix. This analysis evaluates their distinct operational models to determine which offers a superior risk-adjusted return for diversified portfolios amid evolving energy dynamics.
Table of contents
Companies Overview
NextEra Energy and WEC Energy Group represent two pillars of the regulated electric utility sector in the United States.
NextEra Energy, Inc.: Clean Energy Powerhouse
NextEra Energy dominates as a regulated electric utility with a robust portfolio generating power through wind, solar, nuclear, coal, and natural gas. Its core revenue stems from both retail and wholesale electricity sales across North America. In 2021, it focused heavily on expanding renewable generation facilities and battery storage projects, cementing its strategic shift toward clean energy solutions.
WEC Energy Group, Inc.: Diversified Utility Leader
WEC Energy Group operates as a regulated electric and natural gas provider primarily in the Midwest. It generates revenue through electricity and natural gas distribution, covering coal, natural gas, oil, hydro, and renewables. In 2021, WEC prioritized maintaining a broad energy mix while enhancing its natural gas infrastructure and electric transmission services, reinforcing its integrated utility model.
Strategic Collision: Similarities & Divergences
Both companies thrive in regulated utility markets but diverge in approach—NextEra pushes an aggressive clean energy expansion, while WEC balances traditional and renewable sources. Their primary battleground is the transition to sustainable energy amid regulatory shifts. NextEra’s scale and innovation contrast with WEC’s diversified infrastructure and regional focus, defining distinct risk and growth profiles for investors.
Income Statement Comparison
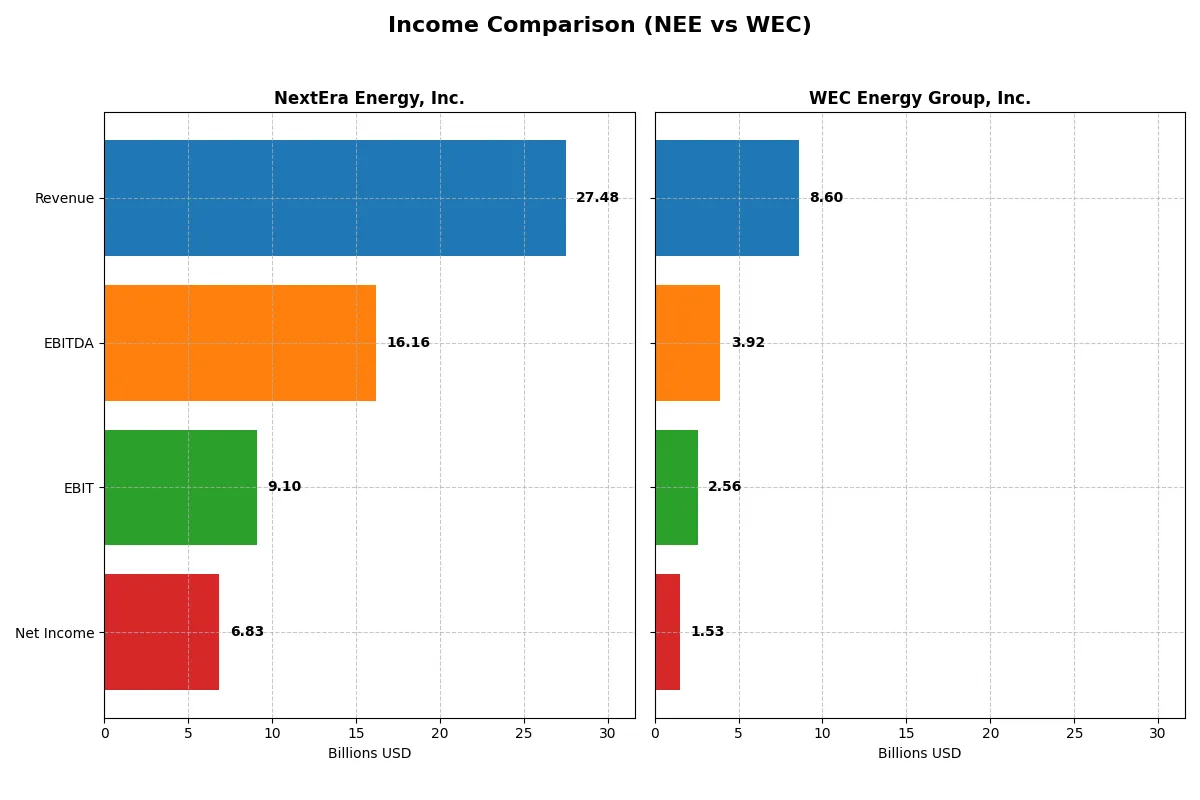
This data dissects the core profitability and scalability of both corporate engines to reveal who dominates the bottom line:
| Metric | NextEra Energy, Inc. (NEE) | WEC Energy Group, Inc. (WEC) |
|---|---|---|
| Revenue | 27.5B | 8.6B |
| Cost of Revenue | 10.2B | 4.8B |
| Operating Expenses | 8.98B | 1.63B |
| Gross Profit | 17.3B | 3.79B |
| EBITDA | 16.2B | 3.92B |
| EBIT | 9.1B | 2.56B |
| Interest Expense | 4.57B | 815M |
| Net Income | 6.83B | 1.53B |
| EPS | 3.31 | 4.81 |
| Fiscal Year | 2025 | 2024 |
Income Statement Analysis: The Bottom-Line Duel
The following income statement comparison reveals the true efficiency and profitability of each company’s core operations over recent years.
NextEra Energy, Inc. Analysis
NextEra Energy’s revenue climbed steadily from 17.1B in 2021 to 27.5B in 2025, a 61% increase. Net income nearly doubled, reaching 6.8B in 2025. The company maintains robust gross margins above 60%, reflecting strong pricing power and cost control. However, net margin dipped slightly in 2025 to about 25%, signaling margin pressure despite revenue growth. Efficiency gains appear challenged by rising interest expenses.
WEC Energy Group, Inc. Analysis
WEC Energy’s revenue grew more modestly, from 7.2B in 2020 to 8.6B in 2024, an 18.8% increase. Net income rose 27% to 1.53B in 2024. Its gross margin stands at a healthy 44%, with net margin improving to 17.8%. Notably, WEC improved net margin and EPS growth over the last year, reflecting operational momentum despite a slight revenue decline in 2024. Interest expense remains moderate, supporting bottom-line stability.
Margin Dominance vs. Growth Momentum
NextEra Energy outpaces WEC with superior revenue scale and higher gross and EBIT margins, demonstrating stronger core profitability. Conversely, WEC shows more consistent net margin and EPS growth in the near term, supported by controlled costs. For investors, NextEra’s profile suits those prioritizing scale and margin strength, while WEC appeals to those valuing steady margin improvement and earnings momentum.
Financial Ratios Comparison
These vital ratios act as a diagnostic tool to expose the underlying fiscal health, valuation premiums, and capital efficiency of the companies analyzed:
| Ratios | NextEra Energy, Inc. (NEE) | WEC Energy Group, Inc. (WEC) |
|---|---|---|
| ROE | 12.5% | 12.3% |
| ROIC | 4.2% | 4.1% |
| P/E | 24.5 | 19.5 |
| P/B | 3.07 | 2.39 |
| Current Ratio | 0.60 | 0.60 |
| Quick Ratio | 0.49 | 0.43 |
| D/E | 1.75 | 1.64 |
| Debt-to-Assets | 45.0% | 42.9% |
| Interest Coverage | 1.81 | 2.64 |
| Asset Turnover | 0.13 | 0.18 |
| Fixed Asset Turnover | 0.18 | 0.25 |
| Payout ratio | 68.5% | 69.1% |
| Dividend yield | 2.79% | 3.55% |
| Fiscal Year | 2025 | 2024 |
Efficiency & Valuation Duel: The Vital Signs
Financial ratios serve as a company’s DNA, exposing hidden operational strengths and risks that raw numbers alone can’t reveal.
NextEra Energy, Inc.
NextEra shows a strong net margin of 24.87%, indicating operational efficiency, but its ROE at 12.51% remains neutral. The P/E ratio of 24.54 suggests the stock is fairly valued, though a high PB ratio of 3.07 appears stretched. With a 2.79% dividend yield, it rewards shareholders steadily amid mixed capital efficiency signals.
WEC Energy Group, Inc.
WEC posts a solid net margin of 17.77%, reflecting good profitability, paired with a neutral ROE near 12.3%. Its P/E of 19.46 and PB of 2.39 imply a more reasonable valuation relative to peers. The 3.55% dividend yield outpaces NextEra’s, signaling stronger shareholder returns despite some operational inefficiencies.
Balanced Valuation vs. Dividend Strength
NextEra commands a premium valuation but faces several unfavorable ratios, suggesting operational risks. WEC offers a more balanced valuation with higher dividend yield and fewer red flags. Investors prioritizing steady income may favor WEC, while those accepting valuation risk might consider NextEra’s growth profile.
Which one offers the Superior Shareholder Reward?
I observe that NextEra Energy (NEE) offers a 2.79% dividend yield with a high 68% payout ratio, but it struggles with negative free cash flow (-5.8B in 2025), indicating dividend sustainability risks. NEE’s buybacks are muted given its capex-heavy model. WEC Energy Group (WEC) delivers a higher 3.55% yield and a similar payout ratio near 69%, supported by positive free cash flow (1.36B in 2024) and robust buybacks. WEC’s distribution model balances steady dividends with buybacks, underpinned by healthier free cash flow coverage. For 2026 total return, I favor WEC’s sustainable shareholder rewards over NEE’s riskier payout profile.
Comparative Score Analysis: The Strategic Profile
The radar chart reveals the fundamental DNA and trade-offs of NextEra Energy, Inc. and WEC Energy Group, Inc., highlighting strengths and vulnerabilities across key financial metrics:
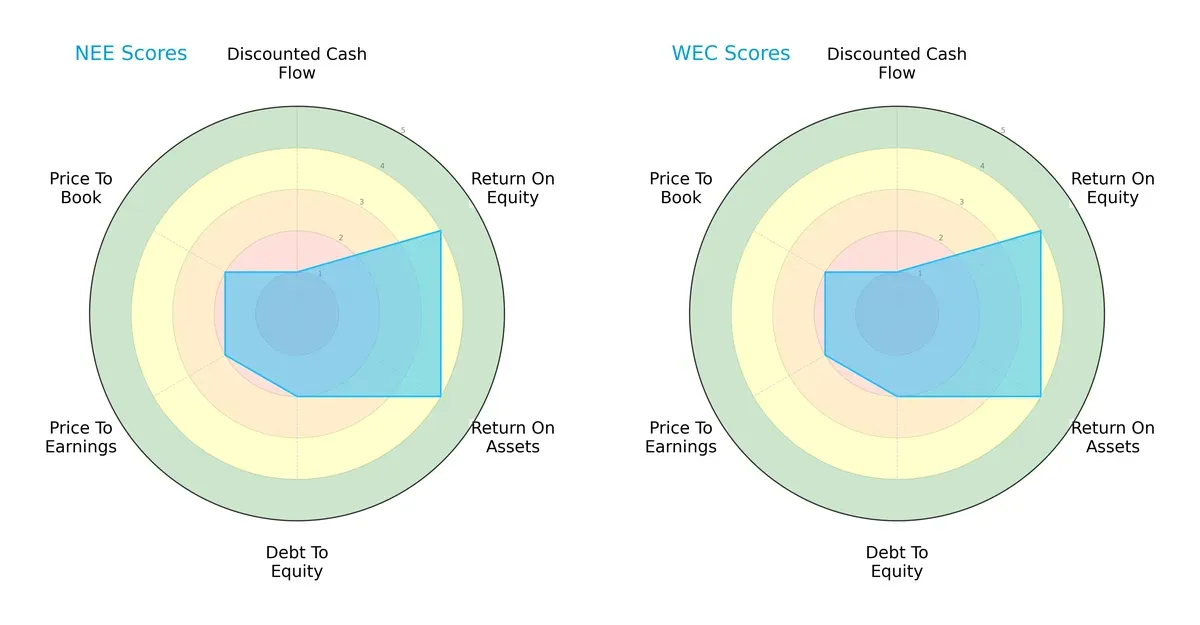
Both firms share identical scores across DCF, ROE, ROA, Debt/Equity, and valuation metrics, indicating a mirrored strategic profile. Each shows strong returns on equity and assets (score 4), balanced by a moderate debt position (score 2) and valuation (score 2). Neither company stands out with a distinct edge; both maintain a moderate overall score of 3, reflecting a stable but unspectacular financial posture.
Bankruptcy Risk: Solvency Showdown
NextEra Energy edges WEC slightly in Altman Z-Score, 1.20 versus 1.14, yet both remain in the distress zone, signaling elevated bankruptcy risk in the current economic cycle:
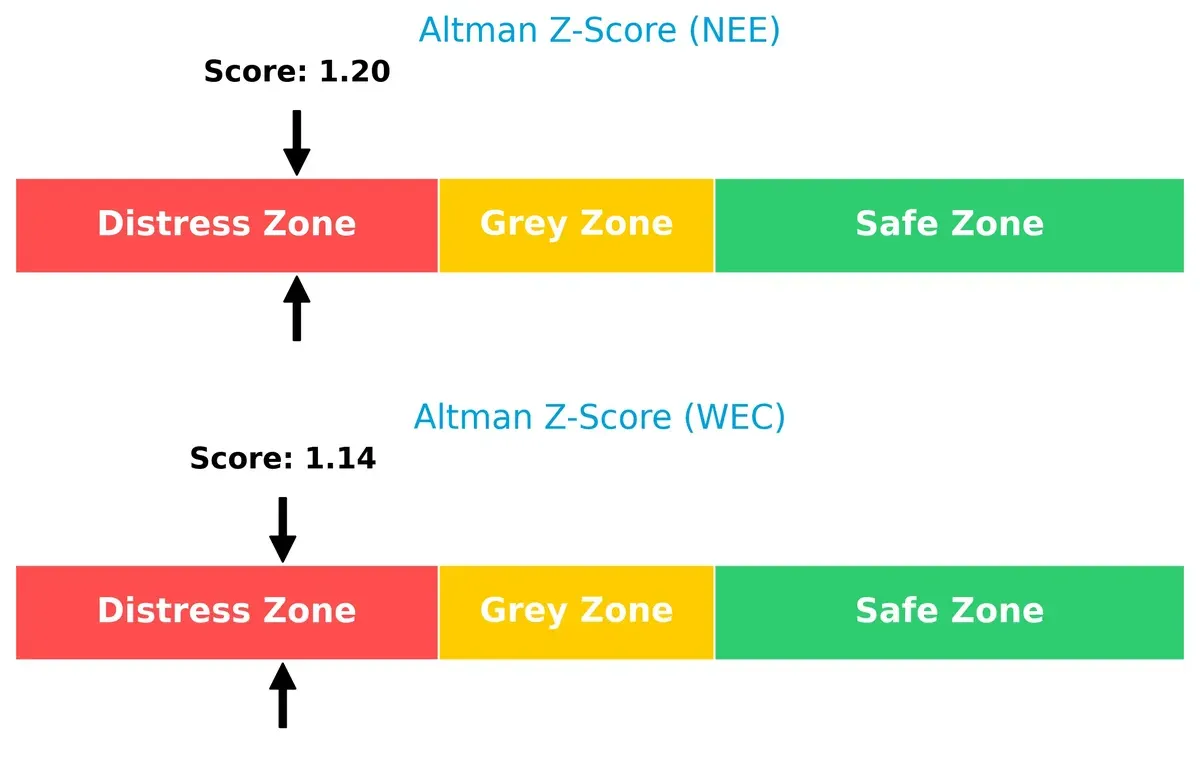
This proximity in distress scores warns investors to proceed cautiously. Historically, utilities typically sustain better solvency, so these low scores may reflect sector-specific pressures or capital structure risks.
Financial Health: Quality of Operations
NextEra Energy shows stronger financial health with a Piotroski F-Score of 7, compared to WEC’s average 6, suggesting better internal financial quality and operational efficiency:
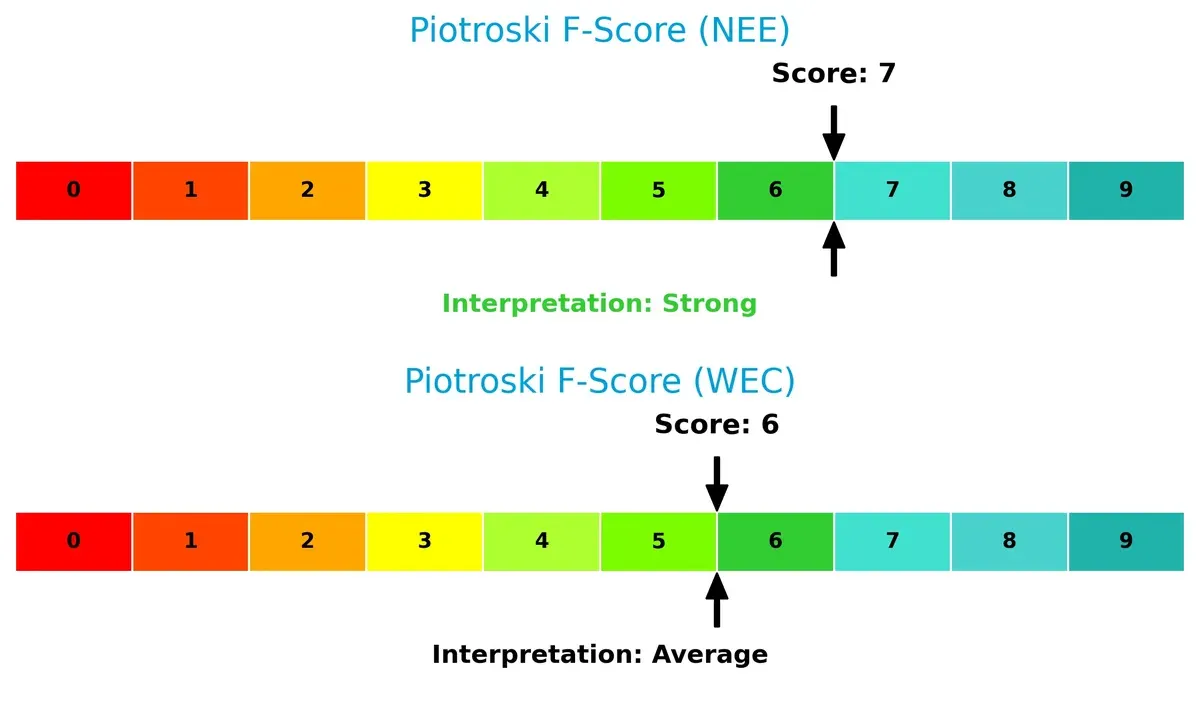
A score of 7 indicates robust profitability, liquidity, and leverage metrics, while WEC’s score hints at some areas needing improvement. For risk-averse investors, NextEra’s stronger F-Score offers a modest buffer amid solvency concerns.
How are the two companies positioned?
This section dissects the operational DNA of NextEra Energy and WEC Energy through their revenue distribution and internal strengths and weaknesses. The goal is to confront their economic moats and identify which business model offers the most resilient competitive advantage today.
Revenue Segmentation: The Strategic Mix
This comparison dissects how NextEra Energy and WEC Energy diversify income streams and reveals where each places its primary sector bets:
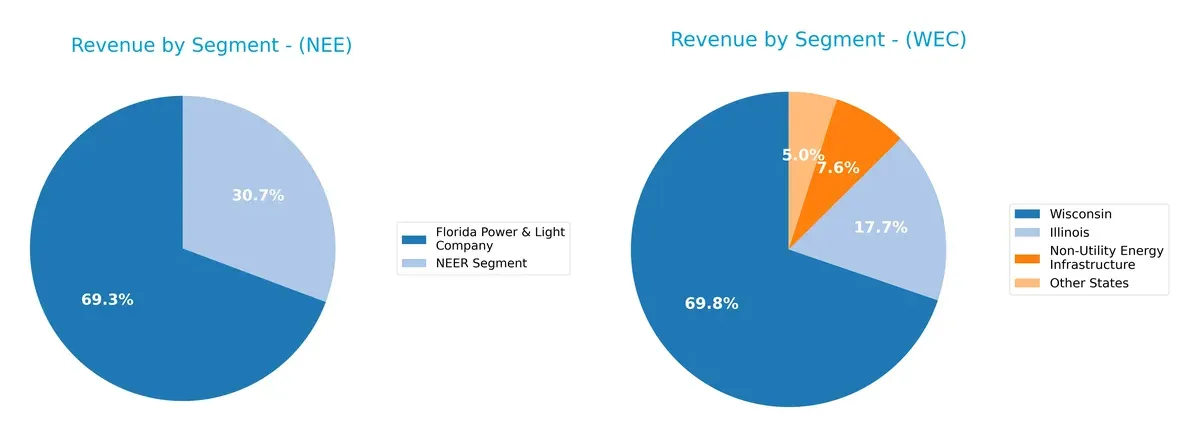
NextEra Energy anchors revenue heavily in its Florida Power & Light segment at $17B, while its NextEra Energy Resources segment adds $7.5B, showing moderate diversification. WEC Energy, by contrast, pivots on a more balanced portfolio: Wisconsin leads with $6.3B, Illinois contributes $1.6B, and Non-Utility Infrastructure adds $691M. NextEra’s concentration in Florida power reflects infrastructure dominance but carries regional risk. WEC’s spread across states reduces exposure and suggests a resilient, multi-state utility model.
Strengths and Weaknesses Comparison
This table compares the Strengths and Weaknesses of NextEra Energy, Inc. and WEC Energy Group, Inc.:
NextEra Energy, Inc. Strengths
- Higher net margin at 24.87% indicating strong profitability
- Favorable WACC at 6.52% supports capital efficiency
- Significant revenue from diversified segments including Florida Power & Light and NextEra Energy Resources
WEC Energy Group, Inc. Strengths
- Favorable net margin at 17.77% with solid profitability
- Lower WACC at 5.43% enhances investment returns
- Geographic revenue diversification across Illinois, Wisconsin, and other states
NextEra Energy, Inc. Weaknesses
- Unfavorable ROIC below WACC at 4.23% signals poor capital returns
- Low liquidity with current ratio at 0.6 and quick ratio at 0.49
- High debt-to-equity at 1.75 and weak interest coverage at 1.99
WEC Energy Group, Inc. Weaknesses
- ROIC also below WACC at 4.14% indicating limited capital efficiency
- Low liquidity ratios similar to NextEra with current ratio 0.6 and quick ratio 0.43
- Elevated debt-to-equity at 1.64 and only neutral interest coverage at 3.14
NextEra shows stronger profitability and segment diversification but struggles with capital efficiency and liquidity. WEC benefits from geographic diversification and slightly better capital costs but shares similar liquidity and leverage concerns. Both companies face challenges in generating returns above their cost of capital, which is critical for long-term value creation.
The Moat Duel: Analyzing Competitive Defensibility
A structural moat safeguards long-term profits from relentless competitive pressures. Without it, earnings erode quickly. Let’s examine how NextEra Energy and WEC Energy Group defend their turf:
NextEra Energy, Inc.: Intangible Assets Powering Clean Energy Leadership
NextEra’s moat stems from its extensive renewable infrastructure and brand strength in clean energy. Robust margin stability and 33% EBIT margin underline this. Emerging battery storage and transmission projects could deepen its competitive edge in 2026.
WEC Energy Group, Inc.: Regulated Utilities with Cost Advantage
WEC’s moat relies on regulated market positions and efficient cost management, reflected in solid 29.8% EBIT margin. Unlike NextEra, WEC’s incremental ROIC growth is modest. Expansion in natural gas infrastructure offers steady growth opportunities amid regulatory stability.
Clean Energy Innovation vs. Regulated Market Dominance
Both firms show growing ROIC but remain slightly below WACC, signaling value destruction despite improving profitability. NextEra’s intangible assets and innovation create a wider moat. WEC’s regulated cost advantage is narrower but resilient. I see NextEra better equipped to defend and expand its market share through clean energy leadership.
Which stock offers better returns?
Over the past year, both NextEra Energy, Inc. and WEC Energy Group, Inc. showed strong upward price movements, with differing acceleration patterns and trading volumes shaping their trajectories.
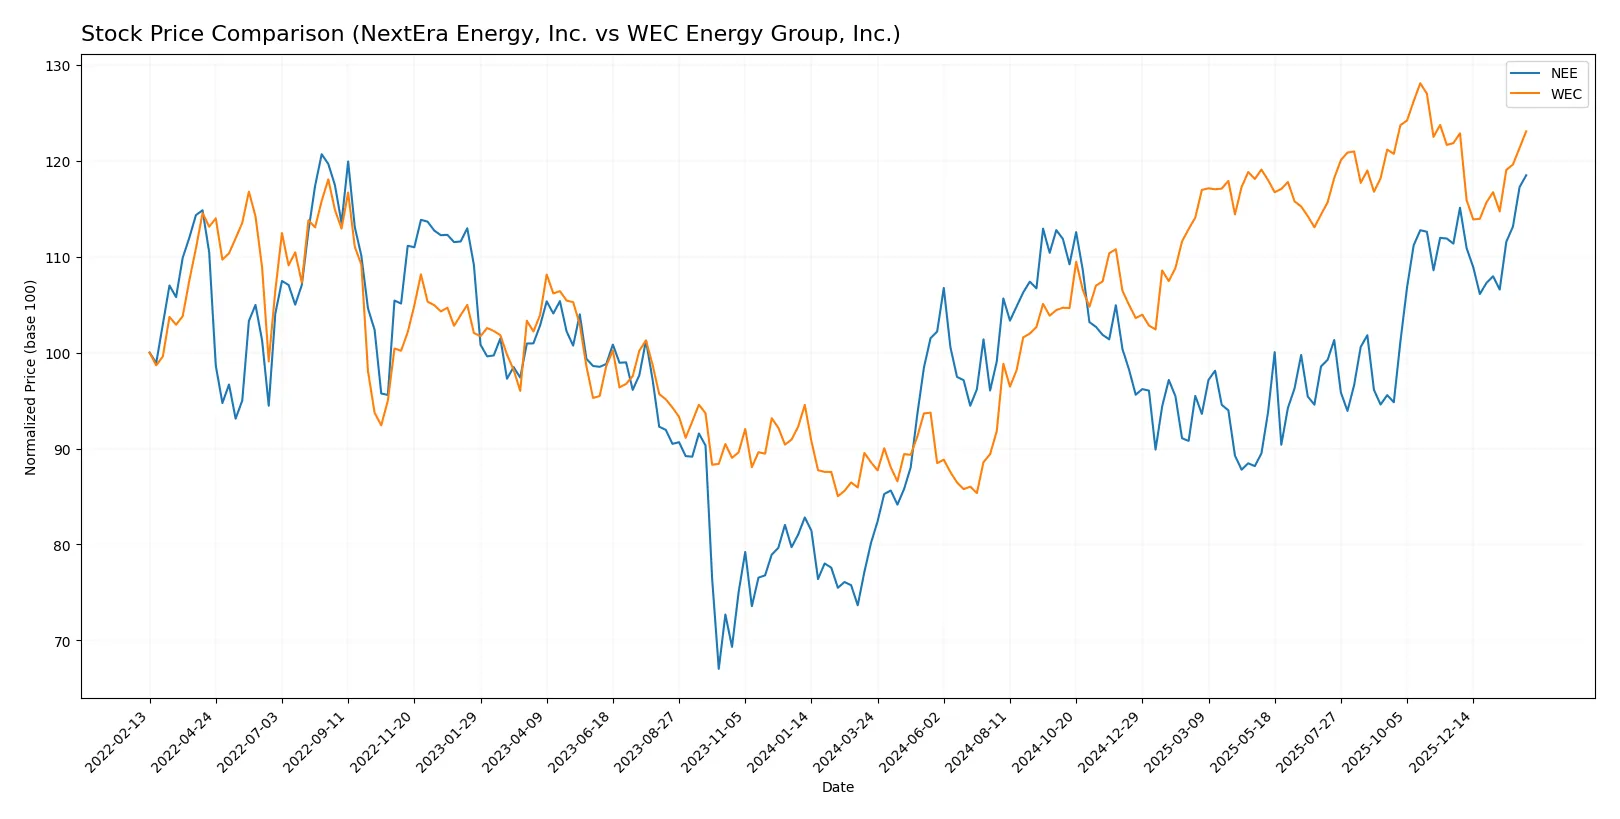
Trend Comparison
NextEra Energy, Inc. posted a 47.84% price increase over 12 months, signaling a bullish trend with accelerating momentum and moderate volatility (6.34 std deviation). Its price ranged from 60.08 to 88.82.
WEC Energy Group, Inc. gained 38.97% over the same period, also bullish but with decelerating momentum and higher volatility (11.01 std deviation). Prices fluctuated between 77.85 and 116.84.
NextEra outperformed WEC in total price appreciation and acceleration, despite WEC’s stronger buyer dominance in recent trading volume.
Target Prices
Analysts present a confident target price consensus for NextEra Energy and WEC Energy Group.
| Company | Target Low | Target High | Consensus |
|---|---|---|---|
| NextEra Energy, Inc. | 84 | 104 | 93.09 |
| WEC Energy Group, Inc. | 105 | 135 | 121.33 |
NextEra’s consensus target of 93.09 exceeds its current price of 88.82, signaling moderate upside. WEC’s 121.33 target is well above its 112.26 price, suggesting stronger analyst optimism.

Don’t Let Luck Decide Your Entry Point
Optimize your entry points with our advanced ProRealTime indicators. You’ll get efficient buy signals with precise price targets for maximum performance. Start outperforming now!
How do institutions grade them?
NextEra Energy, Inc. Grades
The following table summarizes recent grades from trusted financial institutions for NextEra Energy, Inc.:
| Grading Company | Action | New Grade | Date |
|---|---|---|---|
| Mizuho | Maintain | Neutral | 2026-01-28 |
| Argus Research | Maintain | Buy | 2026-01-28 |
| BMO Capital | Maintain | Outperform | 2026-01-27 |
| Wells Fargo | Maintain | Overweight | 2026-01-20 |
| Barclays | Maintain | Equal Weight | 2026-01-15 |
| Jefferies | Maintain | Hold | 2025-12-31 |
| UBS | Maintain | Buy | 2025-12-17 |
| JP Morgan | Maintain | Overweight | 2025-12-11 |
| BMO Capital | Maintain | Outperform | 2025-12-10 |
| UBS | Maintain | Buy | 2025-12-10 |
WEC Energy Group, Inc. Grades
Here are the latest grades from reputable institutions for WEC Energy Group, Inc.:
| Grading Company | Action | New Grade | Date |
|---|---|---|---|
| Jefferies | Maintain | Hold | 2026-01-28 |
| Barclays | Maintain | Equal Weight | 2026-01-22 |
| Wells Fargo | Maintain | Overweight | 2026-01-20 |
| JP Morgan | Maintain | Neutral | 2026-01-15 |
| B of A Securities | Maintain | Neutral | 2025-12-31 |
| UBS | Maintain | Neutral | 2025-12-17 |
| Barclays | Maintain | Equal Weight | 2025-12-16 |
| Keybanc | Maintain | Overweight | 2025-12-12 |
| JP Morgan | Maintain | Neutral | 2025-12-11 |
| Jefferies | Maintain | Hold | 2025-11-18 |
Which company has the best grades?
NextEra Energy, Inc. consistently receives higher ratings such as Buy, Outperform, and Overweight. WEC Energy Group’s grades lean more toward Neutral and Hold. Investors may view NextEra Energy as the stronger growth candidate based on these institutional assessments.
Risks specific to each company
The following categories identify critical pressure points and systemic threats facing NextEra Energy, Inc. and WEC Energy Group, Inc. in the 2026 market environment:
1. Market & Competition
NextEra Energy, Inc.
- Faces stiff competition in renewable energy markets amid rapid innovation and regulatory shifts.
WEC Energy Group, Inc.
- Operates in a more stable regional market with less aggressive renewable competition.
2. Capital Structure & Debt
NextEra Energy, Inc.
- High debt-to-equity ratio (1.75) and weak interest coverage (1.99) raise financial risk concerns.
WEC Energy Group, Inc.
- Slightly lower debt-to-equity (1.64) and moderate interest coverage (3.14) indicate better debt management.
3. Stock Volatility
NextEra Energy, Inc.
- Beta of 0.76 suggests moderate market sensitivity and some price swings.
WEC Energy Group, Inc.
- Lower beta at 0.58 indicates reduced volatility and defensive stock characteristics.
4. Regulatory & Legal
NextEra Energy, Inc.
- Subject to complex regulations across multiple states and renewable mandates.
WEC Energy Group, Inc.
- Operates primarily in regulated Midwest markets with established compliance frameworks.
5. Supply Chain & Operations
NextEra Energy, Inc.
- Relies on diverse energy sources, increasing operational complexity and supply risks.
WEC Energy Group, Inc.
- Maintains extensive natural gas infrastructure, offering operational stability but exposure to fuel price swings.
6. ESG & Climate Transition
NextEra Energy, Inc.
- Heavy investment in renewables supports ESG goals but requires capital-intensive projects.
WEC Energy Group, Inc.
- Balanced energy mix with steady ESG improvements, less aggressive but more predictable transition.
7. Geopolitical Exposure
NextEra Energy, Inc.
- Primarily US-focused but sensitive to national energy policy shifts and trade tariffs.
WEC Energy Group, Inc.
- Regional focus reduces geopolitical risks but vulnerable to state-level political changes.
Which company shows a better risk-adjusted profile?
NextEra’s most impactful risk lies in its stretched capital structure and weak liquidity ratios. WEC’s principal risk is moderate exposure to natural gas price fluctuations. WEC offers a better risk-adjusted profile, supported by stronger interest coverage and lower debt leverage. Additionally, NextEra’s Altman Z-score in the distress zone signals heightened bankruptcy risk, whereas WEC’s score, though also low, is slightly weaker. This underscores my concern about NextEra’s financial resilience amid market pressures.
Final Verdict: Which stock to choose?
NextEra Energy, Inc. (NEE) wields unmatched scale and growth momentum in the clean energy transition. Its superpower lies in robust revenue expansion and improving profitability despite capital intensity. A point of vigilance is its stretched balance sheet and low liquidity, which could pressure in downturns. NEE fits an aggressive growth portfolio willing to tolerate balance sheet risks.
WEC Energy Group, Inc. (WEC) offers a strategic moat rooted in steady regulated utility cash flows and disciplined capital allocation. It delivers superior dividend yield and modest growth with better financial stability than NEE. WEC suits a GARP investor seeking a blend of income and moderate upside with lower volatility.
If you prioritize rapid growth and market leadership in renewables, NextEra Energy outshines due to its scale and improving margins. However, if you seek better stability and income with a defensive bias, WEC offers a safer profile and reliable dividends. Both companies show slightly unfavorable moats by ROIC vs. WACC, so cautious position sizing is prudent.
Disclaimer: Investment carries a risk of loss of initial capital. The past performance is not a reliable indicator of future results. Be sure to understand risks before making an investment decision.
Go Further
I encourage you to read the complete analyses of NextEra Energy, Inc. and WEC Energy Group, Inc. to enhance your investment decisions: