Home > Comparison > Utilities > NEE vs PPL
The strategic rivalry between NextEra Energy, Inc. and PPL Corporation shapes the utilities sector’s future. NextEra stands as a clean energy pioneer with a diverse generation portfolio and extensive transmission infrastructure. PPL operates as a regional utility focused on regulated electric and natural gas services across select U.S. markets. This analysis weighs their contrasting operational models to identify which offers superior risk-adjusted returns for a diversified portfolio.

Table of contents
Companies Overview
NextEra Energy and PPL Corporation stand as key players in the regulated electric utility sector in the U.S.
NextEra Energy, Inc.: Leader in Clean Energy Generation
NextEra Energy dominates with a 28,564 MW net generating capacity, focusing on renewable and clean energy. It generates revenue by selling electricity via wind, solar, nuclear, coal, and gas assets. In 2021, its strategic priority centered on expanding long-term contracted clean energy projects, battery storage, and transmission infrastructure, serving 11M people across Florida’s east and west coasts.
PPL Corporation: Regional Utility with Diverse Energy Portfolio
PPL Corporation operates primarily in Kentucky and Pennsylvania, serving about 2.7M customers with electricity and natural gas. It earns revenue through regulated electric and gas distribution, plus electricity generation from coal, gas, hydro, and solar sources. Its 2021 strategy emphasized stable regulated operations across two main segments—Kentucky and Pennsylvania—balancing traditional and renewable energy supplies.
Strategic Collision: Similarities & Divergences
Both companies operate in regulated electric utilities but differ in scale and focus. NextEra pursues a growth-oriented clean energy model, while PPL emphasizes regional regulated stability and diversified fuel sources. Their primary battleground is the transition to renewables amid regulatory shifts. Investors face a choice: NextEra’s expansive clean energy footprint versus PPL’s conservative, regionally focused utility profile.
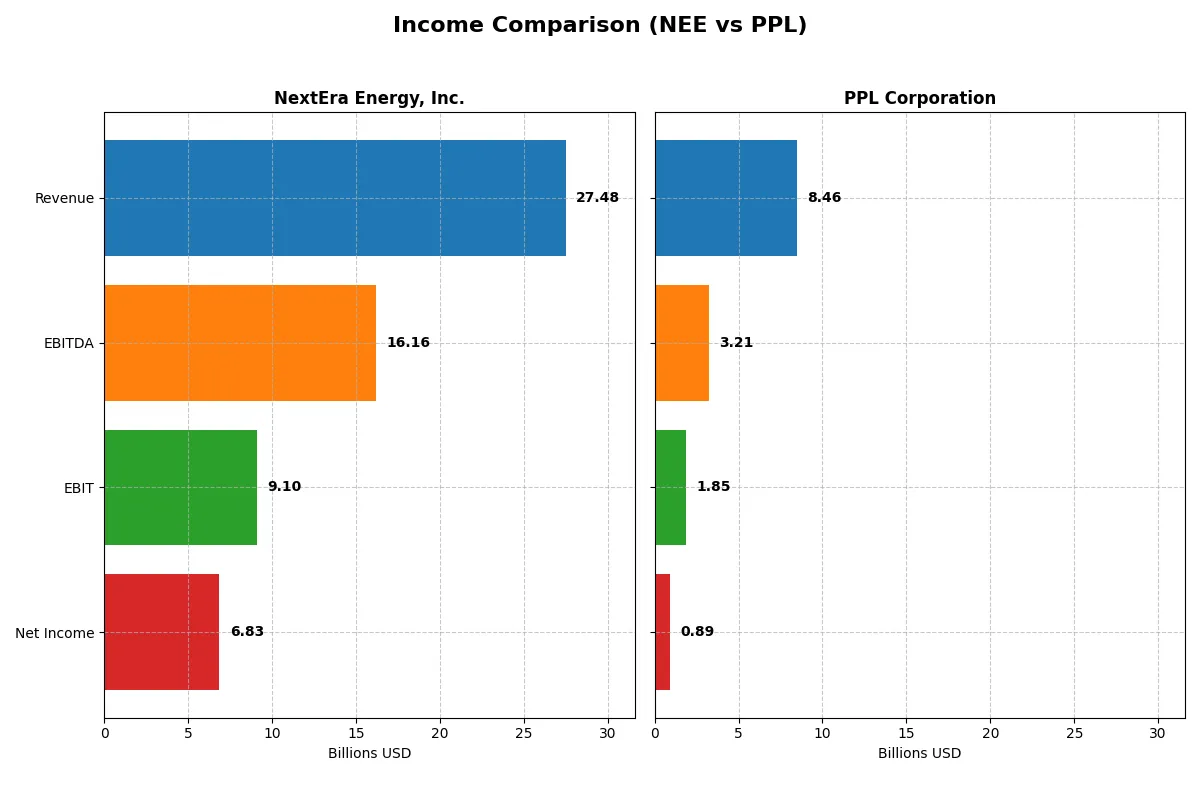
Income Statement Comparison
This data dissects the core profitability and scalability of both corporate engines to reveal who dominates the bottom line:
| Metric | NextEra Energy, Inc. (NEE) | PPL Corporation (PPL) |
|---|---|---|
| Revenue | 27.48B | 8.46B |
| Cost of Revenue | 10.22B | 5.07B |
| Operating Expenses | 8.98B | 1.65B |
| Gross Profit | 17.25B | 3.39B |
| EBITDA | 16.17B | 3.21B |
| EBIT | 9.10B | 1.85B |
| Interest Expense | 4.57B | 738M |
| Net Income | 6.83B | 886M |
| EPS | 3.31 | 1.20 |
| Fiscal Year | 2025 | 2024 |
Income Statement Analysis: The Bottom-Line Duel
This income statement comparison reveals how efficiently each company converts revenue into profits and manages costs amid changing market conditions.
NextEra Energy, Inc. Analysis
NextEra Energy’s revenue rose 11% in 2025 to $27.5B, driving gross profit up 16% to $17.3B. Its gross margin remains robust at 62.8%, with a strong EBIT margin of 33.1%. Despite a 11% rise in operating expenses, net income slipped 2.3% to $6.8B, signaling margin pressure but solid overall momentum.
PPL Corporation Analysis
PPL’s revenue grew modestly by 1.8% to $8.5B in 2024, lifting gross profit by 3.6% to $3.4B. The company sustains a 40.1% gross margin and a 21.9% EBIT margin. Net income expanded 20% to $888M, reflecting improved operational efficiency and margin recovery despite slower top-line growth.
Margin Strength vs. Earnings Momentum
NextEra Energy clearly dominates with superior scale, higher margins, and stronger revenue growth over five years. However, PPL shows more recent net income momentum and margin improvement. For investors, NextEra offers robust margin power and scale, while PPL provides a sharper earnings rebound profile in a smaller footprint.
Financial Ratios Comparison
These vital ratios act as a diagnostic tool to expose the underlying fiscal health, valuation premiums, and capital efficiency of the companies compared below:
| Ratios | NextEra Energy, Inc. (NEE) | PPL Corporation (PPL) |
|---|---|---|
| ROE | 12.5% | 6.3% |
| ROIC | 4.2% | 3.6% |
| P/E | 24.5 | 27.0 |
| P/B | 3.1 | 1.7 |
| Current Ratio | 0.60 | 0.86 |
| Quick Ratio | 0.49 | 0.71 |
| D/E | 1.75 | 1.19 |
| Debt-to-Assets | 45.0% | 40.9% |
| Interest Coverage | 1.81 | 2.36 |
| Asset Turnover | 0.13 | 0.21 |
| Fixed Asset Turnover | 0.18 | 0.26 |
| Payout Ratio | 68.5% | 84.1% |
| Dividend Yield | 2.79% | 3.12% |
| Fiscal Year | 2025 | 2024 |
Efficiency & Valuation Duel: The Vital Signs
Financial ratios serve as a company’s DNA, exposing hidden risks and operational strengths that numbers alone cannot reveal.
NextEra Energy, Inc.
NextEra Energy posts a solid net margin of 24.87%, signaling strong profitability. Its ROE of 12.51% is neutral, but the 4.23% ROIC lags behind the 6.52% WACC, indicating capital inefficiency. The P/E at 24.54 suggests fair valuation. A 2.79% dividend yield rewards shareholders despite some balance sheet weaknesses.
PPL Corporation
PPL shows a respectable net margin of 10.49%, yet its ROE at 6.31% trails industry standards, reflecting weaker profitability. The P/E of 26.97 appears stretched, implying higher relative valuation risk. It offers a 3.12% dividend yield, providing steady shareholder income amid moderate financial leverage and asset utilization challenges.
Premium Valuation vs. Operational Safety
NextEra balances profitability and shareholder reward more effectively than PPL’s stretched valuation and lower returns. Investors prioritizing dividend income and modest risk may prefer PPL, while those seeking operational resilience might lean toward NextEra.
Which one offers the Superior Shareholder Reward?
NextEra Energy, Inc. (NEE) and PPL Corporation (PPL) both pay dividends and engage in buybacks, but their strategies differ. NEE yields ~2.8%, with a payout ratio of 68%, reflecting robust earnings reinvestment despite recent negative free cash flow. PPL offers a higher yield near 3.1%, but with an 84% payout ratio and weaker free cash flow, raising sustainability concerns. NEE’s aggressive share buyback and reinvestment in growth projects suggest a more balanced capital allocation. PPL’s higher leverage and payout strain cash flow, limiting flexibility. I conclude NEE offers a superior total return profile in 2026 due to sustainable distributions and growth focus.
Comparative Score Analysis: The Strategic Profile
The radar chart reveals the fundamental DNA and trade-offs of NextEra Energy, Inc. and PPL Corporation through key financial metrics:
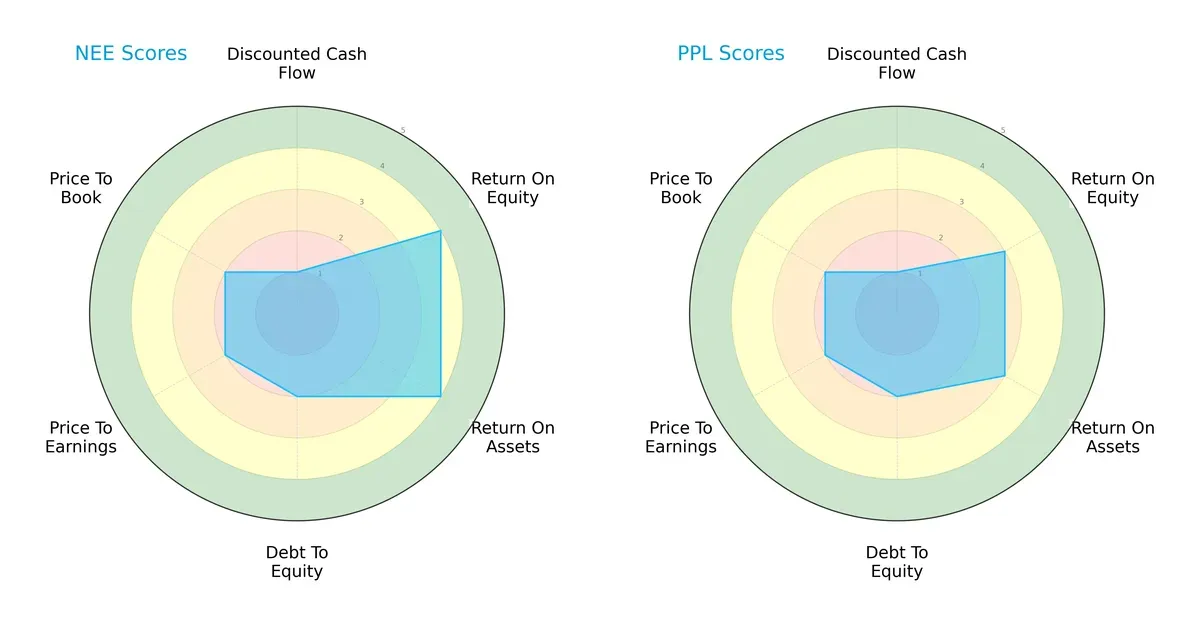
NextEra Energy shows stronger profitability with higher ROE (4 vs. 3) and ROA (4 vs. 3) scores compared to PPL. Both firms share similar moderate debt-to-equity and valuation scores. NextEra’s more balanced profile contrasts with PPL’s reliance on moderate operational efficiency, signaling NextEra’s superior capital allocation and asset utilization.
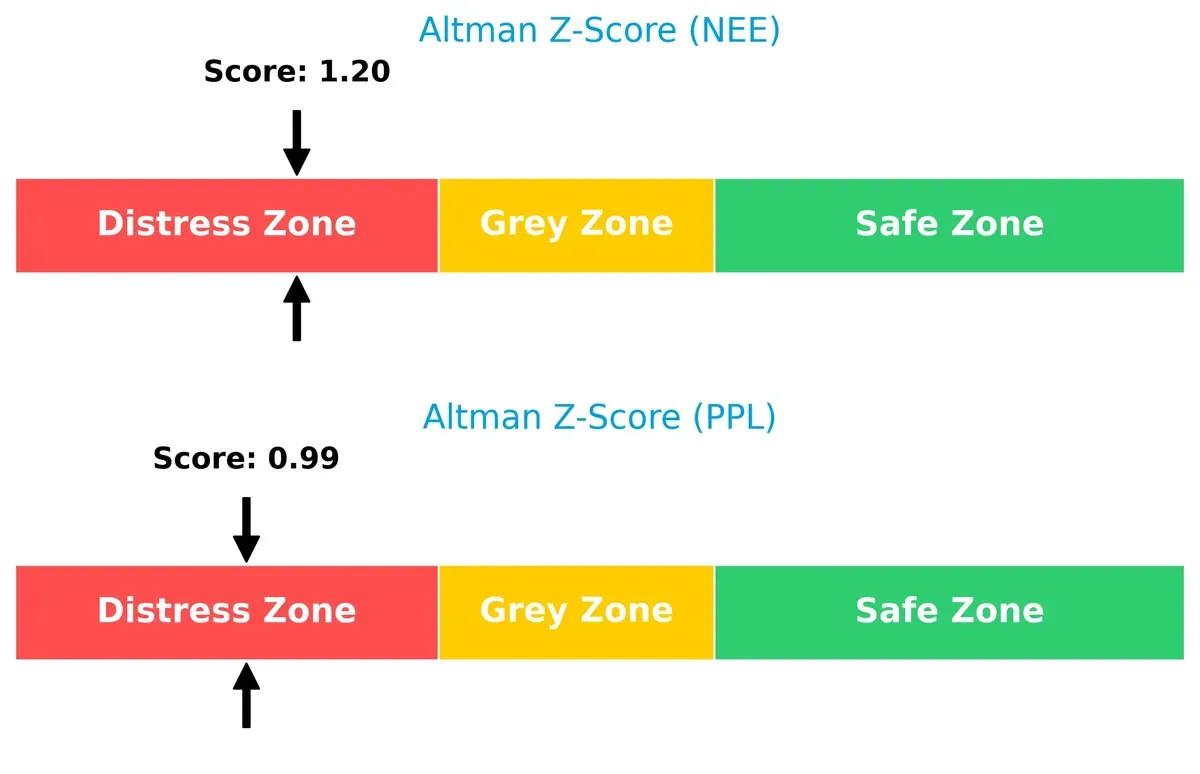
Bankruptcy Risk: Solvency Showdown
NextEra’s Altman Z-Score of 1.20 slightly exceeds PPL’s 0.99, but both remain in the distress zone, signaling a high bankruptcy risk in this cycle:
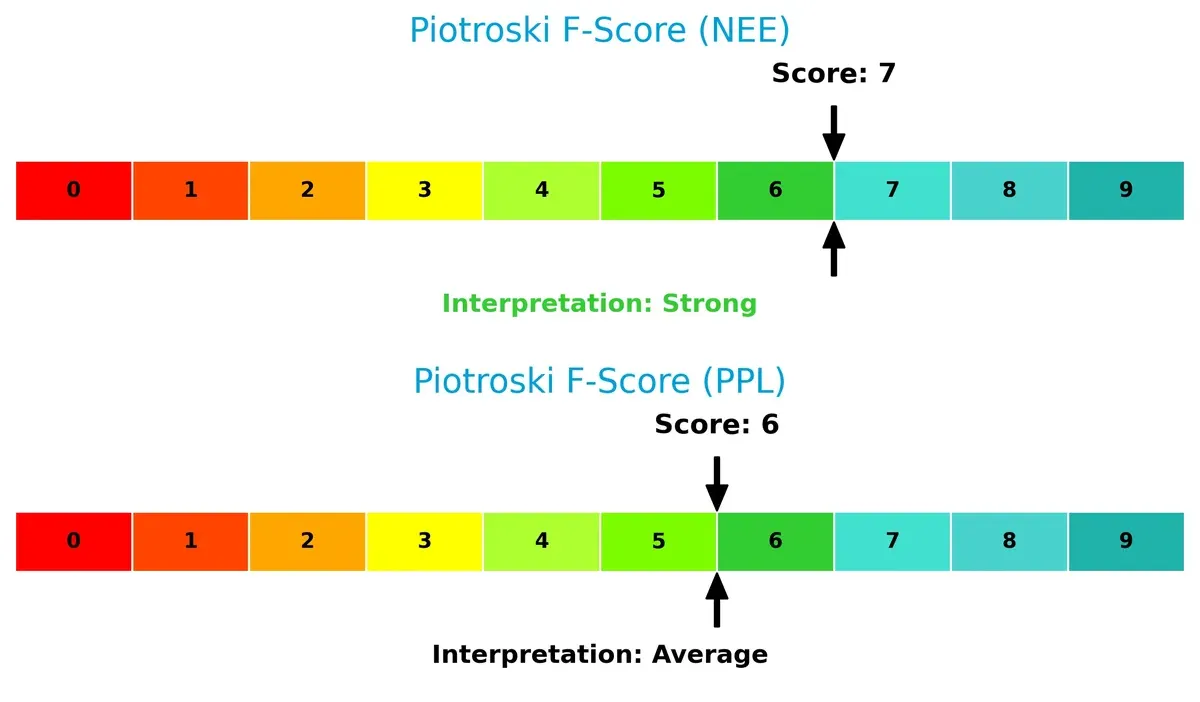
Financial Health: Quality of Operations
NextEra’s Piotroski F-Score of 7 outperforms PPL’s 6, indicating stronger financial health and fewer internal red flags for NextEra:
How are the two companies positioned?
This section dissects the operational DNA of NextEra Energy and PPL Corporation by comparing their revenue distribution and internal dynamics. The goal is to confront their economic moats and identify which business model offers the most resilient competitive advantage today.
Revenue Segmentation: The Strategic Mix
This visual comparison dissects how NextEra Energy and PPL diversify their income streams and where their primary sector bets lie:
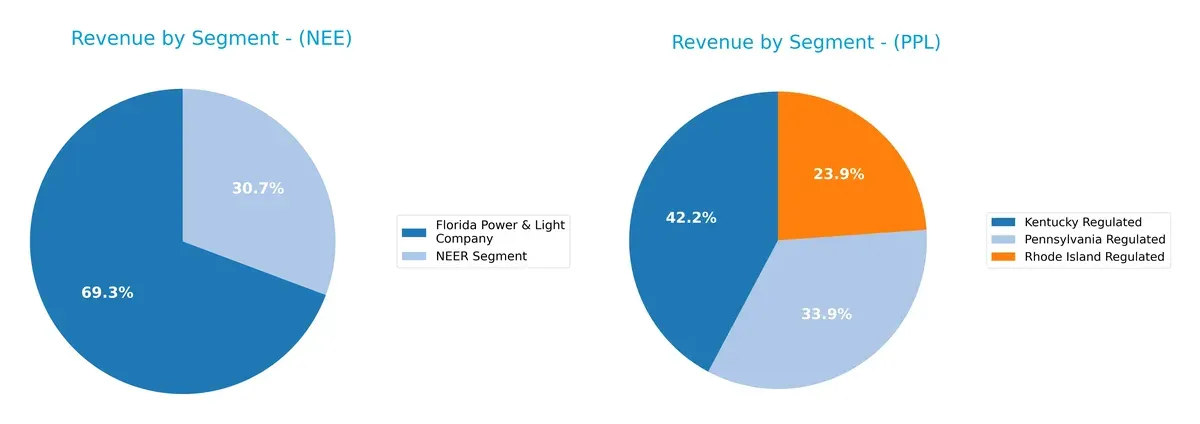
NextEra Energy anchors revenue in Florida Power & Light at $17B, with a substantial $7.5B from NEER Segment, showing moderate diversification. PPL spreads revenue more evenly across Kentucky ($3.6B), Pennsylvania ($2.9B), and Rhode Island ($2B), reflecting broader regional exposure. NextEra’s concentration pivots on infrastructure dominance in Florida, while PPL’s mix mitigates concentration risk via regulated utilities diversification.
Strengths and Weaknesses Comparison
This table compares the Strengths and Weaknesses of NextEra Energy, Inc. (NEE) and PPL Corporation (PPL):
NEE Strengths
- High net margin at 24.87%
- Favorable WACC at 6.52%
- Strong dividend yield at 2.79%
- Large revenue base from Florida Power & Light segment
PPL Strengths
- Favorable net margin at 10.49%
- Favorable WACC at 5.59%
- Higher dividend yield at 3.12%
- Diversified geographic presence including US and UK markets
NEE Weaknesses
- Low current (0.6) and quick ratios (0.49) indicate liquidity concerns
- Unfavorable ROIC (4.23%) below WACC
- High debt-to-equity of 1.75
- Low asset turnover ratios
- Unfavorable interest coverage at 1.99
PPL Weaknesses
- Low current (0.86) and quick ratios (0.71) show liquidity pressure
- Unfavorable ROE (6.31%) and ROIC (3.59%) below WACC
- Debt-to-equity at 1.19 is high
- Unfavorable PE ratio at 26.97
- Asset turnover below industry standards
NextEra Energy excels in profitability and scale, benefiting from its large Florida Power & Light segment but faces liquidity and capital efficiency challenges. PPL shows geographic diversification and stable dividend yield but struggles with profitability and liquidity metrics. Both companies must address operational efficiency and leverage risks to strengthen their financial health.
The Moat Duel: Analyzing Competitive Defensibility
A structural moat is the only true shield protecting long-term profits from relentless competitive erosion in capital-intensive sectors like utilities:
NextEra Energy, Inc.: Innovation-Driven Renewable Moat
NextEra’s moat stems from intangible assets and scale in clean energy. It delivers strong gross margins (63%) and rising profitability despite shedding value on ROIC versus WACC. Expansion into battery storage and solar deepens its future moat.
PPL Corporation: Regulated Geographic Focus Moat
PPL leverages regulatory barriers across Kentucky and Pennsylvania, offering stable cash flow. Its margin profile is lower (40% gross margin), and it also sheds value on ROIC, though with modest growth. Geographic regulatory entrenchment limits competition but caps upside.
Verdict: Innovation Moat vs. Regulatory Moat
NextEra’s innovation-driven renewable scale builds a deeper moat than PPL’s geographic regulatory focus. Despite both shedding value versus cost of capital, NextEra’s faster ROIC growth and product expansion better defend future market share.
Which stock offers better returns?
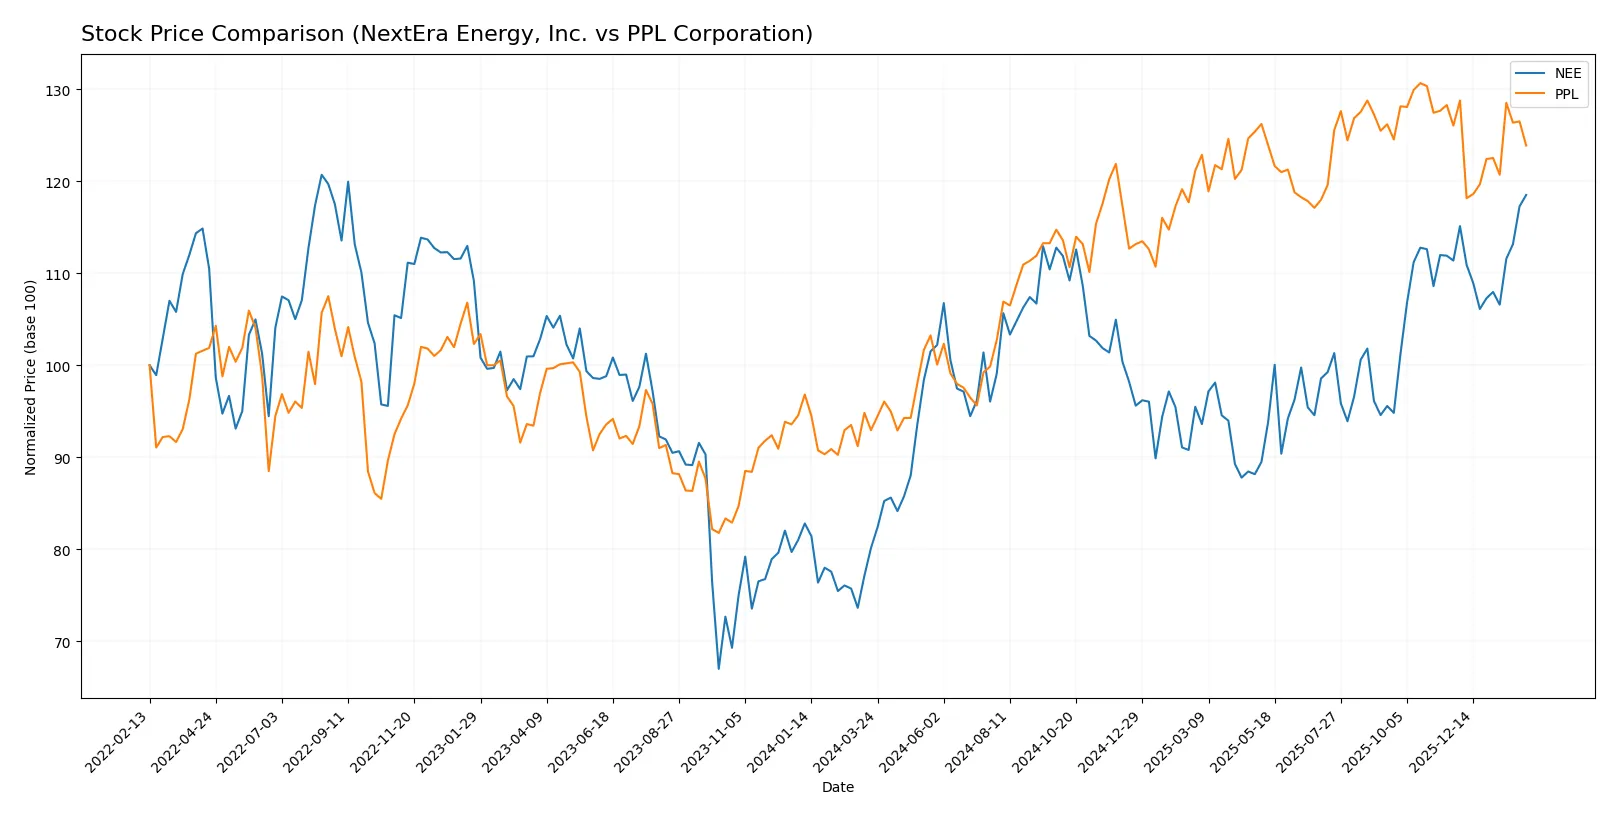
Over the past year, both NextEra Energy and PPL Corporation showed strong price gains, with NextEra demonstrating faster acceleration and higher volatility compared to PPL’s steadier rise.
Trend Comparison
NextEra Energy’s stock rose 47.84% over the past 12 months, marking a bullish trend with accelerating momentum and a high price range between 60.08 and 88.82.
PPL Corporation’s stock gained 33.26% over the same period, also bullish but showing deceleration and lower volatility, with prices ranging from 26.63 to 37.44.
NextEra Energy outperformed PPL with a higher total return and accelerating trend, while PPL’s growth was slower and losing momentum recently.
Target Prices
Analysts present a clear target consensus for NextEra Energy and PPL Corporation, reflecting moderate upside potential.
| Company | Target Low | Target High | Consensus |
|---|---|---|---|
| NextEra Energy, Inc. | 84 | 104 | 93.09 |
| PPL Corporation | 36 | 44 | 40.29 |
NextEra Energy’s target consensus at 93.09 suggests a modest 5% upside from the current 88.82 price. PPL’s 40.29 consensus implies a roughly 13% potential gain versus its 35.5 price.

Don’t Let Luck Decide Your Entry Point
Optimize your entry points with our advanced ProRealTime indicators. You’ll get efficient buy signals with precise price targets for maximum performance. Start outperforming now!
How do institutions grade them?
The following tables summarize recent institutional grades for NextEra Energy, Inc. and PPL Corporation:
NextEra Energy, Inc. Grades
This table shows the latest grades assigned by reputable financial institutions for NextEra Energy, Inc.
| Grading Company | Action | New Grade | Date |
|---|---|---|---|
| Mizuho | Maintain | Neutral | 2026-01-28 |
| Argus Research | Maintain | Buy | 2026-01-28 |
| BMO Capital | Maintain | Outperform | 2026-01-27 |
| Wells Fargo | Maintain | Overweight | 2026-01-20 |
| Barclays | Maintain | Equal Weight | 2026-01-15 |
| Jefferies | Maintain | Hold | 2025-12-31 |
| UBS | Maintain | Buy | 2025-12-17 |
| JP Morgan | Maintain | Overweight | 2025-12-11 |
| BMO Capital | Maintain | Outperform | 2025-12-10 |
| UBS | Maintain | Buy | 2025-12-10 |
PPL Corporation Grades
This table lists recent grades from established financial firms for PPL Corporation.
| Grading Company | Action | New Grade | Date |
|---|---|---|---|
| Barclays | Maintain | Equal Weight | 2026-01-22 |
| Wells Fargo | Maintain | Overweight | 2026-01-20 |
| UBS | Maintain | Neutral | 2025-12-17 |
| Wells Fargo | Maintain | Overweight | 2025-12-12 |
| JP Morgan | Maintain | Overweight | 2025-12-11 |
| BMO Capital | Maintain | Outperform | 2025-10-21 |
| B of A Securities | Maintain | Buy | 2025-10-16 |
| Barclays | Maintain | Equal Weight | 2025-10-14 |
| UBS | Maintain | Neutral | 2025-10-10 |
| Morgan Stanley | Maintain | Overweight | 2025-09-25 |
Which company has the best grades?
NextEra Energy, Inc. consistently receives higher ratings, including multiple Buy and Outperform grades. PPL Corporation’s ratings cluster around Equal Weight and Overweight. This suggests stronger analyst confidence in NextEra’s growth and stability, potentially affecting investor perception and portfolio positioning.
Risks specific to each company
The following categories identify the critical pressure points and systemic threats facing both firms in the 2026 market environment:
1. Market & Competition
NextEra Energy, Inc.
- Dominates in renewable energy with strong capacity and customer base, but faces growing competition in clean tech.
PPL Corporation
- Regional focus limits market size but reduces direct competition; growth constrained by regulated markets.
2. Capital Structure & Debt
NextEra Energy, Inc.
- High debt-to-equity ratio (1.75) and weak interest coverage (1.99) raise financial risk.
PPL Corporation
- Lower debt-to-equity (1.19) and better interest coverage (2.51) suggest more manageable leverage.
3. Stock Volatility
NextEra Energy, Inc.
- Beta 0.76 signals moderate volatility, relatively stable versus market swings.
PPL Corporation
- Slightly lower beta at 0.72 indicates marginally less volatility and risk.
4. Regulatory & Legal
NextEra Energy, Inc.
- Exposed to evolving clean energy regulations which may impact compliance costs.
PPL Corporation
- Faces regulatory scrutiny in both US and UK markets, adding complexity and legal risk.
5. Supply Chain & Operations
NextEra Energy, Inc.
- Large-scale transmission and generation assets pose operational challenges but diversify supply risk.
PPL Corporation
- Smaller, regionally focused operations limit scale but may simplify supply chain management.
6. ESG & Climate Transition
NextEra Energy, Inc.
- Leader in renewable energy investments; well positioned for climate transition.
PPL Corporation
- Progressing in clean energy but lags NextEra in scale and innovation.
7. Geopolitical Exposure
NextEra Energy, Inc.
- Primarily US-focused with limited geopolitical risk.
PPL Corporation
- Exposure to UK market introduces currency and policy risks absent for NextEra.
Which company shows a better risk-adjusted profile?
NextEra Energy’s biggest risk is its stretched capital structure and low liquidity, risking financial distress despite operational scale. PPL’s key risk lies in its limited growth and geopolitical exposure, tempered by more conservative leverage. I observe that PPL’s lower debt and better interest coverage provide a comparatively safer balance sheet. Overall, PPL shows a superior risk-adjusted profile, supported by more manageable financial risk amid market uncertainties.
Final Verdict: Which stock to choose?
NextEra Energy, Inc. (NEE) demonstrates a superpower in scaling revenue and net income robustly, signaling a cash-generating machine despite current capital allocation challenges. Its stretched liquidity ratios are a point of vigilance. NEE suits portfolios aiming for aggressive growth with tolerance for leverage risks.
PPL Corporation (PPL) offers a strategic moat rooted in steady dividend yield and moderate operating efficiency, providing a comparatively safer profile than NEE. However, its slower revenue growth and middling profitability suggest it fits better in Growth at a Reasonable Price (GARP) portfolios seeking income with modest capital appreciation.
If you prioritize strong growth and market momentum, NextEra Energy outshines with accelerating earnings and bullish price trends despite higher leverage. However, if you seek better stability and income consistency, PPL offers a more conservative option with a solid dividend and less volatility. Both carry risks tied to capital structure and profitability, so investor risk tolerance defines the better fit.
Disclaimer: Investment carries a risk of loss of initial capital. The past performance is not a reliable indicator of future results. Be sure to understand risks before making an investment decision.
Go Further
I encourage you to read the complete analyses of NextEra Energy, Inc. and PPL Corporation to enhance your investment decisions: