Home > Comparison > Utilities > NEE vs PNW
The strategic rivalry between NextEra Energy, Inc. and Pinnacle West Capital Corporation shapes the utilities sector’s evolution. NextEra operates as a capital-intensive, clean energy innovator with a diverse power portfolio, while Pinnacle West focuses on regulated electric services primarily in Arizona, blending traditional and renewable sources. This analysis pits NextEra’s growth-driven model against Pinnacle West’s stable regional utility approach to identify which offers superior risk-adjusted returns for a diversified portfolio in 2026.
Table of contents
Companies Overview
NextEra Energy and Pinnacle West Capital stand as key players in the regulated electric utilities sector. Their market footprints reflect distinct scales and regional focuses within the United States.
NextEra Energy, Inc.: Clean Energy Powerhouse
NextEra Energy dominates as a regulated electric utility serving 11 million people across Florida’s east and west coasts. Its core revenue stems from generating and distributing electricity through a diversified portfolio including wind, solar, nuclear, and natural gas. In 2021, the company emphasized expanding long-term contracted clean energy assets, integrating battery storage and electric transmission to strengthen its renewable leadership.
Pinnacle West Capital Corporation: Arizona’s Utility Backbone
Pinnacle West Capital operates primarily in Arizona via Arizona Public Service, serving 1.3 million customers with electricity generated from coal, nuclear, gas, oil, and solar. Its regulated generation capacity of 6,323 MW underpins revenue from retail and wholesale electric services. In recent years, the company has focused on maintaining and upgrading extensive transmission and distribution infrastructure to ensure reliability in a growing desert market.
Strategic Collision: Similarities & Divergences
Both companies share a regulated utility model but differ in scale and strategic emphasis. NextEra pursues a clean energy transition and asset diversification, while Pinnacle West centers on infrastructure resilience within Arizona’s market. Their main battleground is the evolving energy mix amid regulatory shifts. Investors find NextEra offers growth through renewables, whereas Pinnacle West provides a stable, regionally entrenched utility profile.
Income Statement Comparison
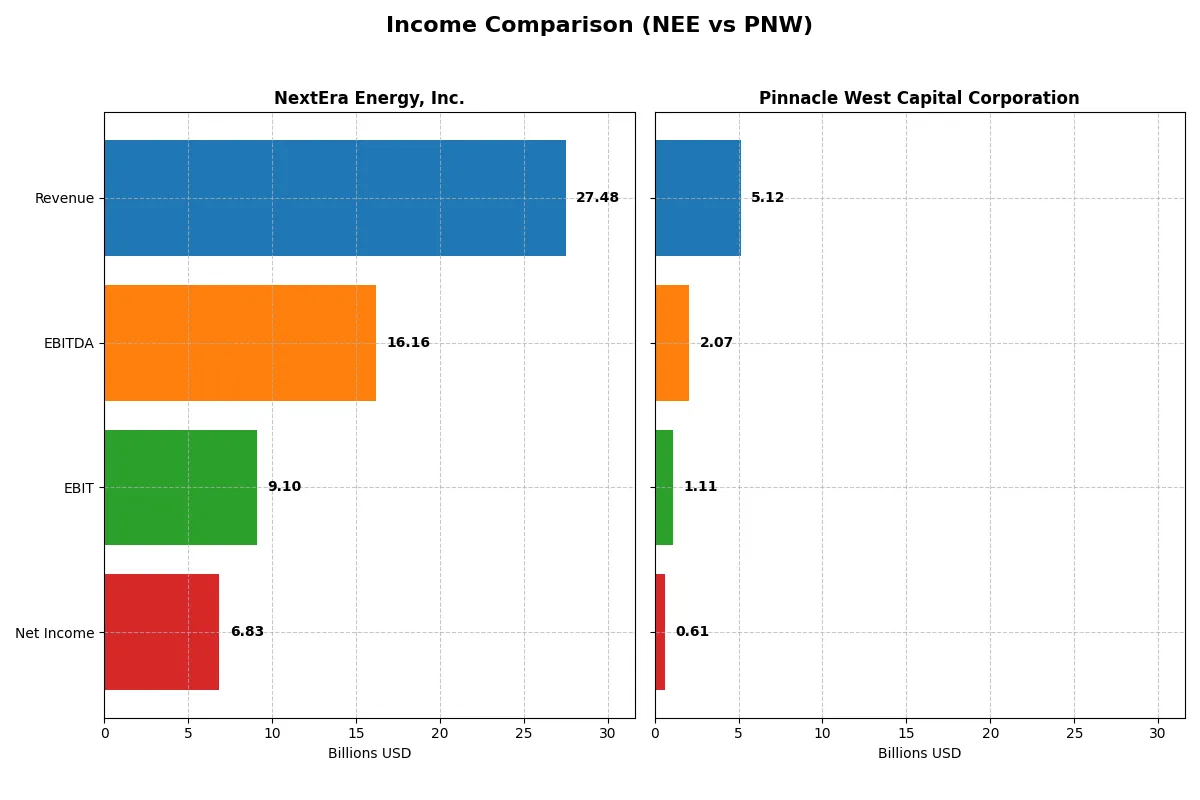
This data dissects the core profitability and scalability of both corporate engines to reveal who dominates the bottom line:
| Metric | NextEra Energy, Inc. (NEE) | Pinnacle West Capital Corporation (PNW) |
|---|---|---|
| Revenue | 27.48B | 5.12B |
| Cost of Revenue | 10.22B | 2.99B |
| Operating Expenses | 8.98B | 1.13B |
| Gross Profit | 17.25B | 2.14B |
| EBITDA | 16.17B | 2.07B |
| EBIT | 9.10B | 1.11B |
| Interest Expense | 4.57B | 377M |
| Net Income | 6.83B | 609M |
| EPS | 3.31 | 5.35 |
| Fiscal Year | 2025 | 2024 |
Income Statement Analysis: The Bottom-Line Duel
The following income statement comparison reveals how efficiently each company converts revenue into profit through cost control and margin management.
NextEra Energy, Inc. Analysis
NextEra Energy’s revenue surged nearly 61% from 2021 to 2025, reaching $27.5B in 2025. Net income grew 91% over the period, though it dipped slightly in 2025 to $6.8B. Gross margin remains robust at 62.8%, and EBIT margin stands at 33.1%, signaling strong operational efficiency despite rising interest expenses. Momentum slowed slightly in net margin and EPS growth last year.
Pinnacle West Capital Corporation Analysis
Pinnacle West’s revenue climbed 43% from 2020 to 2024, hitting $5.1B. Net income rose modestly by 11%, with 2024 net income at $609M. Gross margin at 41.7% and EBIT margin at 21.7% reflect solid cost management. Unlike NextEra, Pinnacle West improved net margin by 11.2% last year, alongside an 18.8% EPS increase, showing accelerating profitability momentum.
Margin Strength vs. Growth Velocity
NextEra Energy dominates in scale and margin strength, generating higher absolute profits and maintaining superior gross and EBIT margins. Pinnacle West impresses with faster recent improvements in net margin and EPS growth, though from a smaller base. Investors seeking large-scale margin power may prefer NextEra, while those favoring faster earnings momentum might lean toward Pinnacle West’s profile.
Financial Ratios Comparison
These vital ratios act as a diagnostic tool to expose the underlying fiscal health, valuation premiums, and capital efficiency of the companies analyzed:
| Ratios | NextEra Energy, Inc. (NEE) | Pinnacle West Capital Corporation (PNW) |
|---|---|---|
| ROE | 12.5% | 9.0% |
| ROIC | 4.2% | 3.5% |
| P/E | 24.5 | 15.9 |
| P/B | 3.07 | 1.43 |
| Current Ratio | 0.60 | 0.59 |
| Quick Ratio | 0.49 | 0.42 |
| D/E | 1.75 | 1.64 |
| Debt-to-Assets | 45.0% | 42.3% |
| Interest Coverage | 1.81 | 2.68 |
| Asset Turnover | 0.13 | 0.20 |
| Fixed Asset Turnover | 0.18 | 0.25 |
| Payout ratio | 68.5% | 64.8% |
| Dividend yield | 2.79% | 4.09% |
| Fiscal Year | 2025 | 2024 |
Efficiency & Valuation Duel: The Vital Signs
Financial ratios act as a company’s DNA, revealing hidden risks and operational excellence critical for investment decisions.
NextEra Energy, Inc.
NextEra Energy shows a solid net margin of 24.87% and a neutral ROE at 12.51%, indicating decent profitability. Its P/E ratio of 24.54 suggests a fairly valued stock but a high price-to-book of 3.07 signals a stretched valuation. The 2.79% dividend yield rewards shareholders, balancing reinvestment needs in capital-intensive operations.
Pinnacle West Capital Corporation
Pinnacle West delivers a favorable net margin of 11.88% but an unfavorable ROE of 9.01%, reflecting weaker profitability. Its P/E of 15.85 is neutral and the P/B ratio of 1.43 appears more reasonable, suggesting undervaluation relative to equity. The 4.09% dividend yield offers stronger income, though reinvestment appears limited amid moderate growth.
Valuation Discipline vs. Dividend Income Focus
NextEra’s higher valuation and ROE contrast with Pinnacle West’s cheaper price and superior dividend yield. NextEra balances growth with shareholder returns, while Pinnacle West appeals to income-focused investors seeking value. The choice depends on risk appetite and preference for growth versus income stability.
Which one offers the Superior Shareholder Reward?
I see NextEra Energy (NEE) offers a 2.8% dividend yield with a high 68% payout ratio, straining free cash flow, which is negative at -5.8/share in 2025. Its buyback program remains modest. Pinnacle West (PNW) yields 4.1%, with a 65% payout ratio and negative free cash flow around -5.6/share, signaling buybacks are limited. NEE reinvests more aggressively in growth, reflected in its higher margins and capex per share (12 vs. 20 for PNW), but PNW’s higher dividend yield offers immediate income. Considering payout sustainability and reinvestment, I judge NEE’s balanced approach superior for total returns in 2026.
Comparative Score Analysis: The Strategic Profile
The radar chart reveals the fundamental DNA and trade-offs of NextEra Energy and Pinnacle West Capital, highlighting their financial strengths and valuation perspectives:
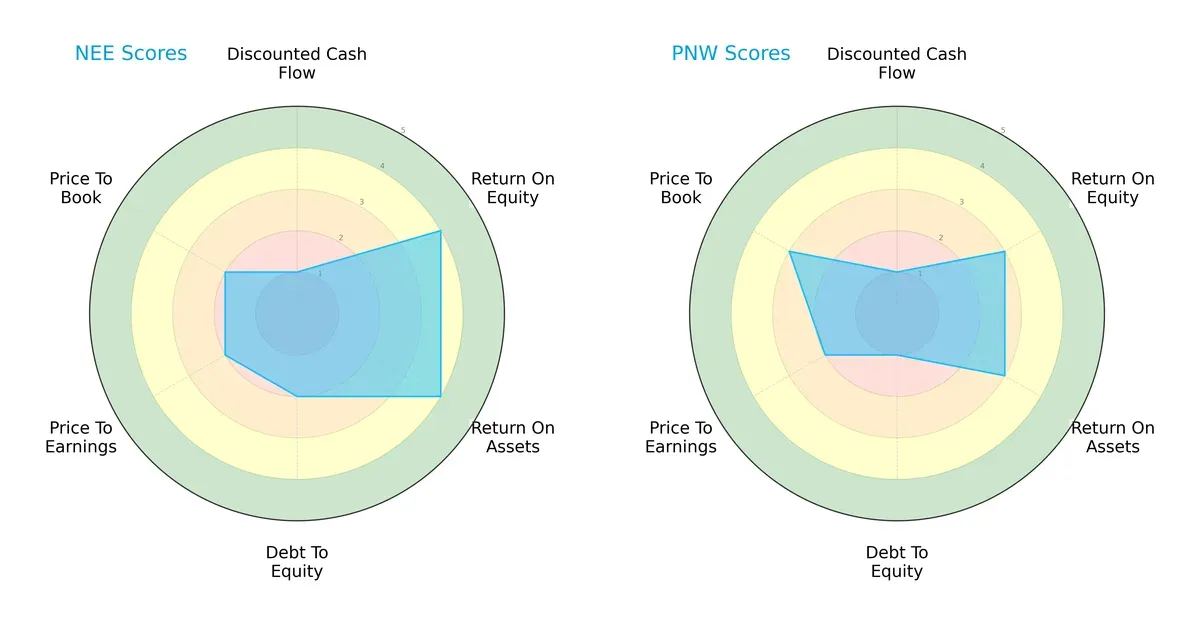
NextEra Energy shows a more balanced profile with higher scores in ROE (4 vs. 3) and ROA (4 vs. 3), indicating superior operational efficiency. Pinnacle West leans on a slightly better Price-to-Book score (3 vs. 2), suggesting modest valuation appeal. Both firms share weak discounted cash flow scores (1). NextEra’s moderate debt-to-equity score (2) beats Pinnacle West’s weaker position (1), signaling more prudent leverage management.
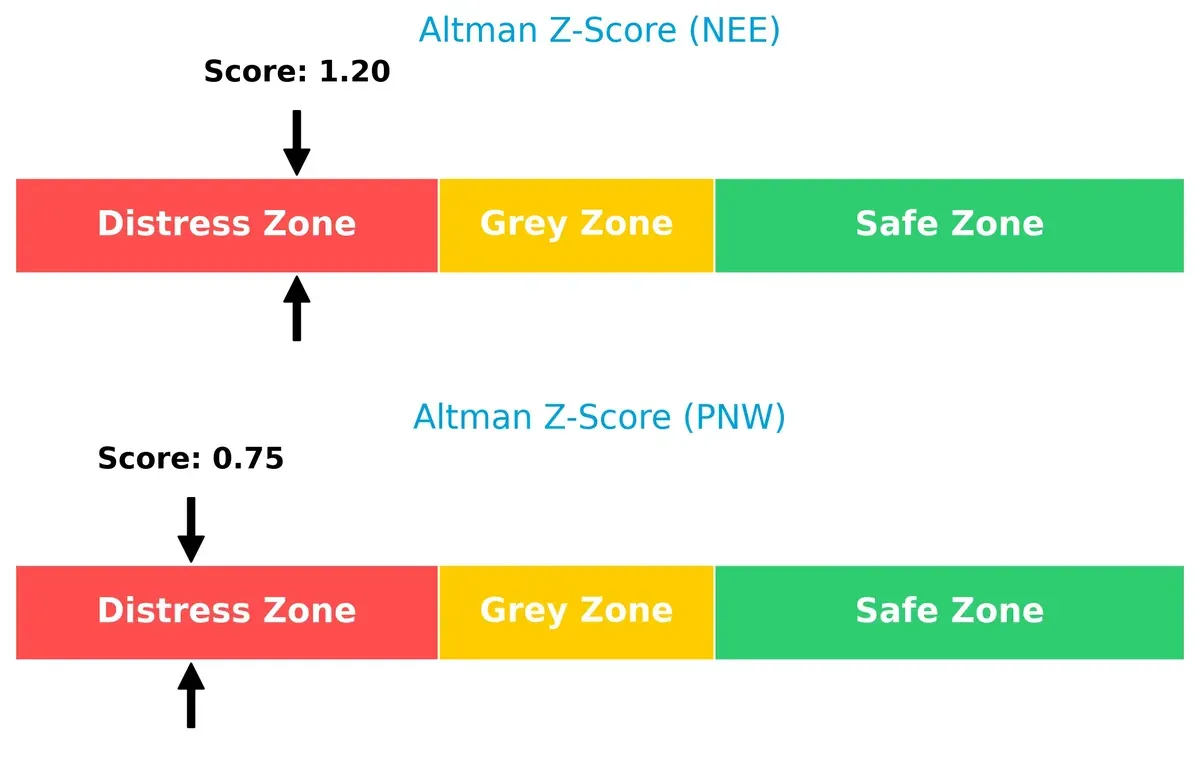
Bankruptcy Risk: Solvency Showdown
NextEra Energy’s Altman Z-Score (1.20) outperforms Pinnacle West (0.75), yet both sit in the distress zone, implying elevated bankruptcy risk in this cycle:
Financial Health: Quality of Operations
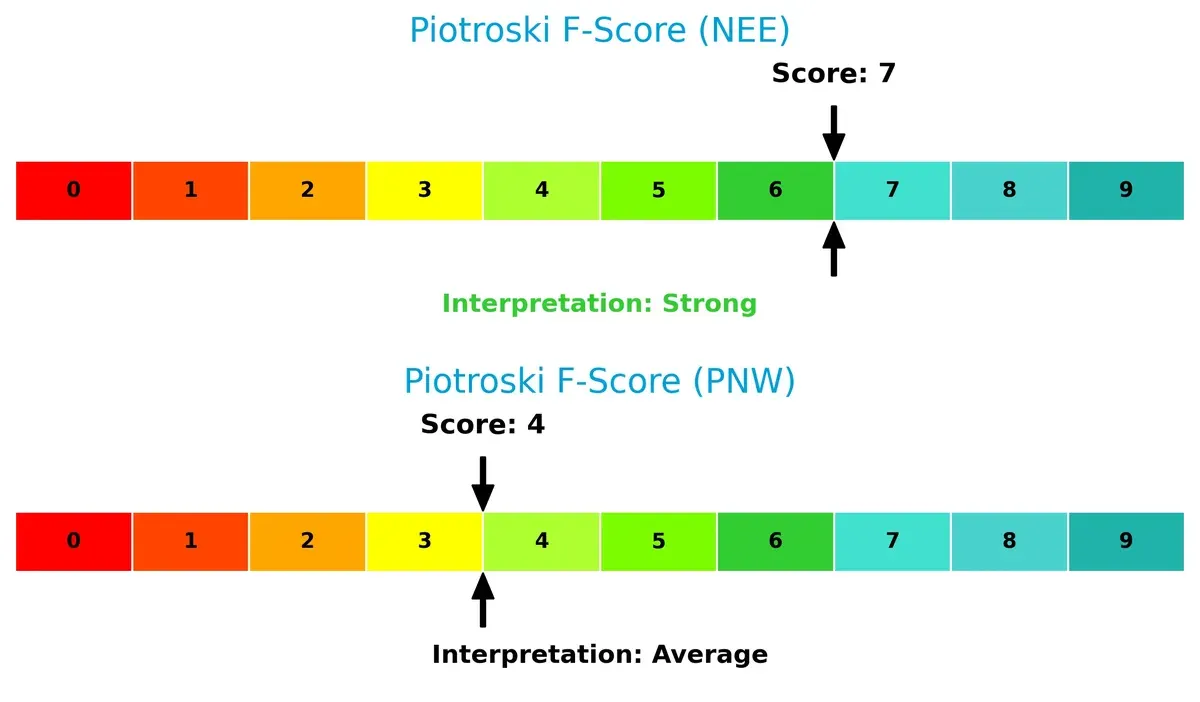
NextEra Energy’s Piotroski F-Score of 7 signals strong operational health, while Pinnacle West’s score of 4 flags average financial quality and potential internal weaknesses:
How are the two companies positioned?
This section dissects the operational DNA of NextEra Energy and Pinnacle West by comparing their revenue distribution and internal strengths and weaknesses. The goal is to confront their economic moats to identify which model offers the most resilient, sustainable competitive advantage today.
Revenue Segmentation: The Strategic Mix
This visual comparison dissects how NextEra Energy, Inc. and Pinnacle West Capital Corporation diversify income streams and where their primary sector bets lie:
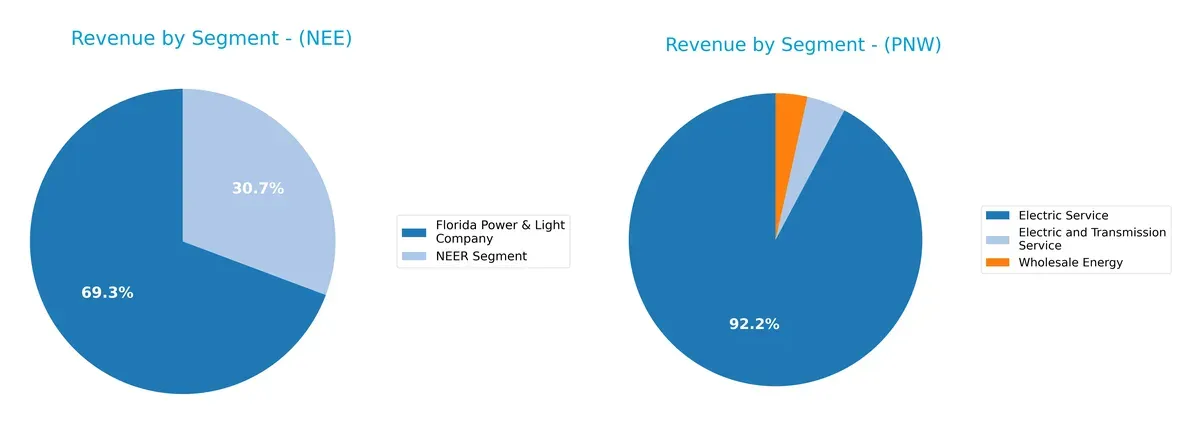
NextEra Energy anchors revenue in Florida Power & Light with $17B, complemented by $7.5B from NEER, showing moderate diversification. Pinnacle West Capital relies heavily on Electric Service at $2.56B, with smaller contributions from Electric and Transmission Service and Wholesale Energy. NextEra’s mix signals ecosystem lock-in and scale advantages, while Pinnacle West’s concentration suggests higher exposure to sector-specific risks.
Strengths and Weaknesses Comparison
This table compares the Strengths and Weaknesses of NextEra Energy, Inc. and Pinnacle West Capital Corporation:
NextEra Energy Strengths
- Higher net margin at 24.87% indicating strong profitability
- Favorable WACC at 6.52% supporting efficient capital cost
- Larger revenue base driven by Florida Power & Light segment
- Dividend yield at 2.79% offers steady income
Pinnacle West Strengths
- Favorable net margin at 11.88% ensures profitability
- Lower WACC at 4.79% reduces capital expense
- Favorable PB ratio at 1.43 indicates undervaluation
- Higher dividend yield at 4.09% enhancing investor returns
NextEra Energy Weaknesses
- Unfavorable ROIC at 4.23% below WACC signals weak capital efficiency
- Low current ratio 0.6 and quick ratio 0.49 suggest liquidity risks
- High debt-to-equity 1.75 and low interest coverage 1.99 risk financial strain
- Unfavorable asset turnover 0.13 implies lower operational efficiency
Pinnacle West Weaknesses
- Unfavorable ROE at 9.01% below benchmark
- Low current ratio 0.59 and quick ratio 0.42 raise liquidity concerns
- Elevated debt-to-equity 1.64 signals leverage risks
- Unfavorable asset turnover 0.20 limits asset utilization effectiveness
Both companies show strengths in profitability and dividend yield but face liquidity and capital efficiency challenges. This balance impacts their strategic focus on improving operational efficiency and managing financial risk.
The Moat Duel: Analyzing Competitive Defensibility
A structural moat is the only shield protecting long-term profits from relentless competitive erosion. Let’s dissect how these firms defend their turf:
NextEra Energy, Inc.: Renewable Innovation and Scale Moat
NextEra’s moat stems from its massive renewable asset base and long-term contracts, reflected in stable 33% EBIT margins. Its growing ROIC hints at deepening competitive defenses via new clean energy projects in 2026.
Pinnacle West Capital Corporation: Regional Regulatory Moat
Pinnacle West leverages a regulated Arizona market with steady cash flow but weaker margin profiles than NextEra. Declining ROIC signals rising challenges, though expansion into solar could offer some upside.
Market Dominance vs. Regulatory Stronghold: The Moat Clash
NextEra’s broader, innovation-driven moat outpaces Pinnacle West’s narrow regulatory moat. Its improving profitability positions it better to defend market share against emerging energy disruptors.
Which stock offers better returns?
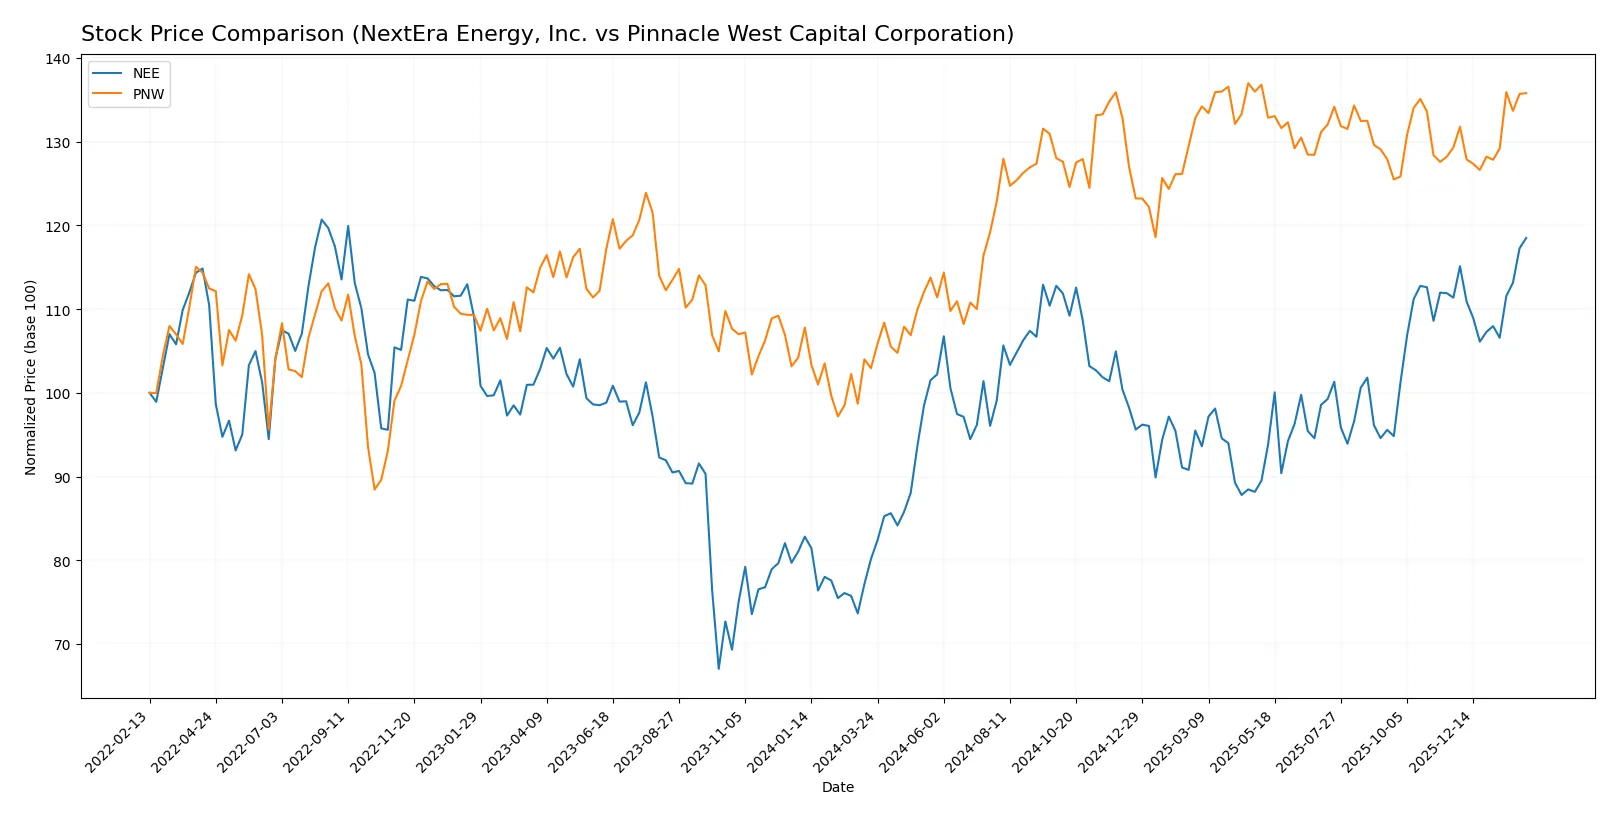
The past year showed strong upward momentum for both stocks, with NextEra Energy accelerating its gains more sharply than Pinnacle West Capital.
Trend Comparison
NextEra Energy, Inc. (NEE) posted a 47.84% price increase over the past 12 months, reflecting a bullish trend with acceleration and a high volatility of 6.34%. The stock ranged between 60.08 and 88.82.
Pinnacle West Capital Corporation (PNW) delivered a 31.91% gain over the same period, also bullish with acceleration and slightly lower volatility at 6.11%. Its price fluctuated between 70.98 and 94.45.
NEE outperformed PNW with a higher total return and stronger acceleration, despite similar volatility levels, marking it as the superior market performer over 12 months.
Target Prices
Analysts present a cautiously optimistic consensus on these regulated electric utilities.
| Company | Target Low | Target High | Consensus |
|---|---|---|---|
| NextEra Energy, Inc. | 84 | 104 | 93.09 |
| Pinnacle West Capital Corporation | 85 | 115 | 96.11 |
The target consensus for NextEra Energy sits about 5% above the current 88.82 stock price, signaling moderate upside. Pinnacle West’s consensus target exceeds its 93.63 price by roughly 3%, reflecting steady confidence.

Don’t Let Luck Decide Your Entry Point
Optimize your entry points with our advanced ProRealTime indicators. You’ll get efficient buy signals with precise price targets for maximum performance. Start outperforming now!
How do institutions grade them?
Here is a summary of the latest institutional grades for NextEra Energy, Inc. and Pinnacle West Capital Corporation:
NextEra Energy, Inc. Grades
The table below lists recent grades from reputable financial institutions for NextEra Energy, Inc.:
| Grading Company | Action | New Grade | Date |
|---|---|---|---|
| Mizuho | maintain | Neutral | 2026-01-28 |
| Argus Research | maintain | Buy | 2026-01-28 |
| BMO Capital | maintain | Outperform | 2026-01-27 |
| Wells Fargo | maintain | Overweight | 2026-01-20 |
| Barclays | maintain | Equal Weight | 2026-01-15 |
| Jefferies | maintain | Hold | 2025-12-31 |
| UBS | maintain | Buy | 2025-12-17 |
| JP Morgan | maintain | Overweight | 2025-12-11 |
| BMO Capital | maintain | Outperform | 2025-12-10 |
| UBS | maintain | Buy | 2025-12-10 |
Pinnacle West Capital Corporation Grades
The following table shows recent grades from recognized institutions for Pinnacle West Capital Corporation:
| Grading Company | Action | New Grade | Date |
|---|---|---|---|
| Wells Fargo | maintain | Equal Weight | 2026-01-20 |
| Barclays | maintain | Equal Weight | 2026-01-15 |
| UBS | maintain | Neutral | 2025-12-17 |
| Keybanc | downgrade | Sector Weight | 2025-12-12 |
| Keybanc | maintain | Overweight | 2025-10-15 |
| UBS | maintain | Neutral | 2025-10-10 |
| Barclays | maintain | Equal Weight | 2025-10-07 |
| Argus Research | maintain | Buy | 2025-09-30 |
| Morgan Stanley | maintain | Equal Weight | 2025-09-25 |
| UBS | maintain | Neutral | 2025-09-12 |
Which company has the best grades?
NextEra Energy, Inc. consistently receives higher grades, including multiple Buy and Outperform ratings. Pinnacle West Capital shows more Neutral and Equal Weight grades, with one downgrade. This suggests stronger institutional confidence in NextEra, potentially impacting investor sentiment and valuation positively.
Risks specific to each company
The following categories identify critical pressure points and systemic threats facing NextEra Energy, Inc. and Pinnacle West Capital Corporation in the 2026 market environment:
1. Market & Competition
NextEra Energy, Inc.
- Large scale renewables push market leadership but faces intense competition in clean energy.
Pinnacle West Capital Corporation
- Regional focus limits market share but reduces exposure to national competitors.
2. Capital Structure & Debt
NextEra Energy, Inc.
- High debt-to-equity ratio (1.75) and low interest coverage (1.99) signal financial leverage risk.
Pinnacle West Capital Corporation
- Slightly lower debt-to-equity (1.64) but weaker debt coverage raises moderate financial risk concerns.
3. Stock Volatility
NextEra Energy, Inc.
- Beta of 0.76 indicates moderate sensitivity to market swings, offering some downside protection.
Pinnacle West Capital Corporation
- Lower beta (0.55) shows more defensive stock behavior but possibly lower upside potential.
4. Regulatory & Legal
NextEra Energy, Inc.
- Exposure to evolving renewable mandates and carbon regulations requires proactive compliance and adaptation.
Pinnacle West Capital Corporation
- Arizona-centric operations face state regulatory shifts, but less complexity than multi-state rivals.
5. Supply Chain & Operations
NextEra Energy, Inc.
- Extensive transmission lines and renewable assets increase operational complexity and supply chain vulnerability.
Pinnacle West Capital Corporation
- Smaller scale and regional infrastructure reduce supply chain risks but limit operational agility.
6. ESG & Climate Transition
NextEra Energy, Inc.
- Leading in clean energy projects positions the firm well but demands high capital expenditure and innovation.
Pinnacle West Capital Corporation
- Moderate renewable integration speeds climate risk mitigation but lags industry leaders in ESG momentum.
7. Geopolitical Exposure
NextEra Energy, Inc.
- Concentration in US markets lowers geopolitical risk but exposes to domestic policy shifts and natural disasters.
Pinnacle West Capital Corporation
- Similar domestic focus with geographic concentration in Arizona, vulnerable to regional risks like drought.
Which company shows a better risk-adjusted profile?
NextEra Energy faces significant capital structure and operational risks despite its leadership in renewables. Pinnacle West’s lower volatility and more conservative debt profile offer a slightly better risk-adjusted stance. However, both companies sit in the financial distress zone by Altman Z-score, with NextEra showing stronger profitability but more leveraged risk. The elevated debt and weak liquidity ratios for both firms highlight the need for cautious capital allocation in this sector.
Final Verdict: Which stock to choose?
NextEra Energy’s superpower lies in its robust revenue growth and expanding profitability, signaling a strong operational momentum. Yet, its stretched liquidity ratios and heavy debt load remain points of vigilance. It suits investors targeting aggressive growth with a tolerance for capital structure risks.
Pinnacle West Capital offers a strategic moat through steady cash flow and a more conservative valuation profile. Its dividends and moderate leverage present a comparatively safer choice, fitting well within GARP (Growth at a Reasonable Price) strategies that balance growth and risk.
If you prioritize dynamic growth and market leadership, NextEra Energy outshines due to its accelerating revenue and income trends despite financial leverage concerns. However, if you seek better financial stability and income consistency, Pinnacle West offers superior risk management and dividend yield. Each appeals to distinct investor profiles with differing risk appetites.
Disclaimer: Investment carries a risk of loss of initial capital. The past performance is not a reliable indicator of future results. Be sure to understand risks before making an investment decision.
Go Further
I encourage you to read the complete analyses of NextEra Energy, Inc. and Pinnacle West Capital Corporation to enhance your investment decisions: