Home > Comparison > Utilities > NEE vs PCG
The strategic rivalry between NextEra Energy, Inc. and Pacific Gas & Electric Co. shapes the utilities sector’s direction. NextEra operates as a capital-intensive, diversified clean energy powerhouse, while Pacific Gas & Electric focuses on regulated electric and natural gas distribution in California. This analysis pits NextEra’s growth-driven clean energy model against Pacific Gas & Electric’s stable regional utility framework to identify the superior risk-adjusted investment for diversified portfolios.

Table of contents
Companies Overview
NextEra Energy and Pacific Gas & Electric Co. stand as pivotal players in the regulated electric utility sector.
NextEra Energy, Inc.: Leader in Clean Energy Generation
NextEra Energy dominates the regulated electric market with 28,564 MW net generating capacity and a diverse fuel mix including wind, solar, nuclear, and natural gas. Its core revenue derives from generating, transmitting, and distributing electricity to 11M customers, focusing heavily on renewable energy and battery storage assets in 2021. This strategic emphasis strengthens its competitive edge in clean energy solutions.
Pacific Gas & Electric Co.: California’s Energy Provider
Pacific Gas & Electric serves northern and central California with electricity and natural gas, leveraging nuclear, hydroelectric, fossil fuels, and photovoltaics. Its business centers on regulated delivery to residential and industrial customers, supplemented by innovation in smart grid technology like the microgrid backup power transfer meter. In 2021, it prioritized integrating these solutions within its existing electric SmartMeter system.
Strategic Collision: Similarities & Divergences
Both companies operate within regulated utilities but diverge in scale and innovation focus. NextEra pursues renewable generation and storage, while Pacific Gas emphasizes smart grid integration for reliability. Their battleground is customer base expansion and grid modernization amid decarbonization trends. Investment profiles differ: NextEra’s growth hinges on clean energy scale, Pacific Gas’s on infrastructure resilience and customer technology adoption.
Income Statement Comparison
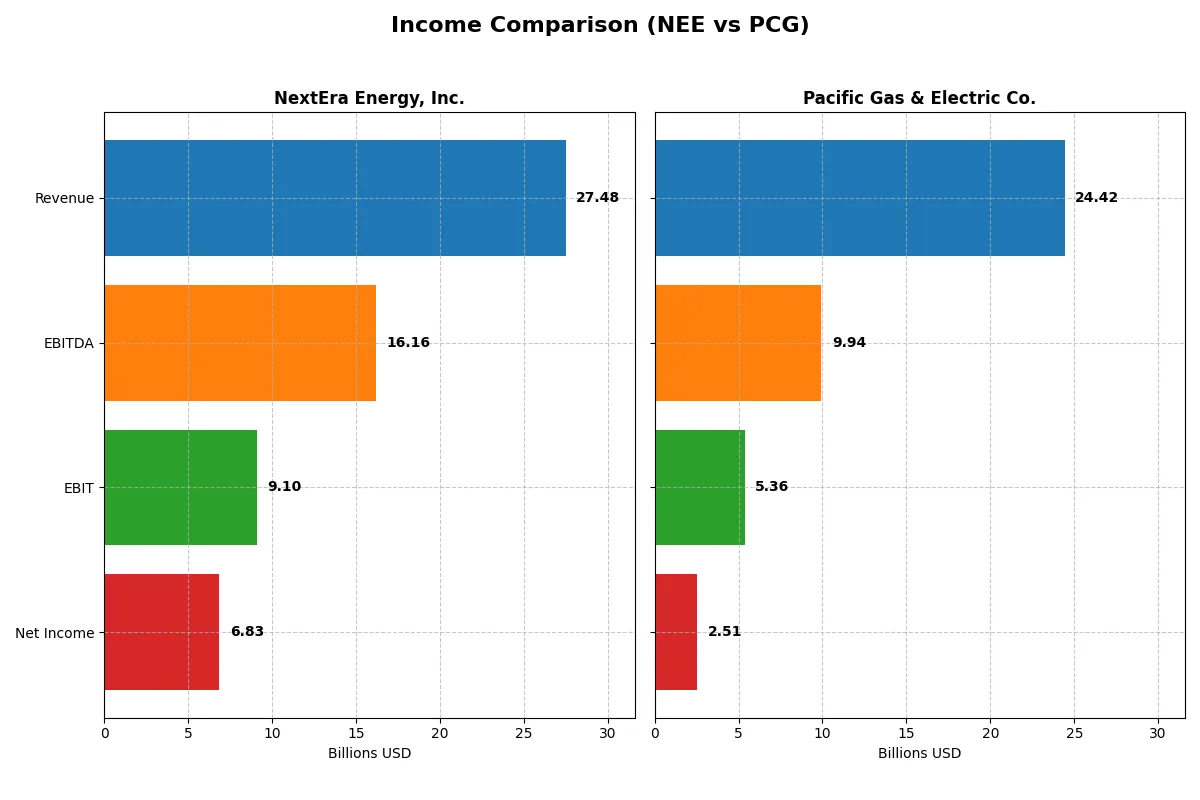
This data dissects the core profitability and scalability of both corporate engines to reveal who dominates the bottom line:
| Metric | NextEra Energy, Inc. (NEE) | Pacific Gas & Electric Co. (PCG) |
|---|---|---|
| Revenue | 27.48B | 24.42B |
| Cost of Revenue | 10.22B | 15.26B |
| Operating Expenses | 8.98B | 4.70B |
| Gross Profit | 17.26B | 9.16B |
| EBITDA | 16.17B | 9.94B |
| EBIT | 9.10B | 5.36B |
| Interest Expense | 4.57B | 3.05B |
| Net Income | 6.83B | 2.47B |
| EPS | 3.31 | 1.16 |
| Fiscal Year | 2025 | 2024 |
Income Statement Analysis: The Bottom-Line Duel
This income statement comparison exposes the true efficiency and profitability of each company’s corporate engine over recent years.
NextEra Energy, Inc. Analysis
NextEra Energy’s revenue climbed steadily from 17B in 2021 to 27.5B in 2025, with net income surging from 3.57B to 6.83B. Its gross margin remains robust near 63%, while net margin hovers around 25%, signaling strong cost control. Despite a slight net margin dip in 2025, the company sustains impressive earnings momentum and operational efficiency.
Pacific Gas & Electric Co. Analysis
Pacific Gas & Electric’s revenue plateaued around 24B from 2023 to 2024, while net income improved from 2.25B to 2.51B. Gross margin stayed modest at 37.5%, but net margin expanded to just over 10%. The firm’s sharp net income growth and margin improvement reflect recovery and operational tightening after previous volatility, though revenue growth remains sluggish.
Margin Strength vs. Earnings Growth
NextEra Energy outpaces Pacific Gas & Electric on revenue scale and margin dominance, boasting nearly double the net margin. However, Pacific Gas & Electric exhibits faster net income and margin growth from a lower base. For investors, NextEra represents stable high-margin profits, while Pacific Gas & Electric offers a turnaround story with accelerating earnings momentum.
Financial Ratios Comparison
These vital ratios act as a diagnostic tool to expose the underlying fiscal health, valuation premiums, and capital efficiency of the companies analyzed:
| Ratios | NextEra Energy, Inc. (NEE) | Pacific Gas & Electric Co. (PCG) |
|---|---|---|
| ROE | 12.5% | 8.3% |
| ROIC | 4.2% | 3.7% |
| P/E | 24.5 | 17.2 |
| P/B | 3.07 | 1.43 |
| Current Ratio | 0.60 | 1.05 |
| Quick Ratio | 0.49 | 1.00 |
| D/E (Debt-to-Equity) | 1.75 | 1.94 |
| Debt-to-Assets | 45.0% | 43.7% |
| Interest Coverage | 1.81 | 1.46 |
| Asset Turnover | 0.13 | 0.18 |
| Fixed Asset Turnover | 0.18 | 0.28 |
| Payout ratio | 68.5% | 3.4% |
| Dividend yield | 2.79% | 0.20% |
| Fiscal Year | 2025 | 2024 |
Efficiency & Valuation Duel: The Vital Signs
Financial ratios act as a company’s DNA, unveiling hidden risks and operational strengths behind surface-level numbers.
NextEra Energy, Inc.
NextEra Energy shows solid profitability with a 12.5% ROE and a strong 24.9% net margin, signaling operational efficiency. Its P/E of 24.5 suggests a fairly valued stock, though a high P/B ratio of 3.07 marks some overvaluation. The 2.79% dividend yield rewards shareholders amid moderate leverage and below-average liquidity.
Pacific Gas & Electric Co.
Pacific Gas & Electric posts a lower 8.3% ROE and 10.3% net margin, reflecting modest profitability. The P/E of 17.2 appears reasonable, supported by a lower 1.43 P/B ratio, indicating undervaluation relative to book value. However, the minimal 0.2% dividend yield and slightly better liquidity signal cautious capital returns and operational constraints.
Premium Valuation vs. Operational Safety
NextEra Energy balances higher profitability and shareholder returns against stretched valuation and weak liquidity. Pacific Gas & Electric trades at a discount with lower profitability but maintains better liquidity and valuation metrics. Investors prioritizing stable dividends and efficiency may lean toward NextEra, while those favoring valuation safety might prefer Pacific Gas & Electric.
Which one offers the Superior Shareholder Reward?
NextEra Energy (NEE) offers a superior shareholder reward compared to Pacific Gas & Electric (PCG). NEE delivers a healthy 2.8% dividend yield with a sustainable 61% payout ratio, backed by positive free cash flow of 2.3B in 2024. Its aggressive buyback program further boosts returns. PCG’s dividend yield is negligible at 0.2%, with a minimal 3% payout ratio and negative free cash flow, signaling weak distribution sustainability. NEE’s robust cash flow coverage and balanced capital allocation create a more attractive total return profile for 2026 investors.
Comparative Score Analysis: The Strategic Profile
The radar chart reveals the fundamental DNA and trade-offs of NextEra Energy, Inc. and Pacific Gas & Electric Co., highlighting their distinct financial strengths and vulnerabilities:
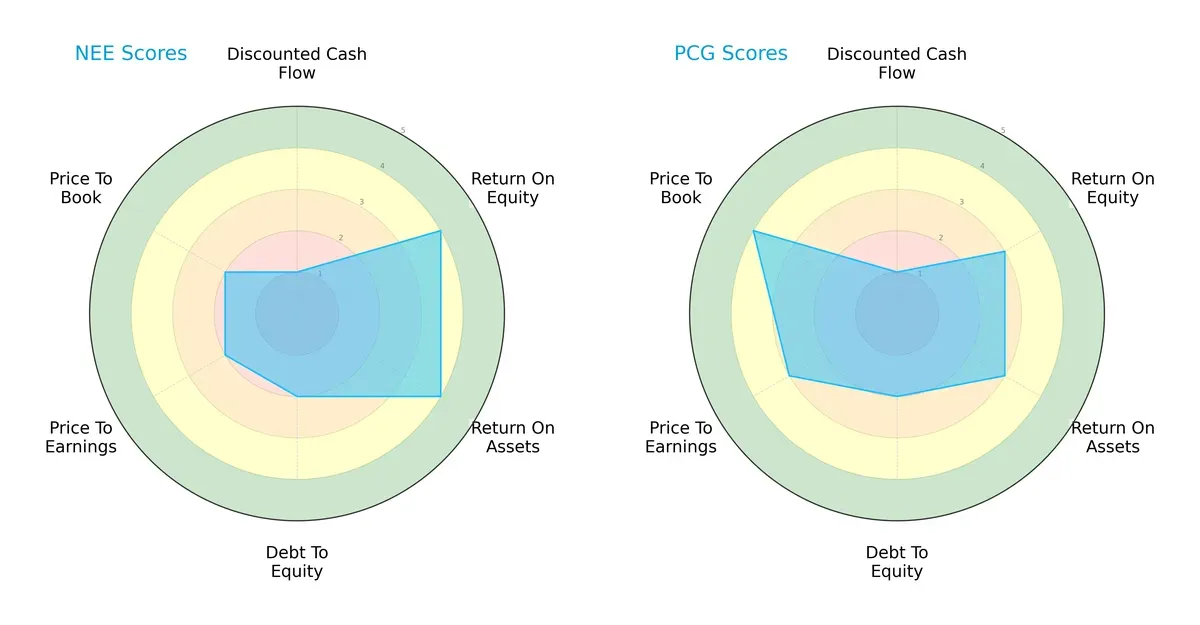
NextEra Energy leads in profitability metrics with higher ROE (4 vs. 3) and ROA (4 vs. 3) scores, indicating superior asset and equity efficiency. Both firms share weak DCF scores (1), signaling valuation concerns. Pacific Gas & Electric holds a valuation edge with better P/E (3 vs. 2) and P/B (4 vs. 2) scores, reflecting relatively more attractive market pricing. Debt-to-equity profiles are identical (2), suggesting similar leverage risk. Overall, NextEra shows a more balanced operational performance, while Pacific Gas & Electric relies more on valuation appeal.
Bankruptcy Risk: Solvency Showdown
The Altman Z-Score comparison underscores a critical solvency gap:
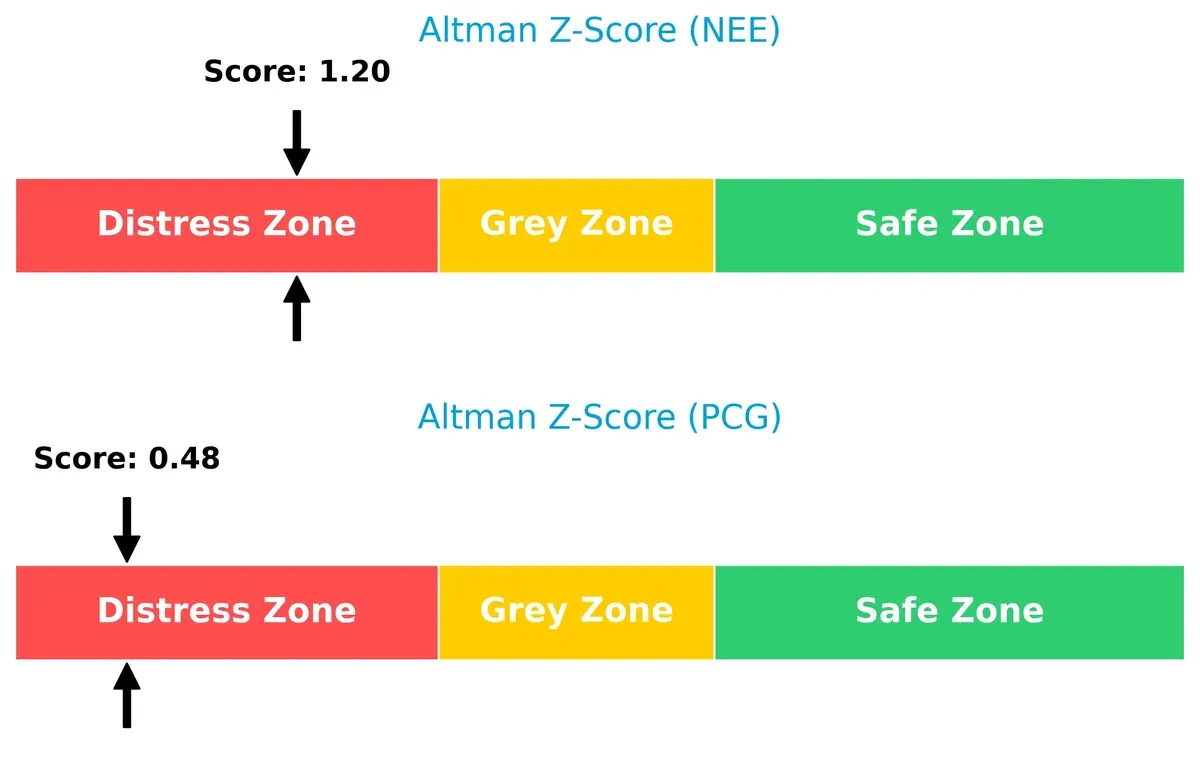
Both companies reside in the distress zone, but NextEra’s 1.20 score surpasses Pacific Gas & Electric’s 0.48, indicating a marginally stronger buffer against bankruptcy risks. Historically, firms below 1.8 face significant survival challenges, so investors must weigh these red flags carefully.
Financial Health: Quality of Operations
Piotroski F-Score analysis reveals operational robustness differences:
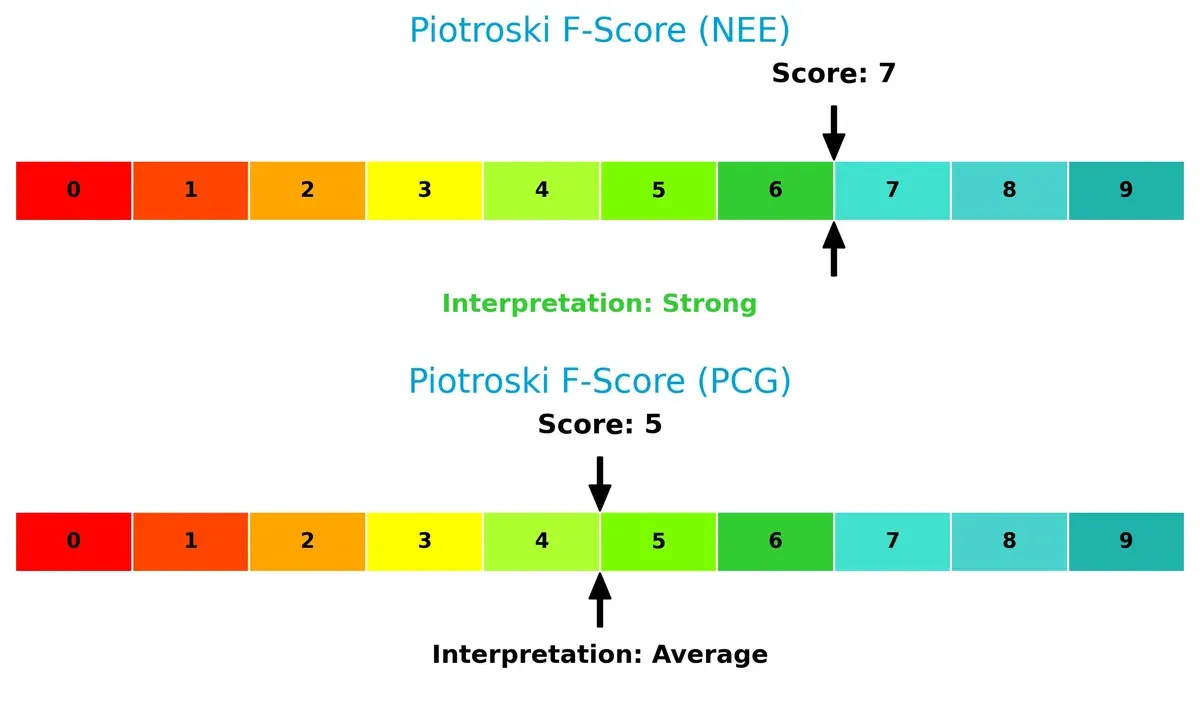
NextEra’s score of 7 signals strong financial health, reflecting solid profitability and operational efficiency. Pacific Gas & Electric’s 5 marks average health, suggesting caution due to weaker internal metrics. This disparity highlights NextEra’s superior internal quality and risk management.
How are the two companies positioned?
This section dissects the operational DNA of NextEra Energy and Pacific Gas & Electric by comparing their revenue distribution and internal dynamics. The final goal is to confront their economic moats to reveal which model offers the most resilient competitive advantage today.
Revenue Segmentation: The Strategic Mix
This comparison dissects how NextEra Energy and Pacific Gas & Electric diversify income streams and reveals their primary sector bets:
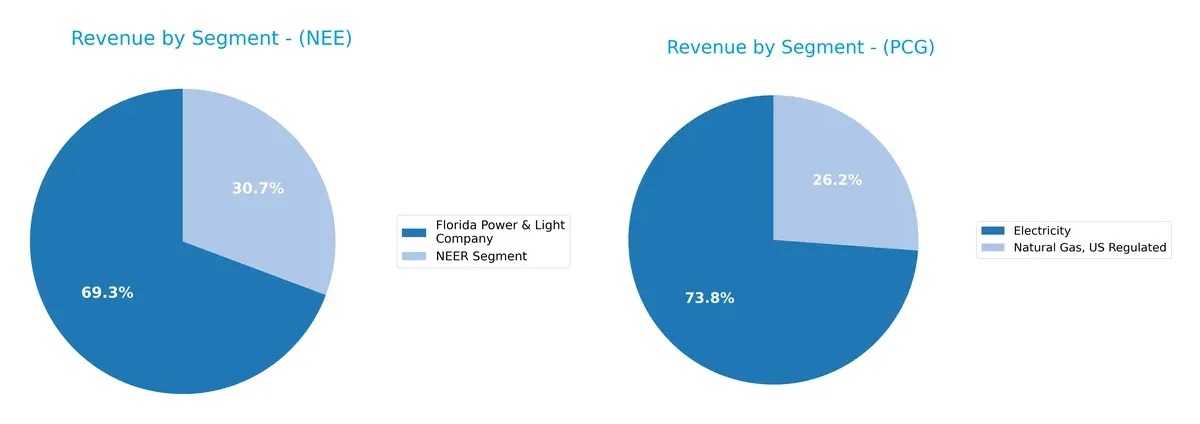
NextEra Energy anchors revenue in its Florida Power & Light segment at $17B, with NextEra Energy Resources contributing $7.5B, showing moderate diversification. Pacific Gas & Electric leans heavily on electricity at $18.6B, with natural gas at $6.6B. PG&E’s mix concentrates on energy delivery, raising regulatory and infrastructure risk. NextEra’s dual-segment approach supports resilience and ecosystem lock-in in renewable and utility domains.
Strengths and Weaknesses Comparison
This table compares the Strengths and Weaknesses of NextEra Energy, Inc. and Pacific Gas & Electric Co.:
NextEra Energy, Inc. Strengths
- Higher net margin at 24.87%
- Favorable dividend yield at 2.79%
- Broad diversification with multiple energy segments
Pacific Gas & Electric Co. Strengths
- Favorable net margin at 10.29%
- Stronger liquidity ratios including quick ratio at 1.0
- Lower price-to-book ratio indicating potential undervaluation
NextEra Energy, Inc. Weaknesses
- Low current and quick ratios below 1
- High debt-to-equity at 1.75
- Unfavorable ROIC below WACC at 4.23% vs 6.52% WACC
- Low asset turnover metrics indicating capital inefficiency
Pacific Gas & Electric Co. Weaknesses
- Moderate debt-to-equity at 1.94
- Unfavorable ROIC below WACC at 3.67% vs 4.69% WACC
- Low interest coverage near 1.76
- Very low dividend yield at 0.2%
NextEra shows superior profitability but struggles with liquidity and capital efficiency. Pacific Gas benefits from better liquidity and valuation metrics but faces challenges in profitability and capital returns. These contrasts highlight different financial strategies and operational focuses.
The Moat Duel: Analyzing Competitive Defensibility
A structural moat is the only reliable shield protecting long-term profits from relentless competitive erosion in regulated electric utilities:
NextEra Energy, Inc. (NEE): Innovation-Driven Renewable Moat
NextEra’s primary moat lies in intangible assets tied to renewable energy and long-term contracts. Its high gross margin (63%) and stable EBIT margin (33%) reflect operational efficiency. Growing ROIC signals improving profitability, though still below WACC. Expansion in battery storage and transmission projects could deepen this moat in 2026.
Pacific Gas & Electric Co. (PCG): Infrastructure-Heavy Regulatory Moat
PCG’s moat centers on regulated infrastructure and customer base stability, contrasting with NextEra’s innovation edge. Despite shedding value (ROIC below WACC), its gross margin (38%) and net margin growth (up 246%) show improving financial health. SmartMeter integration and microgrid tech could disrupt regional markets by 2026.
Innovation Edge vs. Regulatory Backbone
Both firms show improving profitability but fail to clear ROIC hurdles above WACC, signaling value destruction risks. NextEra’s renewable asset base offers a deeper, innovation-fueled moat. It stands better prepared to defend market share amid evolving energy demands than PCG’s more traditional infrastructure moat.
Which stock offers better returns?
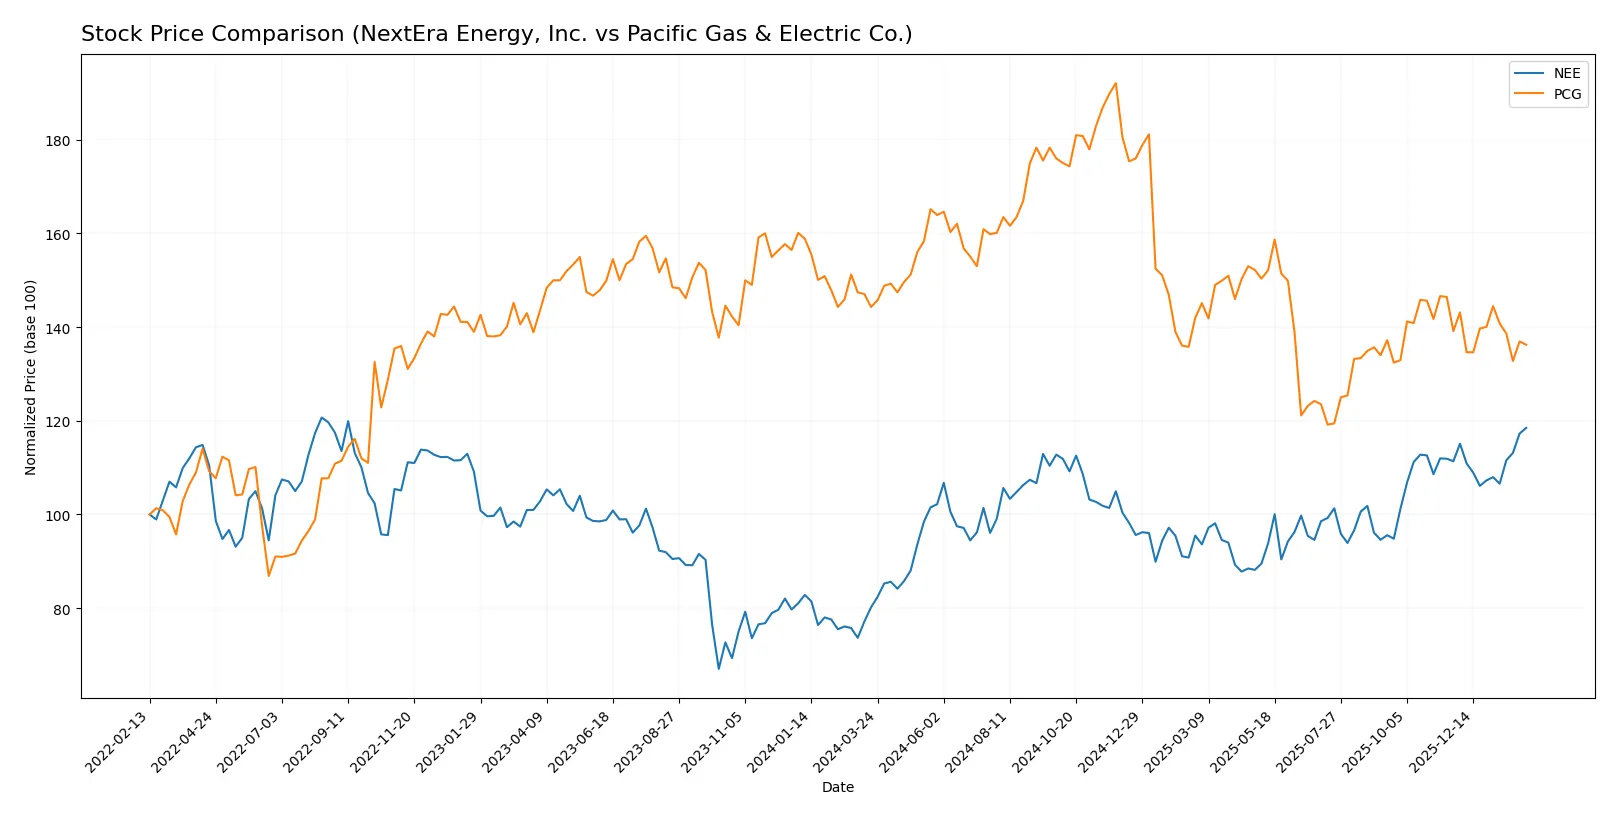
The past year shows distinct price trajectories for NextEra Energy, Inc. and Pacific Gas & Electric Co., with marked shifts in trend direction and trading volumes shaping their market narratives.
Trend Comparison
NextEra Energy, Inc. exhibits a strong bullish trend over the past 12 months, with a 47.84% price increase and accelerating momentum. The stock reached a high of 88.82 and maintained notable volatility (std deviation 6.34).
Pacific Gas & Electric Co. shows a bearish trend, declining 5.6% over the past year with accelerating downward momentum. Its price ranged between 13.42 and 21.63, with lower volatility (std deviation 1.96).
NextEra Energy clearly outperforms Pacific Gas & Electric, delivering significantly higher returns and a sustained bullish trend versus a bearish trajectory for PCG.
Target Prices
Analysts present a moderate bullish consensus for NextEra Energy and Pacific Gas & Electric.
| Company | Target Low | Target High | Consensus |
|---|---|---|---|
| NextEra Energy, Inc. | 84 | 104 | 93.09 |
| Pacific Gas & Electric Co. | 18 | 25 | 21.43 |
NextEra’s consensus target at 93.09 exceeds its current price of 88.82, indicating upside potential. PG&E’s consensus target of 21.43 also suggests significant room for share price appreciation from 15.34.

Don’t Let Luck Decide Your Entry Point
Optimize your entry points with our advanced ProRealTime indicators. You’ll get efficient buy signals with precise price targets for maximum performance. Start outperforming now!
How do institutions grade them?
This section compares the latest institutional grades for NextEra Energy, Inc. and Pacific Gas & Electric Co.:
NextEra Energy, Inc. Grades
The following table lists recent grades from reliable financial institutions for NextEra Energy, Inc.:
| Grading Company | Action | New Grade | Date |
|---|---|---|---|
| Mizuho | Maintain | Neutral | 2026-01-28 |
| Argus Research | Maintain | Buy | 2026-01-28 |
| BMO Capital | Maintain | Outperform | 2026-01-27 |
| Wells Fargo | Maintain | Overweight | 2026-01-20 |
| Barclays | Maintain | Equal Weight | 2026-01-15 |
| Jefferies | Maintain | Hold | 2025-12-31 |
| UBS | Maintain | Buy | 2025-12-17 |
| JP Morgan | Maintain | Overweight | 2025-12-11 |
| BMO Capital | Maintain | Outperform | 2025-12-10 |
| UBS | Maintain | Buy | 2025-12-10 |
Pacific Gas & Electric Co. Grades
The following table lists recent grades from reliable financial institutions for Pacific Gas & Electric Co.:
| Grading Company | Action | New Grade | Date |
|---|---|---|---|
| Jefferies | Maintain | Buy | 2026-01-28 |
| Wells Fargo | Maintain | Overweight | 2026-01-20 |
| JP Morgan | Maintain | Overweight | 2025-12-12 |
| UBS | Maintain | Neutral | 2025-10-24 |
| Jefferies | Maintain | Buy | 2025-10-22 |
| BMO Capital | Maintain | Outperform | 2025-10-14 |
| Jefferies | Maintain | Buy | 2025-10-03 |
| Barclays | Maintain | Overweight | 2025-10-01 |
| Morgan Stanley | Maintain | Equal Weight | 2025-09-25 |
| UBS | Maintain | Neutral | 2025-09-18 |
Which company has the best grades?
NextEra Energy, Inc. shows a broader range of strong buy and outperform ratings from top firms. Pacific Gas & Electric Co. holds mostly buy and overweight grades but fewer outperform ratings. This suggests investors might perceive NextEra as having slightly stronger momentum and institutional support.
Risks specific to each company
The following categories identify the critical pressure points and systemic threats facing both firms in the 2026 market environment:
1. Market & Competition
NextEra Energy, Inc.
- Dominates renewable energy with extensive scale and innovation, but faces rising competition in clean tech.
Pacific Gas & Electric Co.
- Operates in a highly regulated California market with limited growth, pressured by renewable mandates and customer alternatives.
2. Capital Structure & Debt
NextEra Energy, Inc.
- High debt-to-equity ratio (1.75) and weak interest coverage (1.99) signal financial strain.
Pacific Gas & Electric Co.
- Slightly higher leverage (1.94) and poorer interest coverage (1.76) increase refinancing risks amid regulatory scrutiny.
3. Stock Volatility
NextEra Energy, Inc.
- Beta 0.76 indicates moderate sensitivity to market swings, offering relative stability.
Pacific Gas & Electric Co.
- Beta 0.37 suggests low volatility but may reflect muted investor confidence and limited upside.
4. Regulatory & Legal
NextEra Energy, Inc.
- Faces evolving clean energy mandates but benefits from favorable federal policies.
Pacific Gas & Electric Co.
- Endures significant legal liabilities and wildfire-related penalties, posing ongoing regulatory risks.
5. Supply Chain & Operations
NextEra Energy, Inc.
- Complex asset turnover (low) highlights operational inefficiencies and capital intensity challenges.
Pacific Gas & Electric Co.
- Slightly better asset turnover but faces operational disruptions from aging infrastructure and wildfire prevention efforts.
6. ESG & Climate Transition
NextEra Energy, Inc.
- Strong ESG positioning due to renewable investments and clean energy leadership.
Pacific Gas & Electric Co.
- ESG risks elevated by historical environmental damage and required costly climate adaptation measures.
7. Geopolitical Exposure
NextEra Energy, Inc.
- Primarily U.S.-focused with exposure to state-level policy shifts; limited international risk.
Pacific Gas & Electric Co.
- Concentrated in California, vulnerable to state regulatory changes and extreme weather events.
Which company shows a better risk-adjusted profile?
NextEra Energy’s most impactful risk is its stretched capital structure and weak liquidity ratios, threatening financial flexibility. Pacific Gas & Electric’s greatest threat lies in regulatory and legal liabilities, notably wildfire-related costs undermining creditworthiness. Despite these issues, NextEra’s moderate market volatility and stronger ESG stance suggest a better risk-adjusted profile. However, both firms remain in financial distress zones per Altman Z-scores, underscoring caution.
Final Verdict: Which stock to choose?
NextEra Energy, Inc. (NEE) boasts a superpower in its robust income growth and operational scale, making it a formidable cash generator despite its heavy capex. Its point of vigilance lies in a stretched liquidity profile and debt load, which could pressure flexibility. NEE suits an aggressive growth portfolio willing to weather volatility for long-term expansion.
Pacific Gas & Electric Co. (PCG) commands a strategic moat through regulated utility stability and improving profitability metrics. Compared to NEE, PCG offers a safer balance sheet and more reasonable valuation multiples, appealing to investors seeking steadier income streams. It fits well within a GARP portfolio balancing growth potential with risk control.
If you prioritize growth backed by scale and income momentum, NEE is the compelling choice due to its accelerating revenue and market dominance. However, if you seek better stability and value with less volatility, PCG offers superior financial resilience and a clearer margin recovery path. Both carry risks, so alignment with your risk tolerance is key.
Disclaimer: Investment carries a risk of loss of initial capital. The past performance is not a reliable indicator of future results. Be sure to understand risks before making an investment decision.
Go Further
I encourage you to read the complete analyses of NextEra Energy, Inc. and Pacific Gas & Electric Co. to enhance your investment decisions: