Home > Comparison > Utilities > NEE vs OKLO
The strategic rivalry between NextEra Energy, Inc. and Oklo Inc. shapes the future of the regulated electric sector. NextEra stands as a capital-intensive utility giant with vast renewable and conventional assets. Oklo operates as an innovative nuclear-focused developer, emphasizing cutting-edge fission technology. This analysis contrasts their operational models to identify which trajectory offers superior risk-adjusted returns for a diversified portfolio in a transforming energy landscape.
Table of contents
Companies Overview
NextEra Energy and Oklo stand as key players in the evolving regulated electric sector, shaping the future of energy supply.
NextEra Energy, Inc.: A Renewable Energy Giant
NextEra Energy dominates North America’s electric power market. Its core revenue stems from generating and distributing electricity via wind, solar, nuclear, coal, and natural gas. In 2021, it focused on expanding clean energy solutions, including renewable generation, battery storage, and transmission facilities, serving 11M people and managing 28,564 MW of net generating capacity.
Oklo Inc.: The Nuclear Innovator
Oklo specializes in designing and developing fission power plants, targeting reliable commercial-scale energy in the U.S. Its revenue engine revolves around nuclear power generation and used fuel recycling. Founded in 2013, Oklo’s 2026 strategy centers on advancing nuclear technology as a clean energy alternative, positioning itself as a niche innovator in a capital-intensive industry.
Strategic Collision: Similarities & Divergences
NextEra embraces a broad, diversified energy portfolio emphasizing renewables and scale, while Oklo bets on cutting-edge nuclear innovation. Both compete to capture market share in clean, regulated electric power but through fundamentally different technologies. Investors face contrasting profiles: NextEra offers scale and stability, Oklo presents growth potential and technological risk.
Income Statement Comparison
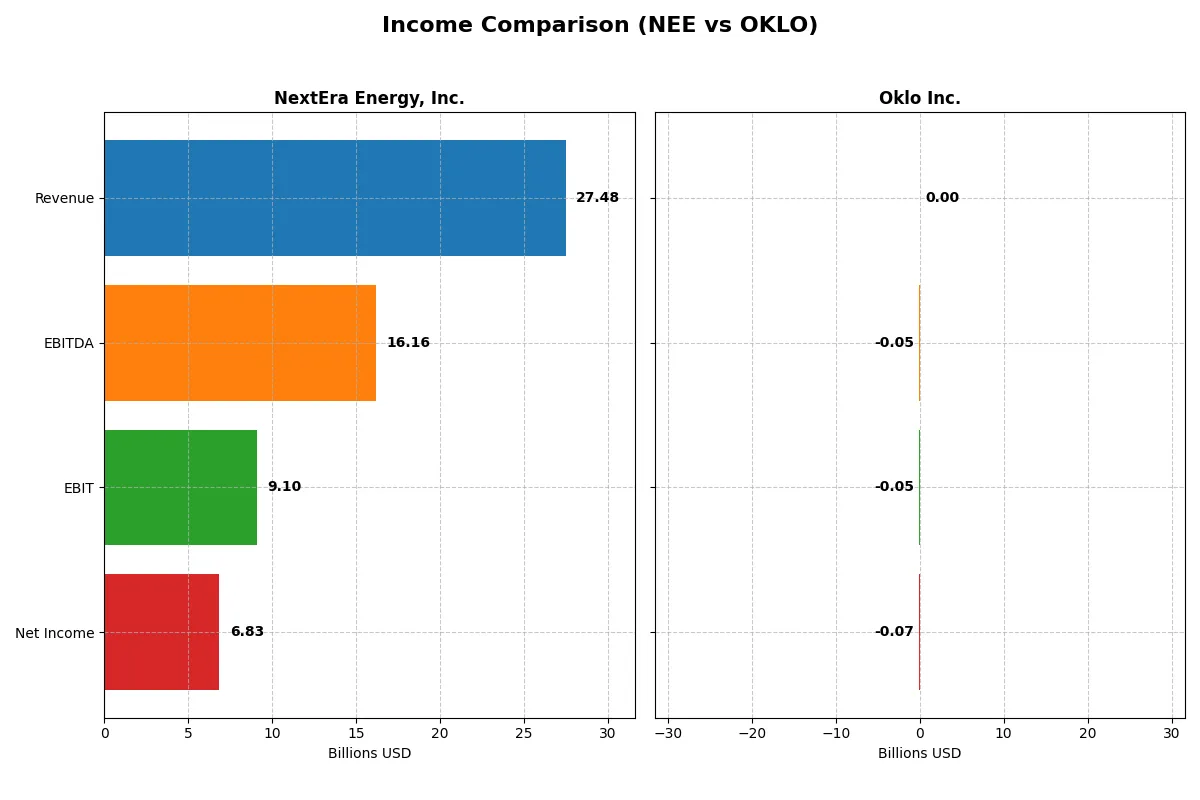
This data dissects the core profitability and scalability of both corporate engines to reveal who dominates the bottom line:
| Metric | NextEra Energy, Inc. (NEE) | Oklo Inc. (OKLO) |
|---|---|---|
| Revenue | 27.5B | 0 |
| Cost of Revenue | 10.2B | 0 |
| Operating Expenses | 8.98B | 52.8M |
| Gross Profit | 17.3B | 0 |
| EBITDA | 16.2B | -52.5M |
| EBIT | 9.10B | -52.8M |
| Interest Expense | 4.57B | 0 |
| Net Income | 6.83B | -73.6M |
| EPS | 3.31 | -0.74 |
| Fiscal Year | 2025 | 2024 |
Income Statement Analysis: The Bottom-Line Duel
The income statement comparison reveals which company converts revenue into profit most efficiently in today’s competitive energy sector.
NextEra Energy, Inc. Analysis
NextEra Energy’s revenue climbed from $17.1B in 2021 to $27.5B in 2025, showing robust 61% growth over five years. Its net income nearly doubled, reaching $6.8B in 2025. Gross margin at 62.8% and net margin near 25% confirm strong profitability, despite rising interest expenses. Efficiency improved with EBIT margin holding at a solid 33.1%.
Oklo Inc. Analysis
Oklo Inc. reported zero revenue from 2021 through 2024, reflecting its early-stage development phase. The company incurred growing net losses, expanding from -$5.2M in 2021 to -$73.6M in 2024. Margins stand at zero, indicating no operational profit. Interest income partially offsets expenditures, but negative EBIT and net income highlight ongoing cash burn and lack of scale.
Scale and Profitability vs. Development Stage Risks
NextEra Energy clearly dominates with substantial revenue and positive margins, reflecting mature operational efficiency. Oklo remains in a pre-revenue, loss-making stage typical of early energy startups. Investors seeking steady cash flow and profit will find NextEra’s profile more attractive, while Oklo’s lack of income and high losses suggest higher risk and longer-term uncertainty.
Financial Ratios Comparison
These vital ratios act as a diagnostic tool to expose the underlying fiscal health, valuation premiums, and capital efficiency of the companies compared below:
| Ratios | NextEra Energy, Inc. (NEE) | Oklo Inc. (OKLO) |
|---|---|---|
| ROE | 12.5% | -29.3% |
| ROIC | 4.2% | -19.1% |
| P/E | 24.5 | -28.5 |
| P/B | 3.07 | 8.37 |
| Current Ratio | 0.60 | 43.47 |
| Quick Ratio | 0.49 | 43.47 |
| D/E | 1.75 | 0.005 |
| Debt-to-Assets | 45.0% | 0.46% |
| Interest Coverage | 1.81 | 0 |
| Asset Turnover | 0.13 | 0 |
| Fixed Asset Turnover | 0.18 | 0 |
| Payout ratio | 68.5% | 0 |
| Dividend yield | 2.79% | 0 |
| Fiscal Year | 2025 | 2024 |
Efficiency & Valuation Duel: The Vital Signs
Financial ratios serve as a company’s DNA, exposing hidden risks and operational strengths that drive investor confidence.
NextEra Energy, Inc.
NextEra Energy delivers solid profitability with a 12.5% ROE and a strong 24.9% net margin. Its P/E of 24.5 suggests a fairly valued stock, while a high P/B of 3.07 signals some valuation stretch. The company returns value via a 2.8% dividend yield, balancing income with steady capital allocation.
Oklo Inc.
Oklo struggles with a negative ROE of -29.4% and zero net margin, reflecting operational inefficiencies. Despite a favorable P/E metric due to losses, its P/B of 8.4 is steep, showing valuation risk. No dividends exist; capital is reinvested aggressively, but profitability remains elusive amid ongoing losses.
Dividend Stability vs. Growth Gambit
NextEra Energy offers a more balanced risk-reward profile with consistent profitability and dividend income. Oklo presents higher uncertainty with negative returns and stretched valuation, fitting investors focused on speculative growth rather than income stability.
Which one offers the Superior Shareholder Reward?
NextEra Energy (NEE) pays a consistent dividend with a 2.8% yield in 2025 and a payout ratio around 68%, showing strong free cash flow coverage despite negative FCF per share due to heavy capex. NEE also conducts steady buybacks, enhancing total shareholder return sustainably. Oklo Inc. (OKLO) pays no dividends and has no buyback activity, reflecting its early-stage growth focus fueled by R&D and capex. OKLO’s massive liquidity and negligible debt support innovation but risk dilute near-term returns. I find NEE’s balanced distribution strategy superior for 2026 investors seeking reliable income plus capital appreciation.
Comparative Score Analysis: The Strategic Profile
The radar chart reveals the fundamental DNA and trade-offs of both firms, highlighting their strategic strengths and vulnerabilities:
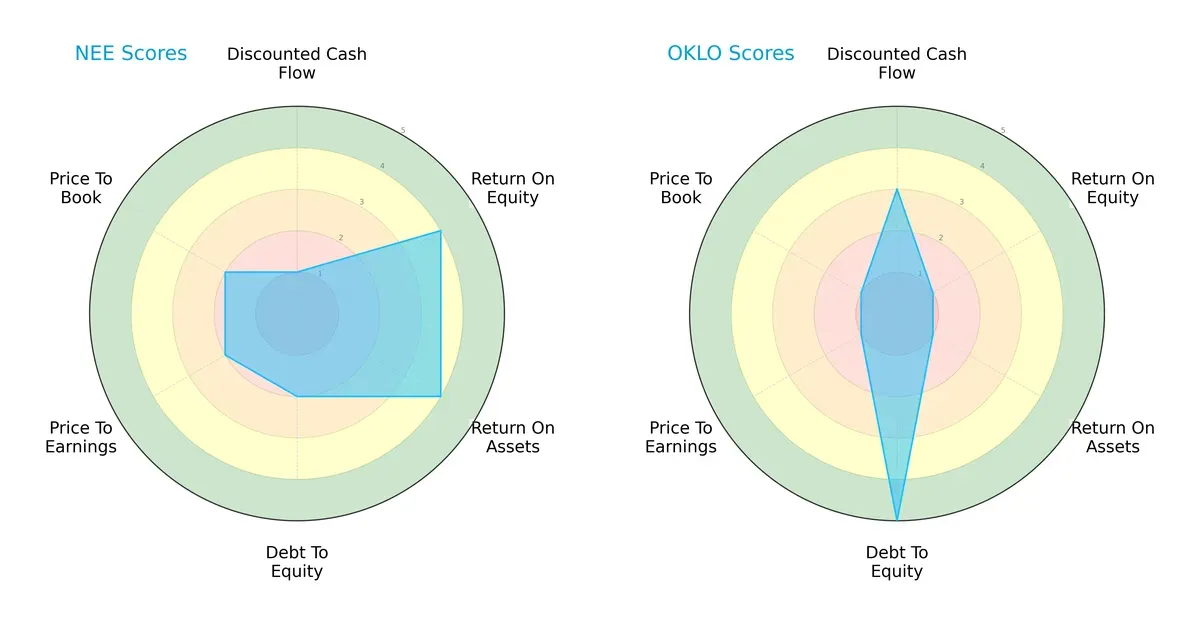
NextEra Energy (NEE) shows strength in return on equity (4) and return on assets (4), indicating efficient profit generation and asset use. Oklo Inc. (OKLO) excels in discounted cash flow (3) and debt-to-equity (5), reflecting better valuation prospects and a strong balance sheet. However, OKLO’s weak ROE (1) and ROA (1) suggest operational inefficiencies. NEE presents a more balanced profile, while OKLO relies heavily on financial stability rather than operational performance.
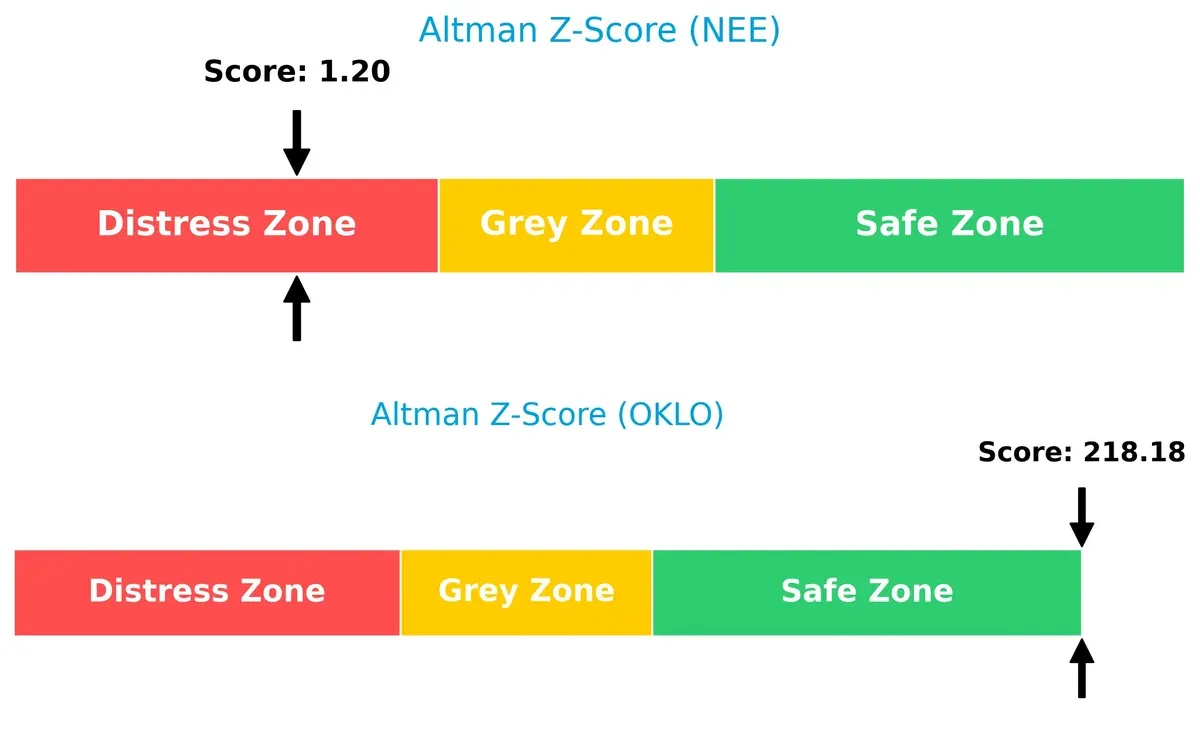
Bankruptcy Risk: Solvency Showdown
NextEra Energy’s Altman Z-Score (1.2) places it in the distress zone, signaling heightened bankruptcy risk. Oklo’s score (218.2) is exceptionally high, firmly in the safe zone, underscoring robust solvency and long-term survival prospects in this cycle:
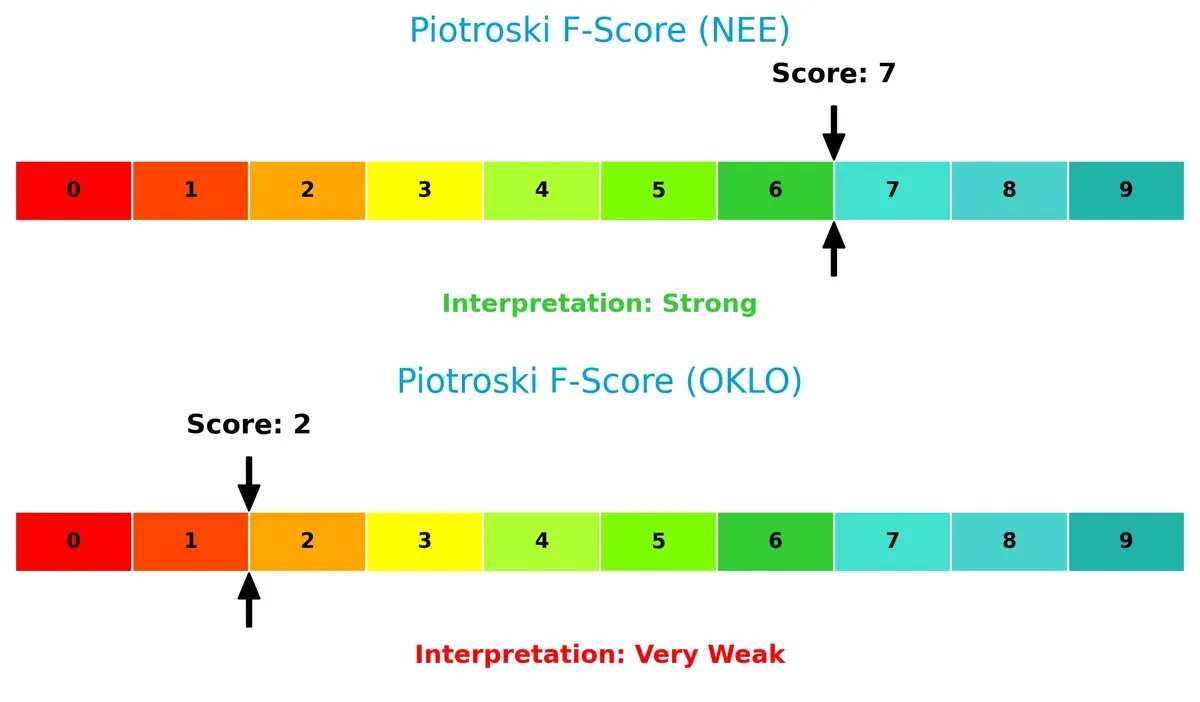
Financial Health: Quality of Operations
NextEra Energy’s Piotroski F-Score of 7 indicates strong financial health, with sound profitability and efficient operations. Oklo scores only 2, signaling serious red flags in internal metrics and operational quality:
How are the two companies positioned?
This section dissects the operational DNA of NextEra Energy and Oklo by comparing revenue distribution by segment and internal dynamics. The goal is to confront their economic moats and identify which model offers the most resilient and sustainable competitive advantage today.
Revenue Segmentation: The Strategic Mix
This visual comparison dissects how NextEra Energy, Inc. and Oklo Inc. diversify their income streams and where their primary sector bets lie:
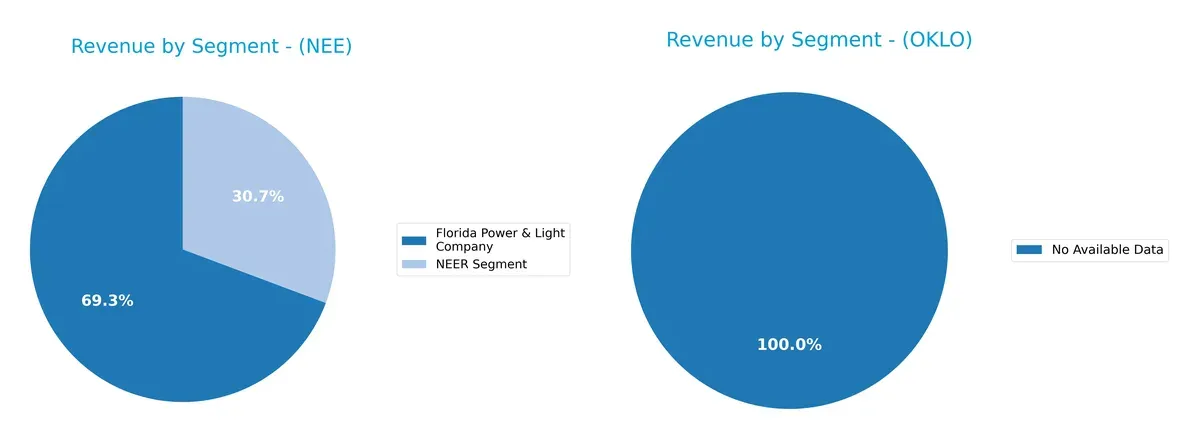
NextEra Energy anchors its revenue in Florida Power & Light, generating $17B in 2024, with a strong secondary stream from NEER at $7.5B. This mix shows moderate diversification but heavy reliance on one dominant segment. Oklo Inc. lacks available revenue data, preventing direct comparison. NextEra’s concentration suggests infrastructure dominance in regulated utilities, reducing volatility but posing geographic risk exposure. Their energy resources segment adds growth potential beyond stable utility cash flows.
Strengths and Weaknesses Comparison
This table compares the Strengths and Weaknesses of NextEra Energy, Inc. and Oklo Inc.:
NextEra Energy, Inc. Strengths
- Strong profitability with 24.87% net margin
- Favorable WACC at 6.52%
- Dividend yield of 2.79% supports income investors
Oklo Inc. Strengths
- Very low debt-to-equity ratio at 0.01
- Favorable WACC at 7.48%
- High quick ratio indicates good short-term liquidity
NextEra Energy, Inc. Weaknesses
- Low current and quick ratios indicate liquidity issues
- High debt-to-equity at 1.75 increases financial risk
- Unfavorable asset turnover suggests inefficiency
Oklo Inc. Weaknesses
- Negative ROE (-29.35%) and ROIC (-19.05%) show unprofitable operations
- Zero net margin and no dividend yield
- Interest coverage of zero signals inability to cover debt costs
NextEra demonstrates strong profitability and income generation but struggles with liquidity and operational efficiency. Oklo shows disciplined leverage and liquidity but faces severe profitability challenges, highlighting the contrasting financial profiles that will shape their strategic priorities.
The Moat Duel: Analyzing Competitive Defensibility
A structural moat is the only reliable shield protecting long-term profits from relentless competition erosion. Here’s how NextEra Energy and Oklo Inc. stack up:
NextEra Energy, Inc.: Scale and Regulatory Entrenchment
NextEra’s moat stems from regulatory protections and massive infrastructure scale. Its stable margins and 11M customers underline durable cash flow, despite ROIC trailing WACC. Expansion in renewables offers growth but also regulatory risk in 2026.
Oklo Inc.: Innovation-Driven Nuclear Technology
Oklo’s competitive advantage lies in cutting-edge nuclear design and fuel recycling, differentiating it from NextEra’s scale. Though currently value-destructive with zero revenue, its growing ROIC hints at emerging profitability potential amid nuclear energy’s revival.
Scale Moat vs. Innovation Moat: Defensive Depths Compared
NextEra’s entrenched regulatory scale trumps Oklo’s nascent technological edge for now. Despite both losing value on ROIC vs. WACC, NextEra’s stable income and customer base give it a deeper moat. It remains better positioned to defend market share in 2026.
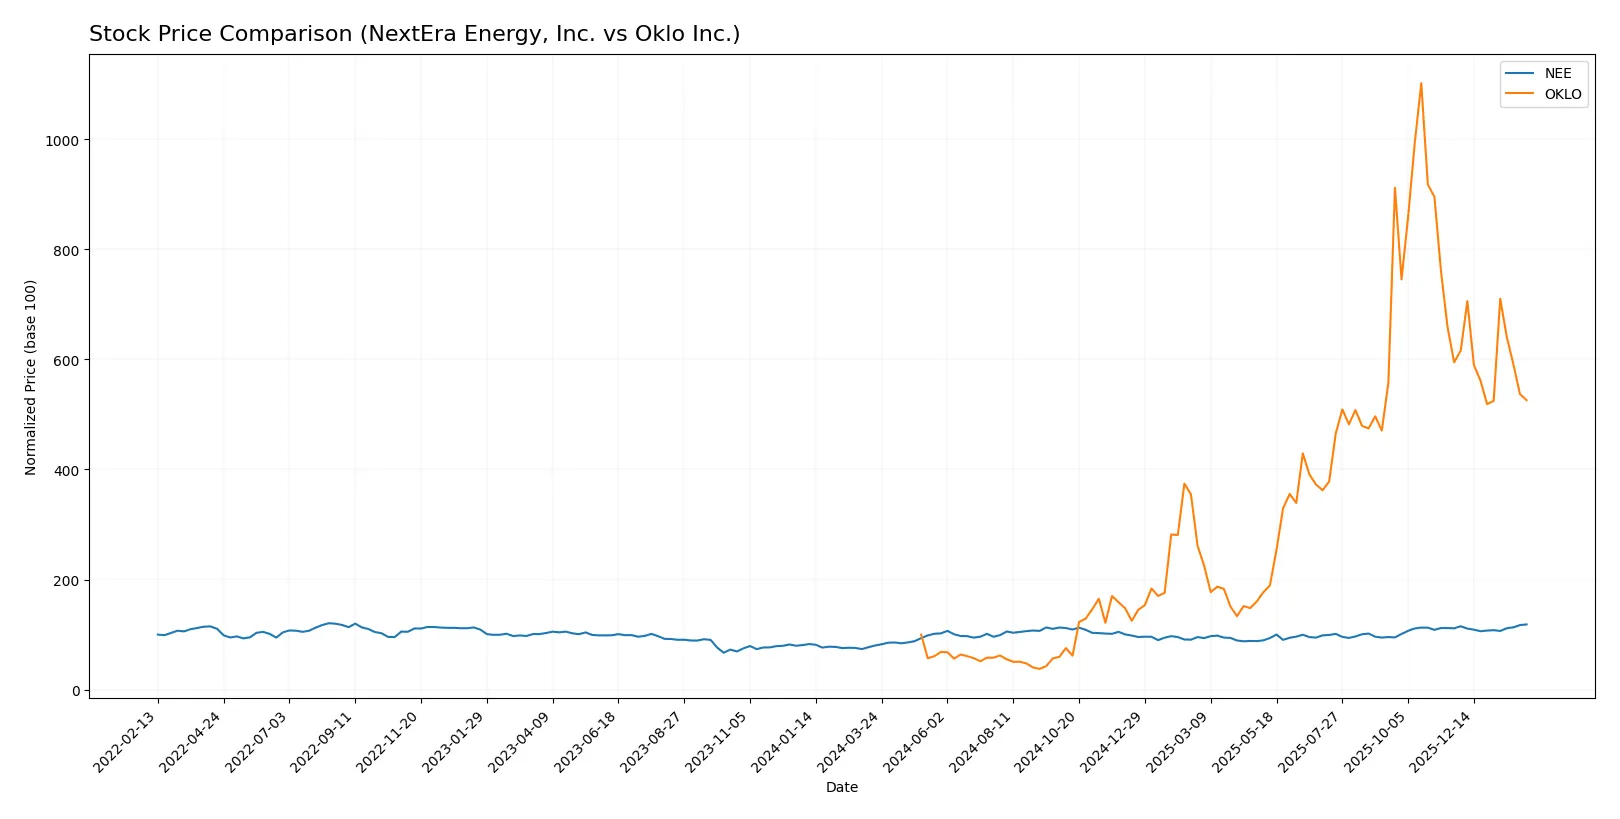
Which stock offers better returns?
Over the past year, both NextEra Energy, Inc. and Oklo Inc. showed significant price movements, with contrasting recent trends and distinct trading volume dynamics.
Trend Comparison
NextEra Energy, Inc. posted a 47.84% price increase over 12 months, marking a bullish trend with accelerating momentum and moderate volatility (6.34 std deviation). The stock hit a high of 88.82 and a low of 60.08.
Oklo Inc. surged 425.96% over the same period, confirming a strong bullish trend but with decelerating momentum and high volatility (39.03 std deviation). Its price ranged from 5.59 to 163.39.
While Oklo’s overall return dwarfs NextEra’s, its recent trend is bearish (-11.53%), contrasting with NextEra’s continued bullish direction (+6.4%). Oklo delivered the highest market performance over 12 months.
Target Prices
Analysts show a cautiously optimistic target consensus for NextEra Energy and Oklo Inc.
| Company | Target Low | Target High | Consensus |
|---|---|---|---|
| NextEra Energy, Inc. | 84 | 104 | 93.09 |
| Oklo Inc. | 95 | 150 | 125.67 |
NextEra Energy’s consensus target sits about 5% above its current price, signaling moderate upside. Oklo’s target consensus implies substantial growth potential, nearly 61% above its present value.

Don’t Let Luck Decide Your Entry Point
Optimize your entry points with our advanced ProRealTime indicators. You’ll get efficient buy signals with precise price targets for maximum performance. Start outperforming now!
How do institutions grade them?
The following tables summarize the latest grades for NextEra Energy, Inc. and Oklo Inc. from recognized grading firms:
NextEra Energy, Inc. Grades
This table shows the current analyst grades for NextEra Energy, Inc.:
| Grading Company | Action | New Grade | Date |
|---|---|---|---|
| Mizuho | maintain | Neutral | 2026-01-28 |
| Argus Research | maintain | Buy | 2026-01-28 |
| BMO Capital | maintain | Outperform | 2026-01-27 |
| Wells Fargo | maintain | Overweight | 2026-01-20 |
| Barclays | maintain | Equal Weight | 2026-01-15 |
| Jefferies | maintain | Hold | 2025-12-31 |
| UBS | maintain | Buy | 2025-12-17 |
| JP Morgan | maintain | Overweight | 2025-12-11 |
| BMO Capital | maintain | Outperform | 2025-12-10 |
| UBS | maintain | Buy | 2025-12-10 |
Oklo Inc. Grades
This table shows the current analyst grades for Oklo Inc.:
| Grading Company | Action | New Grade | Date |
|---|---|---|---|
| B of A Securities | upgrade | Buy | 2026-01-21 |
| Seaport Global | upgrade | Buy | 2025-12-08 |
| UBS | maintain | Neutral | 2025-12-03 |
| Wedbush | maintain | Outperform | 2025-11-12 |
| B. Riley Securities | maintain | Buy | 2025-11-12 |
| B of A Securities | maintain | Neutral | 2025-11-12 |
| B of A Securities | downgrade | Neutral | 2025-09-30 |
| Seaport Global | downgrade | Neutral | 2025-09-23 |
| Wedbush | maintain | Outperform | 2025-09-22 |
| Wedbush | maintain | Outperform | 2025-08-14 |
Which company has the best grades?
NextEra Energy, Inc. holds consistently strong grades, predominantly Buy, Outperform, and Overweight ratings. Oklo Inc. shows mixed ratings with recent upgrades but also downgrades to Neutral. Investors may view NextEra’s steadier analyst confidence as a sign of relative stability.
Risks specific to each company
The following categories identify the critical pressure points and systemic threats facing both firms in the 2026 market environment:
1. Market & Competition
NextEra Energy, Inc.
- Established with 28,564 MW capacity and 11M customers; faces mature regulated electric market competition.
Oklo Inc.
- Emerging nuclear tech developer; disruptive potential but intense competition and unproven commercial scale risks.
2. Capital Structure & Debt
NextEra Energy, Inc.
- High debt-to-equity (1.75) and moderate leverage (45% debt/assets) strain financial flexibility.
Oklo Inc.
- Minimal debt (0.01 D/E) and low leverage (0.46%) provide strong balance sheet but limited capital access risk.
3. Stock Volatility
NextEra Energy, Inc.
- Beta of 0.76 indicates below-market volatility; stable trading range supports risk management.
Oklo Inc.
- Beta of 0.77 with wide price range (17.42–193.84) signals high speculative risk and price swings.
4. Regulatory & Legal
NextEra Energy, Inc.
- Subject to extensive US utility regulations but benefits from established compliance frameworks.
Oklo Inc.
- Faces complex nuclear regulatory hurdles and licensing uncertainties, heightening legal risk.
5. Supply Chain & Operations
NextEra Energy, Inc.
- Large scale operations with integrated supply chain; some exposure to fossil fuel volatility.
Oklo Inc.
- Reliant on advanced nuclear components; supply chain fragility and technology scale-up risks prevail.
6. ESG & Climate Transition
NextEra Energy, Inc.
- Strong renewable portfolio supports ESG positioning but coal and gas assets pose transition risks.
Oklo Inc.
- Nuclear focus offers low-carbon advantage but public perception and waste management remain challenges.
7. Geopolitical Exposure
NextEra Energy, Inc.
- Primarily US-focused with limited geopolitical risk; stable regulatory environment.
Oklo Inc.
- US-centric but nuclear sector sensitive to geopolitical shifts in energy policy and security concerns.
Which company shows a better risk-adjusted profile?
NextEra’s largest risk is its stretched capital structure and weak liquidity ratios amid high asset leverage. Oklo faces acute operational and regulatory risks tied to its unproven technology and weak profitability. Despite this, Oklo’s pristine balance sheet and low debt provide a cushion. However, NextEra’s stable market position and moderate volatility suggest a more balanced risk profile. Recent data reveals NextEra’s Altman Z-Score signals distress, a red flag for financial health, whereas Oklo scores well on solvency but suffers from poor profitability and operational execution risks. Overall, NextEra offers a more risk-adjusted profile for cautious investors, but both require close monitoring.
Final Verdict: Which stock to choose?
NextEra Energy, Inc. (NEE) shines as a cash-generating powerhouse with robust revenue growth and improving profitability. Its core strength lies in operational scale and consistent earnings quality. A point of vigilance is its stretched liquidity and elevated debt levels. NEE suits investors targeting steady income and moderate growth.
Oklo Inc. (OKLO) presents an ambitious growth story rooted in innovative nuclear technology, offering a strategic moat based on disruptive potential. It carries higher financial risk but benefits from a pristine balance sheet and minimal leverage. OKLO fits a high-risk, high-reward portfolio focused on early-stage innovation plays.
If you prioritize dependable cash flow and operational resilience, NextEra Energy outshines with better stability despite valuation concerns. However, if you seek venture-style growth with a willingness to tolerate volatility, Oklo offers superior upside potential but demands caution. Both merit consideration under distinct investor profiles and risk appetites.
Disclaimer: Investment carries a risk of loss of initial capital. The past performance is not a reliable indicator of future results. Be sure to understand risks before making an investment decision.
Go Further
I encourage you to read the complete analyses of NextEra Energy, Inc. and Oklo Inc. to enhance your investment decisions: