In the evolving uranium sector, NexGen Energy Ltd. and Denison Mines Corp. stand out as key players shaping the future of energy resources. Both Canadian companies focus on uranium exploration and development within the Athabasca Basin, a premier uranium mining region. Their innovation strategies and project scales offer distinct investment profiles. Join me as we analyze these firms to identify which company presents the most compelling opportunity for your portfolio.
Table of contents
Companies Overview
I will begin the comparison between NexGen Energy Ltd. and Denison Mines Corp. by providing an overview of these two companies and their main differences.
NexGen Energy Ltd. Overview
NexGen Energy Ltd. operates in the uranium industry, focusing on the acquisition, exploration, evaluation, and development of uranium properties in Canada. Its principal asset is the Rook I project located in the southwestern Athabasca Basin of Saskatchewan. The company is headquartered in Vancouver and is positioned as an exploration and development stage company within the energy sector, employing 133 full-time staff.
Denison Mines Corp. Overview
Denison Mines Corp. is also active in the uranium sector, engaging in acquisition, exploration, development, extraction, processing, and selling of uranium properties in Canada. Its flagship asset is the Wheeler River project, where it holds a 95% interest, situated in the northern Saskatchewan Athabasca Basin. Founded in 1997 and based in Toronto, Denison employs 65 people and operates as a more diversified uranium company within the energy sector.
Key similarities and differences
Both NexGen and Denison operate in the Canadian uranium industry, focusing on exploration and development in the Athabasca Basin. NexGen is more focused on exploration and development with a larger workforce, while Denison has a more diversified business model including extraction and processing. Market capitalization differs significantly, with NexGen valued at approximately 7B USD and Denison at 3B USD, reflecting different scales and stages in their operational development.
Income Statement Comparison
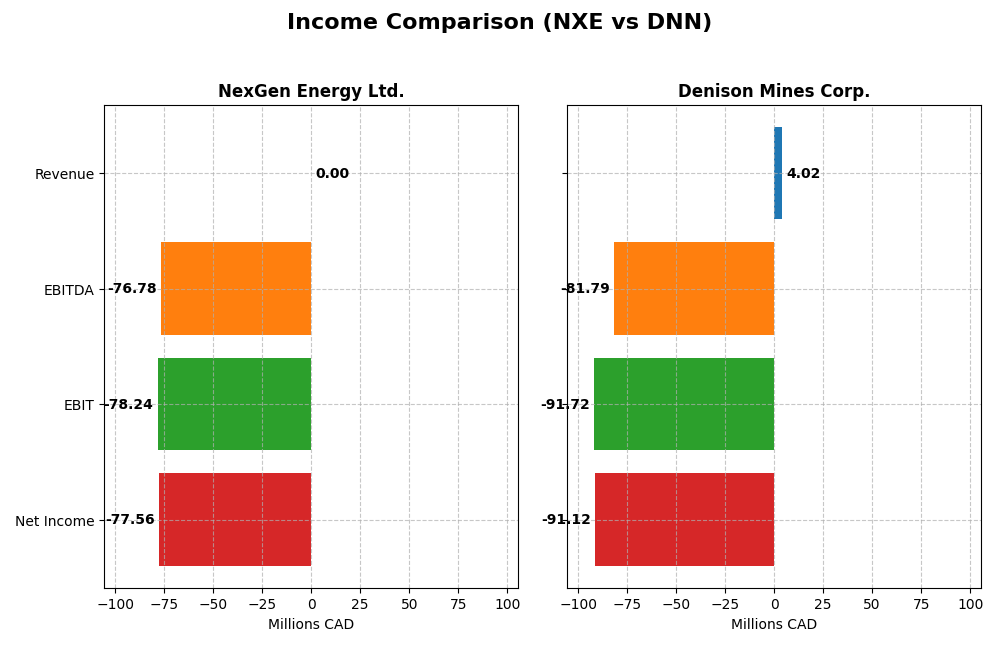
The table below presents a side-by-side comparison of key income statement metrics for NexGen Energy Ltd. and Denison Mines Corp. for the fiscal year 2024 in CAD currency.
| Metric | NexGen Energy Ltd. (NXE) | Denison Mines Corp. (DNN) |
|---|---|---|
| Market Cap | 7.03B | 2.97B |
| Revenue | 0 | 4.02M |
| EBITDA | -76.8M | -81.8M |
| EBIT | -78.2M | -91.7M |
| Net Income | -77.6M | -91.1M |
| EPS | -0.14 | -0.10 |
| Fiscal Year | 2024 | 2024 |
Income Statement Interpretations
NexGen Energy Ltd.
NexGen Energy Ltd. reported zero revenue from 2020 to 2024, reflecting its exploration stage status. Net income showed volatility, with a strong positive spike in 2023 (CAD 81M) but a loss of CAD 77.6M in 2024. Margins remained unfavorable overall, with no gross or EBIT margin and a slight improvement in interest expense. The 2024 year saw a significant earnings decline and margin deterioration following the prior year’s gain.
Denison Mines Corp.
Denison Mines experienced fluctuating revenues, peaking at CAD 20M in 2021 and falling to CAD 4M in 2024. Net income peaked at CAD 90M in 2023 but returned to a loss of CAD 91M in 2024. Margins have been persistently unfavorable, with negative gross and EBIT margins in recent years. Despite 2024’s revenue growth, net margin and EPS declined sharply, indicating operational and profitability challenges.
Which one has the stronger fundamentals?
Both companies exhibit predominantly unfavorable income statement fundamentals, with sustained losses and negative margins. NexGen’s net income and EPS show some positive growth over five years, albeit from no revenue, while Denison’s revenue and net income declined significantly over the period. Neither company displays consistent profitability, but NexGen’s smaller unfavorable margin impact and modest net income growth suggest relatively stronger fundamentals in income statement terms.
Financial Ratios Comparison
This table presents a side-by-side comparison of key financial ratios for NexGen Energy Ltd. (NXE) and Denison Mines Corp. (DNN) based on their most recent fiscal year, 2024.
| Ratios | NexGen Energy Ltd. (NXE) | Denison Mines Corp. (DNN) |
|---|---|---|
| ROE | -6.58% | -16.15% |
| ROIC | -4.39% | -10.03% |
| P/E | -67.80 | -25.35 |
| P/B | 4.46 | 4.09 |
| Current Ratio | 1.03 | 3.65 |
| Quick Ratio | 1.03 | 3.54 |
| D/E (Debt-to-Equity) | 0.39 | 0.00 |
| Debt-to-Assets | 27.56% | 0.00% |
| Interest Coverage | -2.33 | -586.32 |
| Asset Turnover | 0 | 0.0061 |
| Fixed Asset Turnover | 0 | 0.0155 |
| Payout ratio | 0 | 0 |
| Dividend yield | 0 | 0 |
Interpretation of the Ratios
NexGen Energy Ltd.
NexGen Energy Ltd. exhibits a majority of unfavorable ratios in 2024, with negative returns on equity (-6.58%) and invested capital (-4.39%), and a concerning interest coverage ratio. Its current ratio is neutral at 1.03, while leverage ratios show strength. The company does not pay dividends, reflecting its exploration and development stage status, focusing on reinvestment rather than shareholder payouts.
Denison Mines Corp.
Denison Mines Corp. also faces predominantly unfavorable ratios, including a deeply negative net margin (-2264.95%) and weak returns on equity (-16.15%) and invested capital (-10.03%). Despite a strong quick ratio and zero debt to equity, its interest coverage is severely negative. Like NexGen, Denison Mines pays no dividends, likely prioritizing growth and development over distributions to shareholders.
Which one has the best ratios?
Both companies show unfavorable financial ratios overall, but NexGen Energy Ltd. has a slightly better balance with some favorable leverage metrics and a neutral current ratio. Denison Mines Corp. presents more extreme negative profitability and coverage ratios, though it benefits from zero debt. Neither company currently provides dividends, consistent with their development focus.
Strategic Positioning
This section compares the strategic positioning of NexGen Energy Ltd. and Denison Mines Corp. in terms of market position, key segments, and exposure to technological disruption:
NexGen Energy Ltd.
- Mid-sized uranium explorer with higher market cap, facing competitive pressure in Athabasca Basin region.
- Focused on exploration and development of a single major uranium project, Rook I, in southwestern Athabasca Basin.
- No explicit data on technological disruption exposure provided.
Denison Mines Corp.
- Smaller uranium company with lower market cap, competing in same Athabasca Basin uranium sector.
- Engaged in broader uranium activities including extraction, processing, and ownership of Wheeler River project.
- No explicit data on technological disruption exposure provided.
NexGen Energy Ltd. vs Denison Mines Corp. Positioning
NexGen Energy Ltd. pursues a more concentrated strategy centered on one large uranium property, potentially limiting diversification but focusing resources. Denison Mines has a somewhat broader operational scope including extraction and processing, which may diversify risk but with fewer employees and smaller market cap.
Which has the best competitive advantage?
Both companies are currently shedding value as ROIC is below WACC; however, NexGen shows a growing ROIC trend, indicating improving profitability, whereas Denison’s ROIC trend is neutral, suggesting less favorable competitive advantage.
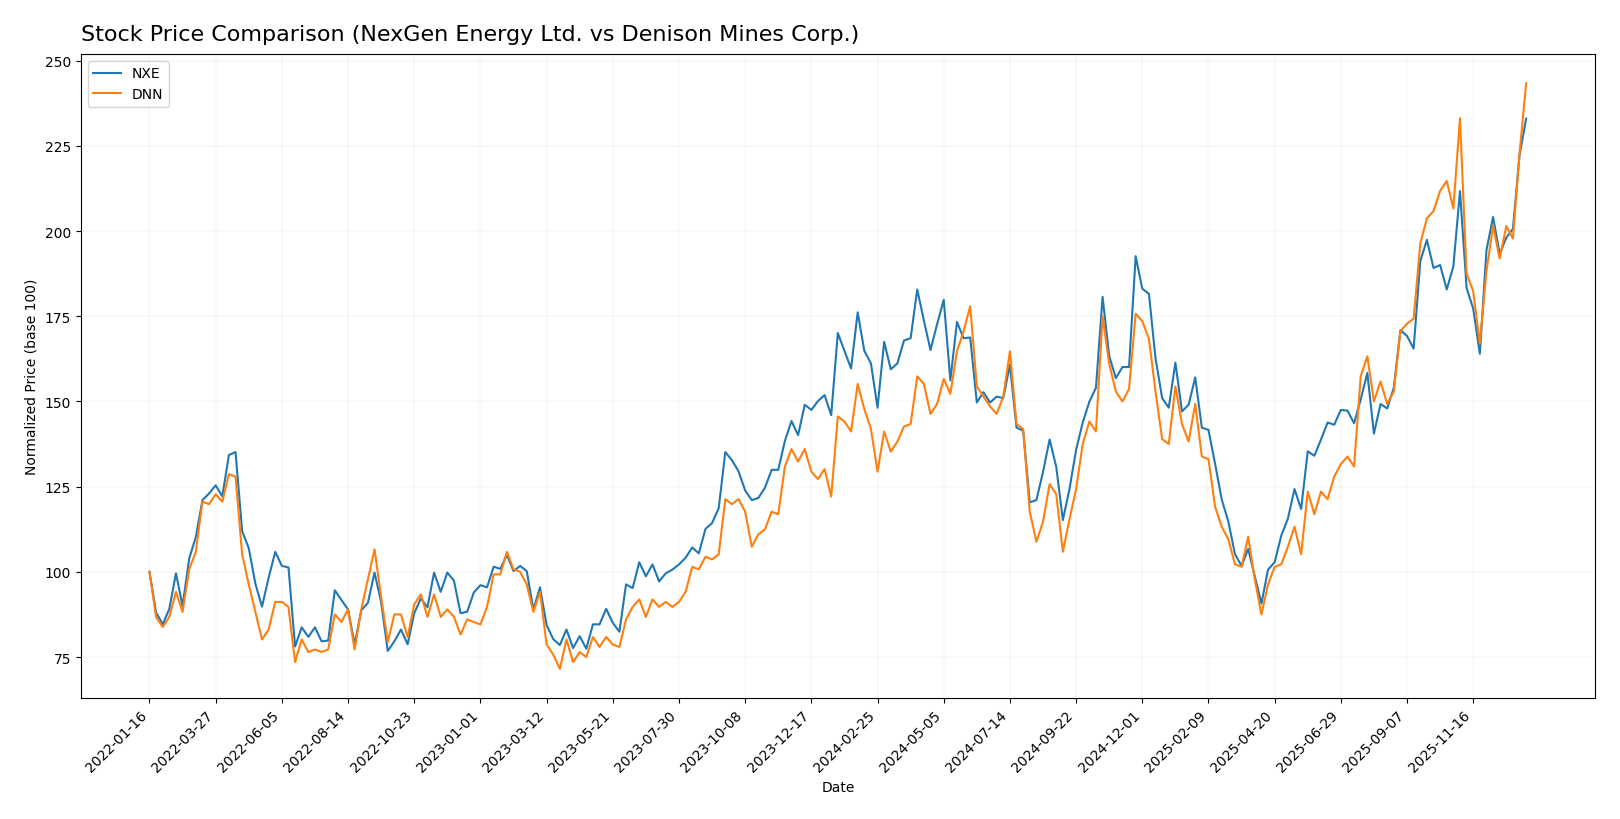
Stock Comparison
The stock prices of NexGen Energy Ltd. (NXE) and Denison Mines Corp. (DNN) have exhibited significant bullish trends over the past 12 months, with notable price appreciation and varied trading volumes shaping their market dynamics.
Trend Analysis
NexGen Energy Ltd. (NXE) experienced a 44.55% price increase over the past year, reflecting a bullish trend with acceleration. The stock moved between a low of 4.18 and a high of 10.74, showing moderate volatility with a standard deviation of 1.3.
Denison Mines Corp. (DNN) reported a 71.5% price increase over the same period, also bullish with acceleration. Its price ranged from 1.19 to 3.31 while exhibiting lower volatility than NXE, with a standard deviation of 0.44.
Comparing both stocks, DNN delivered the highest market performance with a 71.5% gain versus NXE’s 44.55%, indicating stronger overall price appreciation in the analyzed period.
Target Prices
For Denison Mines Corp., analysts present a clear target consensus.
| Company | Target High | Target Low | Consensus |
|---|---|---|---|
| Denison Mines Corp. | 2.6 | 2.6 | 2.6 |
The consensus target price for Denison Mines is $2.60, which is significantly below the current stock price of $3.31, indicating a bearish analyst outlook. No verified target price data is available for NexGen Energy Ltd.
Analyst Opinions Comparison
This section compares analysts’ ratings and grades for NexGen Energy Ltd. and Denison Mines Corp.:
Rating Comparison
NexGen Energy Ltd. Rating
- Rating: D+ with a very favorable status
- Discounted Cash Flow Score: 2, indicating moderate valuation
- ROE Score: 1, very unfavorable performance
- ROA Score: 1, very unfavorable performance
- Debt To Equity Score: 1, very unfavorable financial risk
- Overall Score: 1, very unfavorable financial standing
Denison Mines Corp. Rating
- Rating: C- with a very favorable status
- Discounted Cash Flow Score: 3, indicating moderate valuation
- ROE Score: 1, very unfavorable performance
- ROA Score: 1, very unfavorable performance
- Debt To Equity Score: 1, very unfavorable financial risk
- Overall Score: 1, very unfavorable financial standing
Which one is the best rated?
Both companies share an overall score of 1, indicating very unfavorable financial standings. Denison Mines holds a slightly better rating of C- compared to NexGen’s D+, mainly due to a higher discounted cash flow score.
Scores Comparison
The following table compares the Altman Z-Score and Piotroski Score of NexGen Energy Ltd. and Denison Mines Corp.:
NexGen Energy Ltd. Scores
- Altman Z-Score: 6.89, indicating a safe zone
- Piotroski Score: 1, classified as very weak
Denison Mines Corp. Scores
- Altman Z-Score: 0.73, indicating distress zone
- Piotroski Score: 4, classified as average
Which company has the best scores?
NexGen Energy Ltd. shows a significantly higher Altman Z-Score, indicating strong financial stability, while Denison Mines Corp. has a better Piotroski Score, reflecting relatively stronger financial health. Each company leads in one score category.
Grades Comparison
Here is the grades comparison for NexGen Energy Ltd. and Denison Mines Corp.:
NexGen Energy Ltd. Grades
The following table summarizes the consensus grades for NexGen Energy Ltd. from verified grading companies.
| Grading Company | Action | New Grade | Date |
|---|---|---|---|
| Consensus | Buy | Buy | N/A |
NexGen Energy Ltd. shows a consistent buy consensus across four ratings, indicating steady positive sentiment without downgrades.
Denison Mines Corp. Grades
The following table presents recent grades for Denison Mines Corp. from recognized grading firms.
| Grading Company | Action | New Grade | Date |
|---|---|---|---|
| Roth MKM | Maintain | Buy | 2024-10-23 |
| TD Securities | Maintain | Speculative Buy | 2023-06-27 |
| Raymond James | Maintain | Outperform | 2023-06-27 |
| TD Securities | Maintain | Speculative Buy | 2023-06-26 |
| Raymond James | Maintain | Outperform | 2023-06-26 |
| Credit Suisse | Downgrade | Underperform | 2017-07-18 |
| Credit Suisse | Downgrade | Underperform | 2017-07-17 |
| Roth Capital | Maintain | Buy | 2016-02-10 |
| Credit Suisse | Upgrade | Neutral | 2014-04-01 |
| Credit Suisse | Upgrade | Neutral | 2014-03-31 |
Denison Mines Corp. has maintained mostly positive grades recently with “Buy,” “Speculative Buy,” and “Outperform” ratings, showing recovery from older downgrades.
Which company has the best grades?
Denison Mines Corp. has received more varied but generally optimistic grades, including multiple “Buy” and “Outperform” ratings, compared to NexGen Energy Ltd.’s unanimous “Buy” consensus. This suggests Denison may carry a broader analyst interest, potentially affecting investor confidence differently.
Strengths and Weaknesses
Below is a comparison table outlining the key strengths and weaknesses of NexGen Energy Ltd. (NXE) and Denison Mines Corp. (DNN) based on their recent financial performance and market positioning as of 2026.
| Criterion | NexGen Energy Ltd. (NXE) | Denison Mines Corp. (DNN) |
|---|---|---|
| Diversification | Limited product diversification, focused on uranium mining | Focused on uranium mining with limited diversification |
| Profitability | Negative ROIC (-4.39%), shedding value but improving profitability | Negative ROIC (-10.03%), shedding value with stable yet unfavorable trend |
| Innovation | Moderate innovation with potential in uranium extraction techniques | Moderate innovation, but no significant recent breakthroughs |
| Global presence | Primarily North American focus, limited global footprint | Primarily North American market presence |
| Market Share | Small player in uranium sector, growing ROIC indicates potential | Small but stable market share, value destruction persists |
Key takeaways: Both NXE and DNN are currently value destroyers with unfavorable profitability metrics, though NXE shows a slight improvement trend. Both companies have limited diversification and modest global presence, suggesting cautious investment consideration with focus on risk management.
Risk Analysis
Below is a comparative table of key risks for NexGen Energy Ltd. (NXE) and Denison Mines Corp. (DNN) based on the most recent 2024 data:
| Metric | NexGen Energy Ltd. (NXE) | Denison Mines Corp. (DNN) |
|---|---|---|
| Market Risk | High beta at 1.856 indicates elevated volatility | High beta at 1.89 indicates elevated volatility |
| Debt level | Moderate debt-to-assets at 27.56%, debt/equity 0.39 (favorable) | No debt, debt/equity 0 (favorable) |
| Regulatory Risk | High, uranium industry heavily regulated in Canada | High, similar regulatory environment in Canada |
| Operational Risk | Exploration and development stage; no revenue yet | Exploration and development; negative margins indicate operational challenges |
| Environmental Risk | Significant due to uranium mining and local ecosystem impact | Significant, uranium mining environmental concerns persist |
| Geopolitical Risk | Moderate, focused in stable Canadian jurisdiction | Moderate, similar Canadian jurisdiction focus |
Synthesis: Both companies face high market volatility and regulatory scrutiny inherent to uranium mining in Canada. Denison’s lack of debt reduces financial risk but its Altman Z-Score in distress zone signals bankruptcy risk. NexGen shows moderate debt but is in the safe zone financially, though operational losses persist for both. Environmental and geopolitical risks remain impactful given uranium sector sensitivities.
Which Stock to Choose?
NexGen Energy Ltd. (NXE) shows a stagnant revenue growth with unfavorable profitability ratios, including negative returns on equity and invested capital. Its debt levels are moderate with a net debt to EBITDA ratio of 0.26, while its overall financial ratios score is unfavorable despite some favorable liquidity metrics. The company’s rating is very favorable but the global financial ratios and income statement evaluations remain unfavorable.
Denison Mines Corp. (DNN) reported significant revenue growth in the last year but exhibits a negative trend in profitability with deeply negative net margin and returns on equity. It carries no debt, reflected in favorable debt-to-equity ratios, but suffers from unfavorable income and financial ratios overall. Its rating is very favorable, yet the company is in financial distress as indicated by its Altman Z-Score.
Considering their ratings and financial evaluations, NXE could appear more appealing to investors seeking companies with improving profitability trends despite current value destruction. Conversely, DNN might be more relevant for those prioritizing companies with zero debt and recent revenue growth but facing ongoing value erosion and financial instability.
Disclaimer: Investment carries a risk of loss of initial capital. The past performance is not a reliable indicator of future results. Be sure to understand risks before making an investment decision.
Go Further
I encourage you to read the complete analyses of NexGen Energy Ltd. and Denison Mines Corp. to enhance your investment decisions: