Unilever PLC and Newell Brands Inc. are two prominent players in the Household & Personal Products industry, competing in overlapping markets with diverse product portfolios. Unilever excels in beauty, food, and home care, while Newell focuses on commercial solutions, home appliances, and outdoor goods. Both companies pursue innovation to capture consumer loyalty. In this article, I will analyze their strengths and risks to help you decide which stock deserves a place in your investment portfolio.
Table of contents
Companies Overview
I will begin the comparison between Unilever PLC and Newell Brands Inc. by providing an overview of these two companies and their main differences.
Unilever PLC Overview
Unilever PLC is a global fast-moving consumer goods company headquartered in London, UK. It operates across three main segments: Beauty & Personal Care, Foods & Refreshment, and Home Care. The company is known for its diverse portfolio of brands including Dove, Ben & Jerry’s, and Magnum, serving daily household and personal product needs. With a market cap of 140.6B USD, Unilever holds a strong position in the consumer defensive sector.
Newell Brands Inc. Overview
Newell Brands Inc., based in Atlanta, Georgia, is a designer, manufacturer, and distributor of consumer and commercial products. It operates through five segments including Commercial Solutions and Home Appliances, with brands such as Rubbermaid, Coleman, and Sharpie. The company targets a broad retail network and has a market cap of approximately 1.74B USD, positioning itself within the consumer defensive industry with a focus on household and recreational products.
Key similarities and differences
Both companies operate in the consumer defensive sector, focusing on household and personal products. Unilever emphasizes fast-moving consumer goods with a global presence and a broad brand portfolio in food and personal care. Newell Brands, meanwhile, offers a diversified product range across commercial, home, and outdoor segments but with a smaller market cap and workforce. Their business models overlap in retail distribution but differ significantly in product segmentation and scale.
Income Statement Comparison
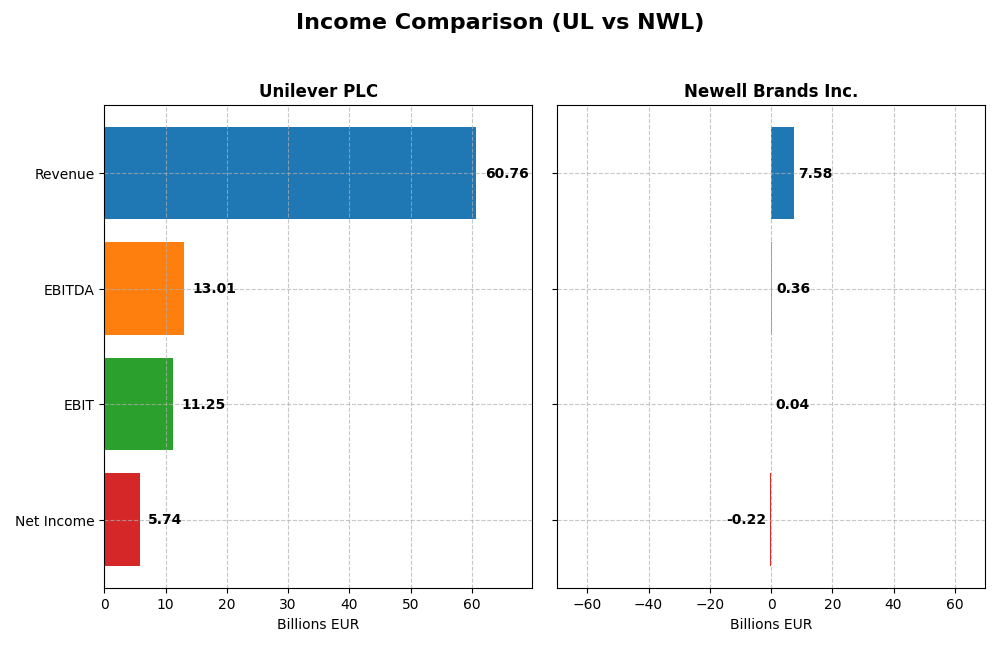
The table below compares key income statement metrics for Unilever PLC and Newell Brands Inc. for the fiscal year 2024, providing a snapshot of their financial performance.
| Metric | Unilever PLC (UL) | Newell Brands Inc. (NWL) |
|---|---|---|
| Market Cap | 141B EUR | 1.74B USD |
| Revenue | 60.8B EUR | 7.58B USD |
| EBITDA | 13.0B EUR | 358M USD |
| EBIT | 11.3B EUR | 35M USD |
| Net Income | 5.74B EUR | -216M USD |
| EPS | 2.3 EUR | -0.52 USD |
| Fiscal Year | 2024 | 2024 |
Income Statement Interpretations
Unilever PLC
Unilever’s revenue showed a steady increase from €50.7B in 2020 to €60.8B in 2024, representing a 19.79% growth over the period. Net income fluctuated, peaking at €7.6B in 2022 before declining to €5.7B in 2024. Margins remained largely favorable, with a strong gross margin of 100% and an EBIT margin around 18.5%. In 2024, revenue growth slowed to 1.94%, and net margin contracted by 13.14%, indicating some pressure on profitability despite solid operating income.
Newell Brands Inc.
Newell’s revenue declined from $9.4B in 2020 to $7.6B in 2024, a 19.21% drop over five years. Net income showed improvement, moving from a loss of $770M in 2020 to a negative $216M in 2024, with a notable rebound from larger losses in prior years. Gross margin remained favorable above 33%, while EBIT margin was marginal at 0.46%. The 2024 year showed a 6.77% revenue decline but a 115% increase in EBIT and better net margin, reflecting some recovery in operational efficiency.
Which one has the stronger fundamentals?
Unilever exhibits stronger fundamentals overall, with consistent revenue growth, robust gross and EBIT margins, and a positive net income trend despite recent margin pressures. Newell faces revenue decline and negative net income, though it shows improvement in profitability metrics recently. Both companies have favorable global income statement opinions, but Unilever’s scale and sustained profitability provide a more stable financial footing.
Financial Ratios Comparison
This table presents the latest key financial ratios for Unilever PLC and Newell Brands Inc. based on their 2024 fiscal year-end data, facilitating a direct comparison of their financial health and performance.
| Ratios | Unilever PLC (UL) | Newell Brands Inc. (NWL) |
|---|---|---|
| ROE | 28.7% | -7.9% |
| ROIC | 11.1% | 0.6% |
| P/E | 23.9 | -19.2 |
| P/B | 6.87 | 1.50 |
| Current Ratio | 0.76 | 1.14 |
| Quick Ratio | 0.56 | 0.56 |
| D/E (Debt to Equity) | 1.53 | 1.86 |
| Debt-to-Assets | 38.4% | 46.6% |
| Interest Coverage | 8.41 | 0.23 |
| Asset Turnover | 0.76 | 0.69 |
| Fixed Asset Turnover | 5.21 | 4.67 |
| Payout Ratio | 75.2% | -54.6% |
| Dividend Yield | 3.14% | 2.85% |
Interpretation of the Ratios
Unilever PLC
Unilever PLC shows a slightly favorable ratio profile with strengths in return on equity (28.73%) and return on invested capital (11.12%), supported by a favorable weighted average cost of capital (4.42%) and interest coverage (10.06). However, liquidity ratios such as current ratio (0.76) and quick ratio (0.56) are weak, alongside a high price-to-book ratio (6.87). The company offers a steady dividend yield of 3.14%, supported by a consistent payout and coverage through free cash flow, though some leverage concerns remain.
Newell Brands Inc.
Newell Brands presents a slightly unfavorable ratio set with negative net margin (-2.85%) and return on equity (-7.85%), indicating profitability challenges. While the weighted average cost of capital (5.56%) and fixed asset turnover (4.67) are favorable, interest coverage is critically low (0.12), raising solvency concerns. The dividend yield stands at 2.85%, but the firm’s weak profitability and high debt levels suggest risks to sustained shareholder returns.
Which one has the best ratios?
Unilever PLC holds the stronger overall ratio profile, benefiting from favorable profitability metrics and solid dividend yield despite liquidity weaknesses. In contrast, Newell Brands struggles with negative profitability and poor interest coverage, undermining its financial stability. Thus, Unilever’s ratios are generally more favorable than Newell’s in this comparison.
Strategic Positioning
This section compares the strategic positioning of Unilever PLC and Newell Brands Inc., focusing on market position, key segments, and exposure to technological disruption:
Unilever PLC
- Large market cap of 140.6B USD in household and personal products, facing moderate competitive pressure.
- Diversified segments: Beauty & Personal Care, Foods & Refreshment, Home Care, with many global brands.
- Limited direct mention of technological disruption exposure in FMCG segments.
Newell Brands Inc.
- Smaller market cap of 1.74B USD, competing in household and personal products with higher market volatility.
- Concentrated segments: Commercial Solutions, Home Appliances, Learning & Development, Outdoor & Recreation.
- No explicit technological disruption noted, but product innovation across diverse consumer and commercial segments.
Unilever PLC vs Newell Brands Inc. Positioning
Unilever’s diversified approach spans multiple product categories with strong global brands, offering stability but facing intense competition. Newell focuses on specific consumer and commercial products, potentially benefiting from targeted innovation but with higher market risks and smaller scale.
Which has the best competitive advantage?
Unilever shows a slightly favorable moat with value creation despite declining profitability, indicating a more stable competitive advantage. Newell displays a slightly unfavorable moat, shedding value but improving profitability, suggesting less consistent competitive strength.
Stock Comparison
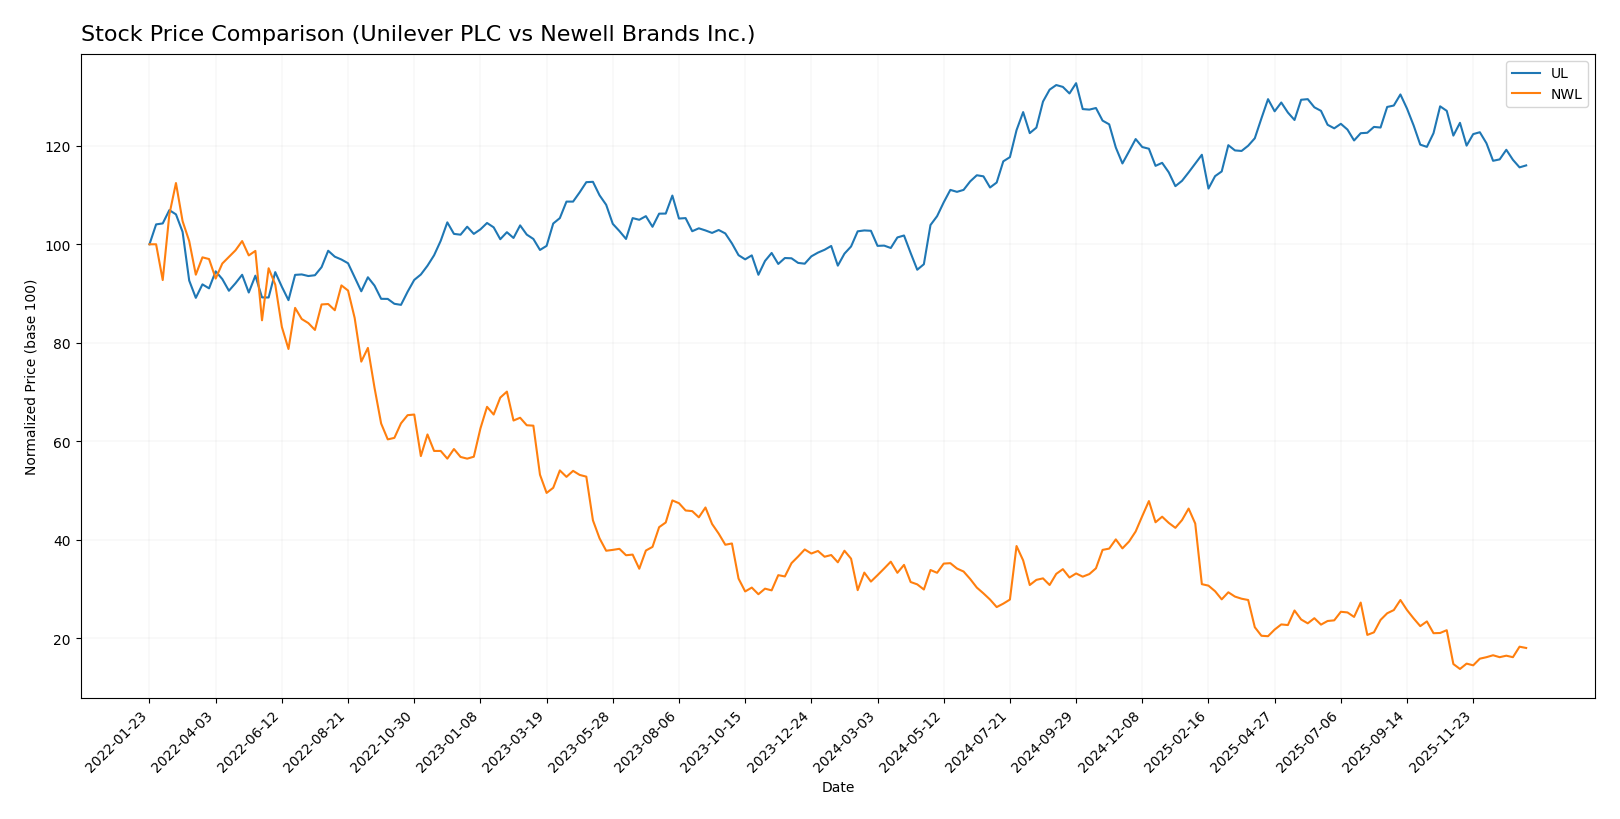
The stock price movements of Unilever PLC and Newell Brands Inc. over the past 12 months show contrasting trends with substantial price shifts and evolving trading volumes, highlighting differing market dynamics and momentum patterns.
Trend Analysis
Unilever PLC’s stock exhibited a bullish trend over the past year with a 12.92% price increase, though recent months show a deceleration and a slight negative adjustment of -4.96%. Volatility remains moderate with a 4.86 std deviation.
Newell Brands Inc. experienced a bearish trend overall, falling by 42.76% in the last year but showing recent acceleration with a 22.06% price recovery. Its volatility is lower, reflected by a 1.87 std deviation.
Comparing the two, Unilever PLC delivered the highest market performance over the year with sustained gains, despite recent pullbacks, while Newell Brands showed a deeper decline but recent positive momentum.
Target Prices
The current analyst consensus presents a balanced outlook for Unilever PLC and Newell Brands Inc.
| Company | Target High | Target Low | Consensus |
|---|---|---|---|
| Unilever PLC | 71 | 60.1 | 65.55 |
| Newell Brands Inc. | 7 | 4 | 5.08 |
Unilever’s consensus target price of 65.55 USD slightly exceeds its current price of 64.42 USD, indicating moderate upside potential. Newell Brands’ consensus at 5.08 USD is notably above its current 4.15 USD, suggesting cautious optimism among analysts.
Analyst Opinions Comparison
This section compares analysts’ ratings and grades for Unilever PLC and Newell Brands Inc.:
Rating Comparison
UL Rating
- Rating: B+, considered Very Favorable by analysts.
- Discounted Cash Flow Score: 5, indicating a very favorable valuation outlook.
- ROE Score: 5, shows high efficiency in generating profit from equity.
- ROA Score: 4, reflecting favorable asset utilization.
- Debt To Equity Score: 1, signaling very unfavorable financial risk.
- Overall Score: 3, a moderate overall financial standing.
NWL Rating
- Rating: C+, also considered Very Favorable by analysts.
- Discounted Cash Flow Score: 5, similarly very favorable valuation outlook.
- ROE Score: 1, indicating very unfavorable profitability from equity.
- ROA Score: 1, suggesting very unfavorable asset utilization.
- Debt To Equity Score: 1, also very unfavorable financial risk.
- Overall Score: 2, reflecting a moderate but lower overall financial standing.
Which one is the best rated?
Unilever PLC holds a clearly better rating profile with a B+ rating, superior ROE and ROA scores, and a higher overall score of 3 compared to Newell Brands Inc.’s C+ rating and overall score of 2. Both share unfavorable debt-to-equity scores.
Scores Comparison
Here is a comparison of the Altman Z-Score and Piotroski Score for Unilever PLC and Newell Brands Inc.:
UL Scores
- Altman Z-Score: 4.85, indicating a safe zone, low bankruptcy risk.
- Piotroski Score: 6, showing average financial strength.
NWL Scores
- Altman Z-Score: 0.51, in distress zone, high bankruptcy risk.
- Piotroski Score: 4, showing average financial strength.
Which company has the best scores?
Unilever PLC has a significantly higher Altman Z-Score, placing it in a safer financial zone compared to Newell Brands Inc., while both have average Piotroski Scores, with UL slightly higher.
Grades Comparison
The following section compares the latest available grades from reputable financial institutions for Unilever PLC and Newell Brands Inc.:
Unilever PLC Grades
The table below shows recent grade changes and recommendations from notable grading companies for Unilever PLC.
| Grading Company | Action | New Grade | Date |
|---|---|---|---|
| Erste Group | Downgrade | Hold | 2024-11-19 |
| B of A Securities | Upgrade | Buy | 2024-08-22 |
| JP Morgan | Upgrade | Overweight | 2024-05-23 |
| Argus Research | Maintain | Buy | 2024-05-08 |
| Morgan Stanley | Downgrade | Underweight | 2024-02-27 |
| Bernstein | Upgrade | Market Perform | 2022-03-14 |
| Bernstein | Upgrade | Market Perform | 2022-03-13 |
| Bernstein | Upgrade | Market Perform | 2021-11-01 |
| Bernstein | Upgrade | Market Perform | 2021-10-31 |
| Deutsche Bank | Downgrade | Hold | 2021-09-16 |
Overall, Unilever’s grades show a mixed but predominantly moderate outlook, with several upgrades to market perform and buy ratings but recent downgrades to hold and underweight.
Newell Brands Inc. Grades
The table below details recent grades and actions from credible grading companies for Newell Brands Inc.
| Grading Company | Action | New Grade | Date |
|---|---|---|---|
| Citigroup | Maintain | Neutral | 2025-12-17 |
| UBS | Maintain | Neutral | 2025-12-02 |
| Canaccord Genuity | Maintain | Buy | 2025-11-03 |
| RBC Capital | Maintain | Sector Perform | 2025-11-03 |
| JP Morgan | Maintain | Overweight | 2025-11-03 |
| Citigroup | Maintain | Neutral | 2025-11-03 |
| JP Morgan | Maintain | Overweight | 2025-10-23 |
| Citigroup | Maintain | Neutral | 2025-10-09 |
| Citigroup | Maintain | Neutral | 2025-09-16 |
| Canaccord Genuity | Maintain | Buy | 2025-08-04 |
Newell Brands’ grades consistently reflect a steady neutral to overweight/buy stance, with no recent downgrades or upgrades, indicating a stable consensus.
Which company has the best grades?
Newell Brands has generally received steadier and slightly more favorable grades, mainly neutral to buy/overweight, compared to Unilever’s more fluctuating ratings ranging from underweight to buy. For investors, Newell’s stable ratings may indicate more predictable analyst confidence, while Unilever’s mixed grades suggest cautious optimism with some concerns.
Strengths and Weaknesses
The table below summarizes key strengths and weaknesses of Unilever PLC and Newell Brands Inc. based on recent financial and strategic indicators.
| Criterion | Unilever PLC (UL) | Newell Brands Inc. (NWL) |
|---|---|---|
| Diversification | Broad global consumer goods portfolio | Diverse product segments, strong in Home & Learning sectors |
| Profitability | ROIC 11.12%, ROE 28.73%, net margin 9.45% (slightly favorable) | Low ROIC 0.64%, negative ROE and net margin (unfavorable) |
| Innovation | Moderate innovation; stable asset turnover (5.21 fixed asset turnover) | Improving profitability trend suggests growing innovation capacity |
| Global presence | Strong global footprint with consistent value creation | Primarily focused on North American market with some global reach |
| Market Share | Solid brand recognition, stable market share | Market share pressures reflected in negative margins and debt levels |
Key takeaways: Unilever shows consistent value creation with strong profitability and global presence, though profitability is slightly declining. Newell Brands is currently shedding value but improving profitability, indicating potential turnaround opportunities. Investors should weigh Unilever’s stability against Newell’s growth prospects and higher risks.
Risk Analysis
Below is a summary table of key risks for Unilever PLC and Newell Brands Inc. based on the most recent 2024 data:
| Metric | Unilever PLC (UL) | Newell Brands Inc. (NWL) |
|---|---|---|
| Market Risk | Low beta of 0.223, indicating low volatility | Moderate beta of 0.888, higher volatility risk |
| Debt level | Debt-to-equity 1.53 (unfavorable); interest coverage 10.06 (favorable) | Debt-to-equity 1.86 (unfavorable); interest coverage 0.12 (very unfavorable) |
| Regulatory Risk | Moderate, operates globally with diverse regulations | Moderate, US-based with exposure to regulatory changes |
| Operational Risk | Large workforce (116K) and diversified product lines reduce risk | Smaller workforce (24K) but multiple segments increase complexity |
| Environmental Risk | Active in sustainability efforts but faces scrutiny in consumer goods | Moderate exposure; less prominent sustainability profile |
| Geopolitical Risk | UK-based with global markets exposure, moderate risk | US-based, mainly North American exposure, moderate risk |
In synthesis, Unilever presents lower market risk due to its low beta and strong interest coverage, though its debt level warrants caution. Newell Brands faces higher financial stress with poor interest coverage and negative profitability, increasing operational and financial risks. The most impactful risk for Newell is its distressed financial health, while Unilever’s main concern is leverage despite stable operations.
Which Stock to Choose?
Unilever PLC (UL) shows a stable income evolution with a 19.79% revenue growth over 2020-2024 and a favorable global income statement evaluation. Its profitability is strong, with a ROE of 28.73% and ROIC of 11.12%, though debt levels and liquidity ratios are unfavorable. The company holds a very favorable B+ rating and a slightly favorable moat despite a declining ROIC trend.
Newell Brands Inc. (NWL) displays a mixed income evolution, with a recent 6.77% revenue decline but strong net income growth overall. Profitability remains weak with negative ROE and low ROIC, coupled with high net debt to EBITDA. Its rating is a moderate C+, reflecting financial challenges and a slightly unfavorable moat, although recent ROIC is growing.
Investors focused on stable profitability and value creation might find Unilever’s profile more appealing, while those with a higher risk tolerance and interest in turnaround potential could see Newell’s improving ROIC as a positive signal. The choice could depend on an investor’s preference for established value versus recovery prospects.
Disclaimer: Investment carries a risk of loss of initial capital. The past performance is not a reliable indicator of future results. Be sure to understand risks before making an investment decision.
Go Further
I encourage you to read the complete analyses of Unilever PLC and Newell Brands Inc. to enhance your investment decisions: