Home > Comparison > Consumer Defensive > PG vs NWL
The strategic rivalry between The Procter & Gamble Company and Newell Brands Inc. shapes the consumer defensive sector’s competitive landscape. Procter & Gamble operates as a diversified, global leader with a broad portfolio of branded household and personal products. In contrast, Newell Brands focuses on niche consumer and commercial goods with a varied brand mix. This analysis evaluates which company’s operational model offers superior risk-adjusted returns for a balanced investment portfolio.
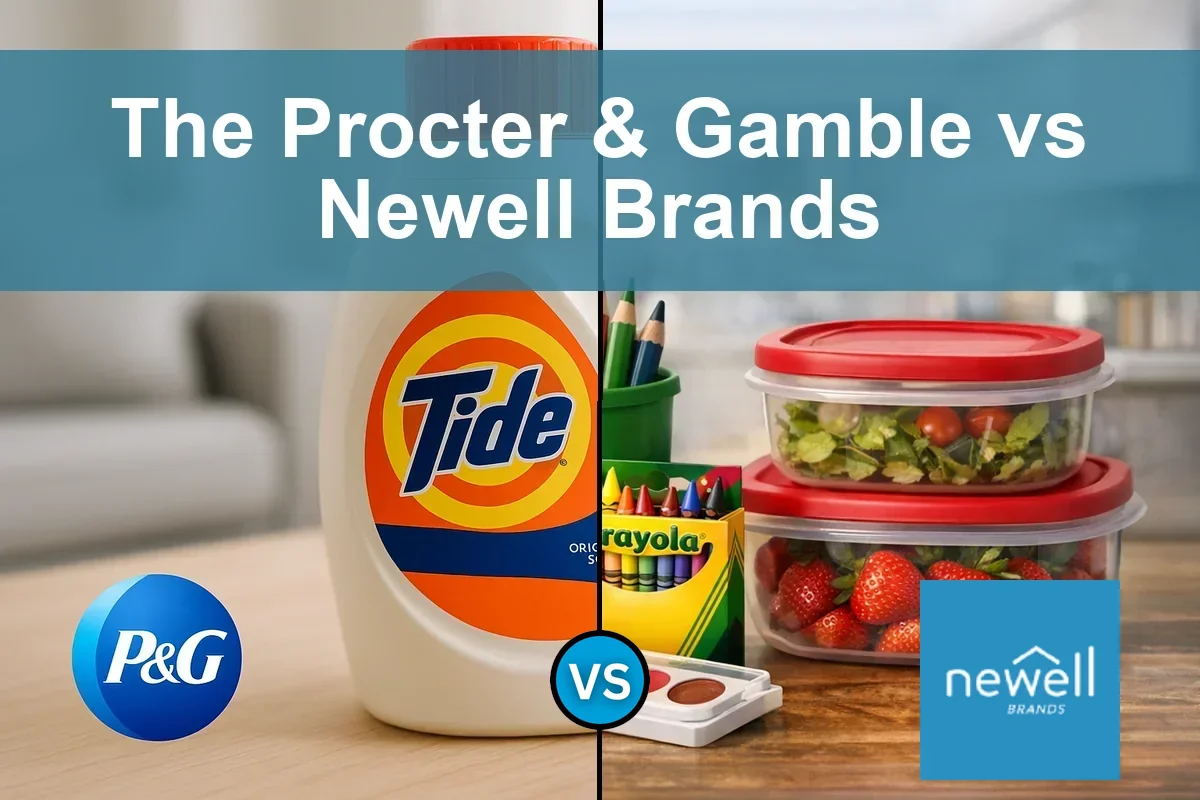
Table of contents
Companies Overview
Two stalwarts in the household and personal products space dominate diverse consumer markets globally.
The Procter & Gamble Company: Global Consumer Goods Powerhouse
The Procter & Gamble Company stands as a leader in branded consumer packaged goods worldwide. It generates revenue mainly through five key segments including Beauty, Grooming, and Health Care. In 2026, it sharpens focus on expanding its premium brand portfolio while enhancing distribution channels across mass merchandisers and e-commerce platforms.
Newell Brands Inc.: Diverse Consumer Products Specialist
Newell Brands Inc. operates across five segments, from Commercial Solutions to Outdoor and Recreation, designing and distributing a broad array of consumer and commercial products. Its revenue engine relies on leveraging well-known franchises like Rubbermaid and Coleman. In 2026, the company emphasizes innovation and channel diversification, targeting warehouse clubs and specialty retailers.
Strategic Collision: Similarities & Divergences
Both companies operate in the consumer defensive sector but differ in strategy. Procter & Gamble pursues a focused brand-driven approach with a vast global reach, while Newell Brands relies on diversified product lines and niche markets. Their primary battleground is market penetration in household goods. Investment profiles differ sharply: P&G offers scale and stability; Newell offers growth through breadth and innovation.
Income Statement Comparison
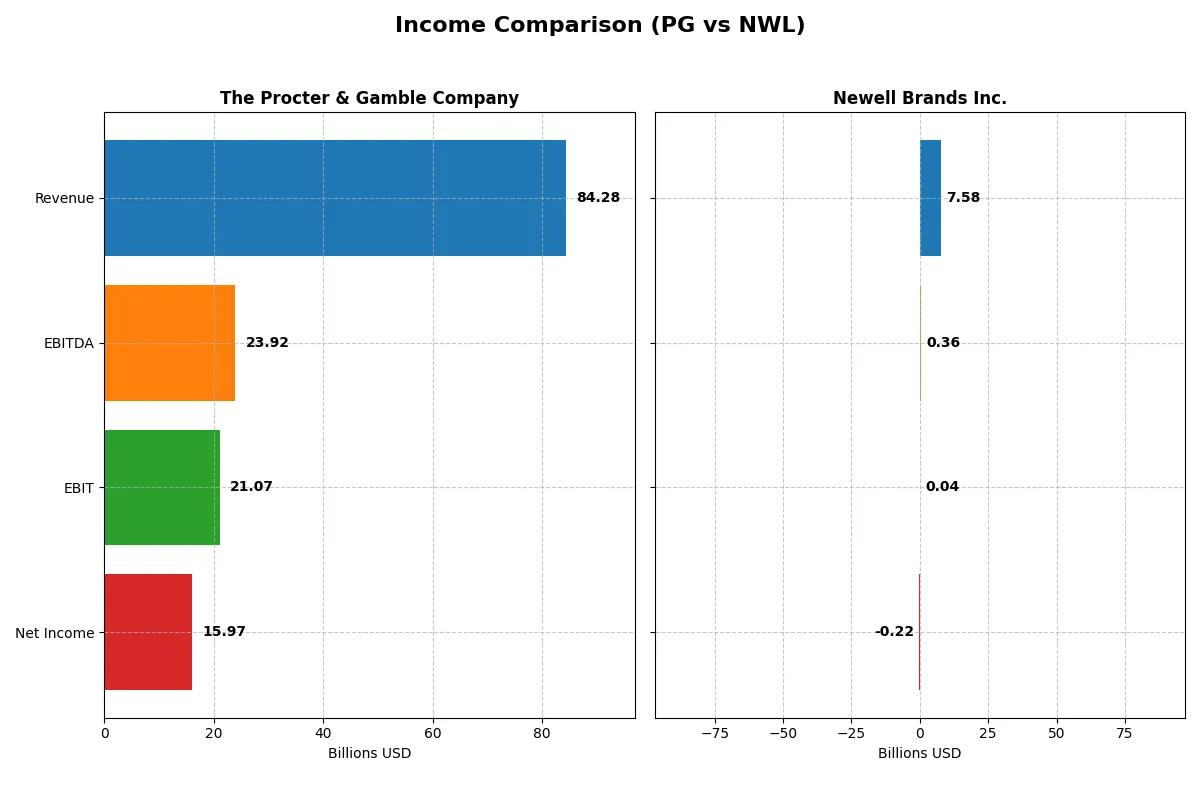
This data dissects the core profitability and scalability of both corporate engines to reveal who dominates the bottom line:
| Metric | The Procter & Gamble Company (PG) | Newell Brands Inc. (NWL) |
|---|---|---|
| Revenue | 84.3B | 7.6B |
| Cost of Revenue | 41.2B | 5.0B |
| Operating Expenses | 22.7B | 2.5B |
| Gross Profit | 43.1B | 2.5B |
| EBITDA | 23.9B | 358M |
| EBIT | 21.1B | 35M |
| Interest Expense | 907M | 295M |
| Net Income | 15.97B | -216M |
| EPS | 6.67 | -0.52 |
| Fiscal Year | 2025 | 2024 |
Income Statement Analysis: The Bottom-Line Duel
This income statement comparison reveals which company operates with superior efficiency and delivers stronger profitability under current market conditions.
The Procter & Gamble Company Analysis
Procter & Gamble’s revenue steadily climbed from 76B in 2021 to 84B in 2025, showing solid growth momentum. Net income rose from 14.3B to nearly 16B, reflecting robust earnings power. The gross margin holds firm above 51%, and the net margin approaches 19%, underscoring strong operational discipline and favorable cost management in 2025.
Newell Brands Inc. Analysis
Newell’s revenue declined from 10.6B in 2021 to 7.6B in 2024, signaling shrinking top-line scale. Despite this, net losses narrowed significantly, from -770M in 2020 to -216M in 2024, indicating improving profitability trends. The gross margin at 34% is modest, and the net margin remains negative, reflecting ongoing challenges in cost control and margin recovery.
Margin Strength vs. Revenue Resilience
Procter & Gamble clearly dominates with consistent revenue growth and strong margins, delivering nearly 19% net profitability in 2025. Newell shows cautious improvement but still suffers from negative net margins amid declining sales. For investors prioritizing stable earnings and margin strength, Procter & Gamble’s profile offers a more reliable and attractive income statement foundation.
Financial Ratios Comparison
These vital ratios act as a diagnostic tool to expose the underlying fiscal health, valuation premiums, and capital efficiency of the companies compared below:
| Ratios | The Procter & Gamble Company (PG) | Newell Brands Inc. (NWL) |
|---|---|---|
| ROE | 30.7% | -7.9% |
| ROIC | 16.5% | 0.6% |
| P/E | 24.5 | -19.2 |
| P/B | 7.52 | 1.50 |
| Current Ratio | 0.70 | 1.14 |
| Quick Ratio | 0.49 | 0.56 |
| D/E | 0.68 | 1.86 |
| Debt-to-Assets | 28.3% | 46.6% |
| Interest Coverage | 22.5 | 0.23 |
| Asset Turnover | 0.67 | 0.69 |
| Fixed Asset Turnover | 3.53 | 4.67 |
| Payout Ratio | 61.8% | -54.6% |
| Dividend Yield | 2.52% | 2.85% |
| Fiscal Year | 2025 | 2024 |
Efficiency & Valuation Duel: The Vital Signs
Ratios serve as a company’s DNA, revealing hidden risks and operational excellence that shape investor confidence and valuation.
The Procter & Gamble Company
Procter & Gamble demonstrates strong profitability with a 30.7% ROE and an 18.9% net margin, reflecting operational efficiency. Its P/E ratio at 24.5 appears fairly valued amid a solid 16.5% ROIC exceeding its 5.4% WACC, indicating value creation. The 2.5% dividend yield rewards shareholders consistently, underlining a balanced capital allocation approach.
Newell Brands Inc.
Newell struggles with negative profitability, showing a -7.9% ROE and a -2.9% net margin, signaling operational challenges. While its P/E ratio is negative due to losses, the enterprise value to sales ratio of 1.2 suggests a cheaper valuation relative to P&G. A 2.9% dividend yield provides some shareholder return despite weak cash flow and high leverage concerns.
Premium Valuation vs. Operational Fragility
Procter & Gamble offers a superior balance of profitability and valuation discipline, supported by robust returns and consistent dividends. Newell’s valuation appears cheaper but masks operational weakness and financial risk. Investors seeking stability will find P&G’s profile more fitting, while Newell suits those tolerating higher risk for potential turnaround.
Which one offers the Superior Shareholder Reward?
I see Procter & Gamble (PG) balances a 2.5% dividend yield with a 62% payout ratio, backed by strong free cash flow coverage (~79%). It also executes consistent buybacks, supporting total returns. Newell Brands (NWL) yields higher at 2.85%-5.1%, but with volatile and negative earnings, weak cash flow, and heavy debt. NWL’s buybacks are minimal and unsustainable. Historically in consumer staples, steady dividends plus disciplined buybacks like PG’s drive durable shareholder value. I conclude PG offers a superior, more reliable total return profile in 2026.
Comparative Score Analysis: The Strategic Profile
The radar chart reveals the fundamental DNA and trade-offs of The Procter & Gamble Company and Newell Brands Inc.:
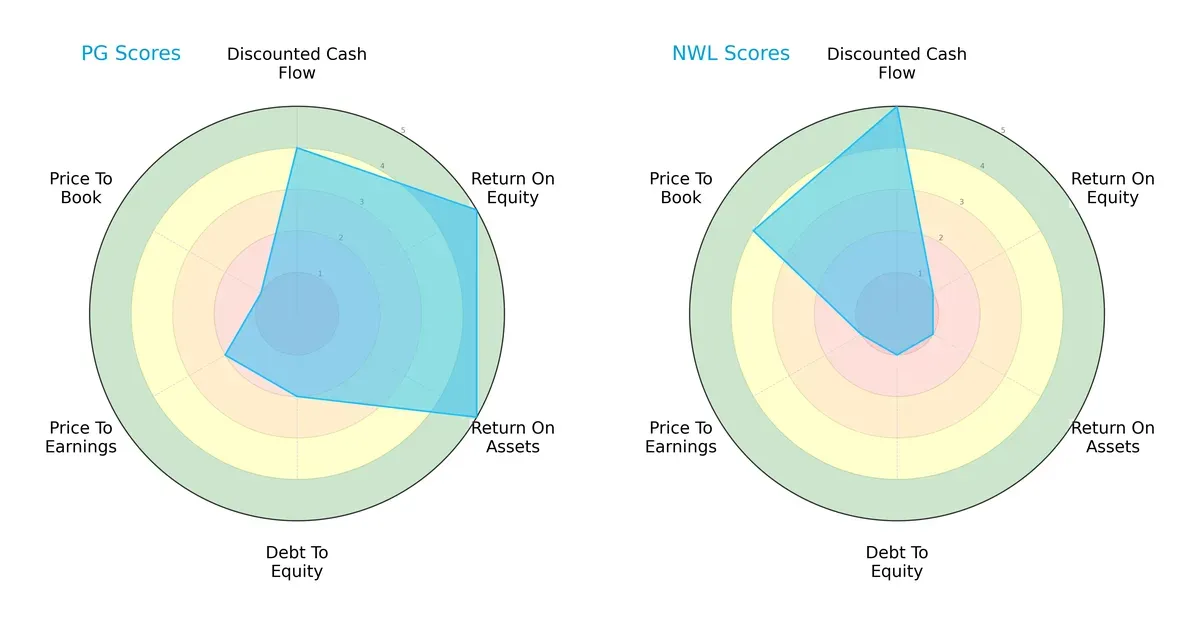
Procter & Gamble shows strength in ROE (5) and ROA (5), signaling efficient profit generation and asset use. Its debt-to-equity score (2) is moderate, reflecting balanced leverage. Newell excels in discounted cash flow (5) and price-to-book (4), indicating potential undervaluation but suffers from weak profitability scores (ROE 1, ROA 1) and high financial risk (debt-to-equity 1). P&G presents a more balanced profile, while Newell relies heavily on valuation metrics.
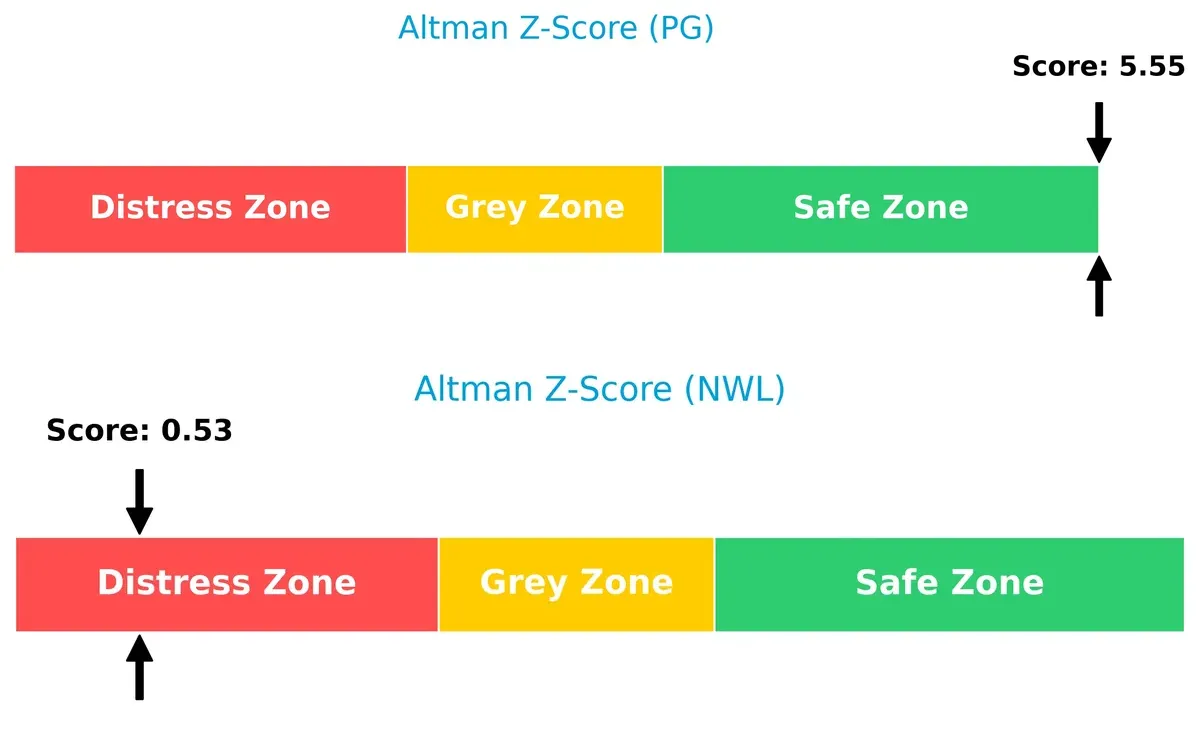
Bankruptcy Risk: Solvency Showdown
Procter & Gamble’s Altman Z-Score of 5.55 puts it firmly in the safe zone, while Newell’s 0.53 signals distress, highlighting a stark contrast in long-term survival:
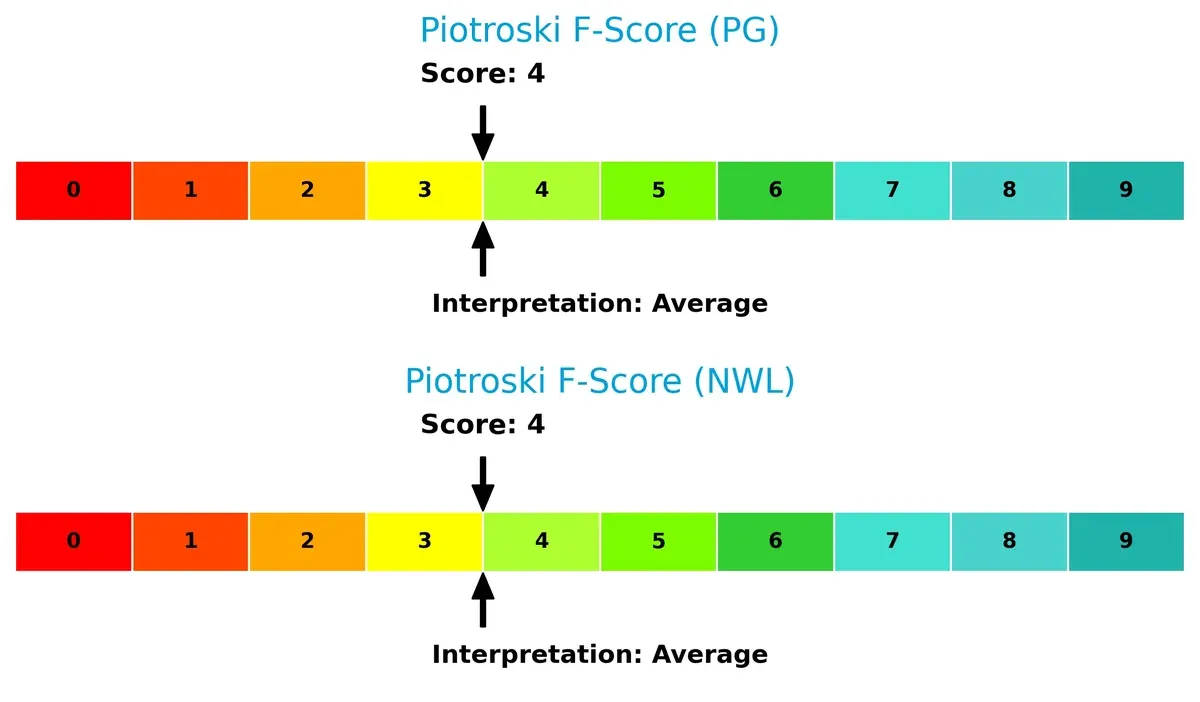
Financial Health: Quality of Operations
Both companies share an average Piotroski F-Score of 4, indicating moderate financial health. Neither exhibits peak operational strength, but Newell’s distress-level Z-Score flags deeper underlying risks:
How are the two companies positioned?
This section dissects the operational DNA of PG and NWL by comparing their revenue distribution by segment and internal dynamics. The goal is to confront their economic moats and identify which model offers the most resilient, sustainable competitive advantage today.
Revenue Segmentation: The Strategic Mix
This comparison dissects how The Procter & Gamble Company and Newell Brands Inc. diversify their income streams and reveals their primary sector bets:
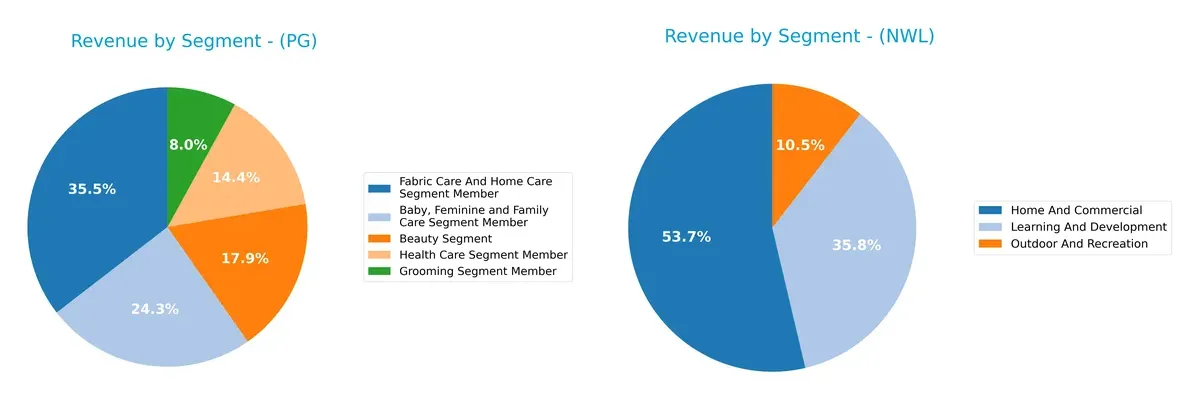
Procter & Gamble leans on Fabric Care and Home Care, generating $29.6B, anchoring its revenue mix. It maintains a balanced portfolio with $20.2B in Baby, Feminine and Family Care and $15B in Beauty. Newell Brands concentrates around Home and Commercial at $4.1B and Learning and Development at $2.7B, showing less diversification. P&G’s broad segmentation reduces concentration risk, while Newell’s narrower focus could expose it to sector-specific volatility.
Strengths and Weaknesses Comparison
This table compares the Strengths and Weaknesses of The Procter & Gamble Company (PG) and Newell Brands Inc. (NWL):
PG Strengths
- Diversified segments with strong revenue across five major categories
- Favorable net margin at 18.95% and ROE at 30.71%
- Global presence with nearly equal US and Non-US revenue around 42B each
- Favorable debt-to-assets ratio at 28.32% and strong interest coverage of 23.23x
NWL Strengths
- Diversified product portfolio with multiple segments including Home and Commercial
- Favorable WACC and dividend yield at 2.85%
- Neutral current ratio at 1.14 indicating reasonable liquidity
- Favorable fixed asset turnover at 4.67 indicating efficient use of assets
PG Weaknesses
- Low liquidity ratios with current ratio 0.7 and quick ratio 0.49 below 1.0
- Unfavorable price-to-book at 7.52 indicating high valuation
- Neutral debt-to-equity at 0.68 with potential leverage concerns
NWL Weaknesses
- Negative profitability with net margin -2.85% and ROE -7.85%
- High debt-to-equity at 1.86 and poor interest coverage at 0.12x
- Unfavorable quick ratio at 0.56 indicating liquidity risk
The Procter & Gamble Company demonstrates robust profitability and balanced global sales but shows liquidity constraints. Newell Brands struggles with profitability and leverage but maintains some operational efficiency and liquidity stability. These contrasts suggest divergent strategic priorities and risk profiles.
The Moat Duel: Analyzing Competitive Defensibility
A structural moat is the critical barrier that protects long-term profits from relentless competition erosion:
The Procter & Gamble Company: Brand Power and Scale Advantage
I see P&G’s moat rooted in strong intangible assets—iconic brands and massive scale. This drives premium pricing and stable 25% EBIT margins. In 2026, innovation in health and home care could deepen this moat.
Newell Brands Inc.: Turnaround Potential with Operational Leverage
Newell’s moat relies on cost advantages and a diverse product portfolio, but it lacks P&G’s brand strength. Its near-zero EBIT margin signals weak defensibility. The recent ROIC rebound hints at a potential moat build if growth sustains.
Moat Battle: Iconic Brands vs. Operational Recovery
P&G’s wide moat from enduring brand equity and consistent 11% ROIC above WACC outmatches Newell’s slight value destruction despite improving ROIC. P&G stands better poised to defend market share through scale and innovation.
Which stock offers better returns?
The past year shows divergent trajectories for these stocks, with sharp declines offset by recent rebounds. Trading volumes increased, reflecting renewed investor interest and shifting market dynamics.
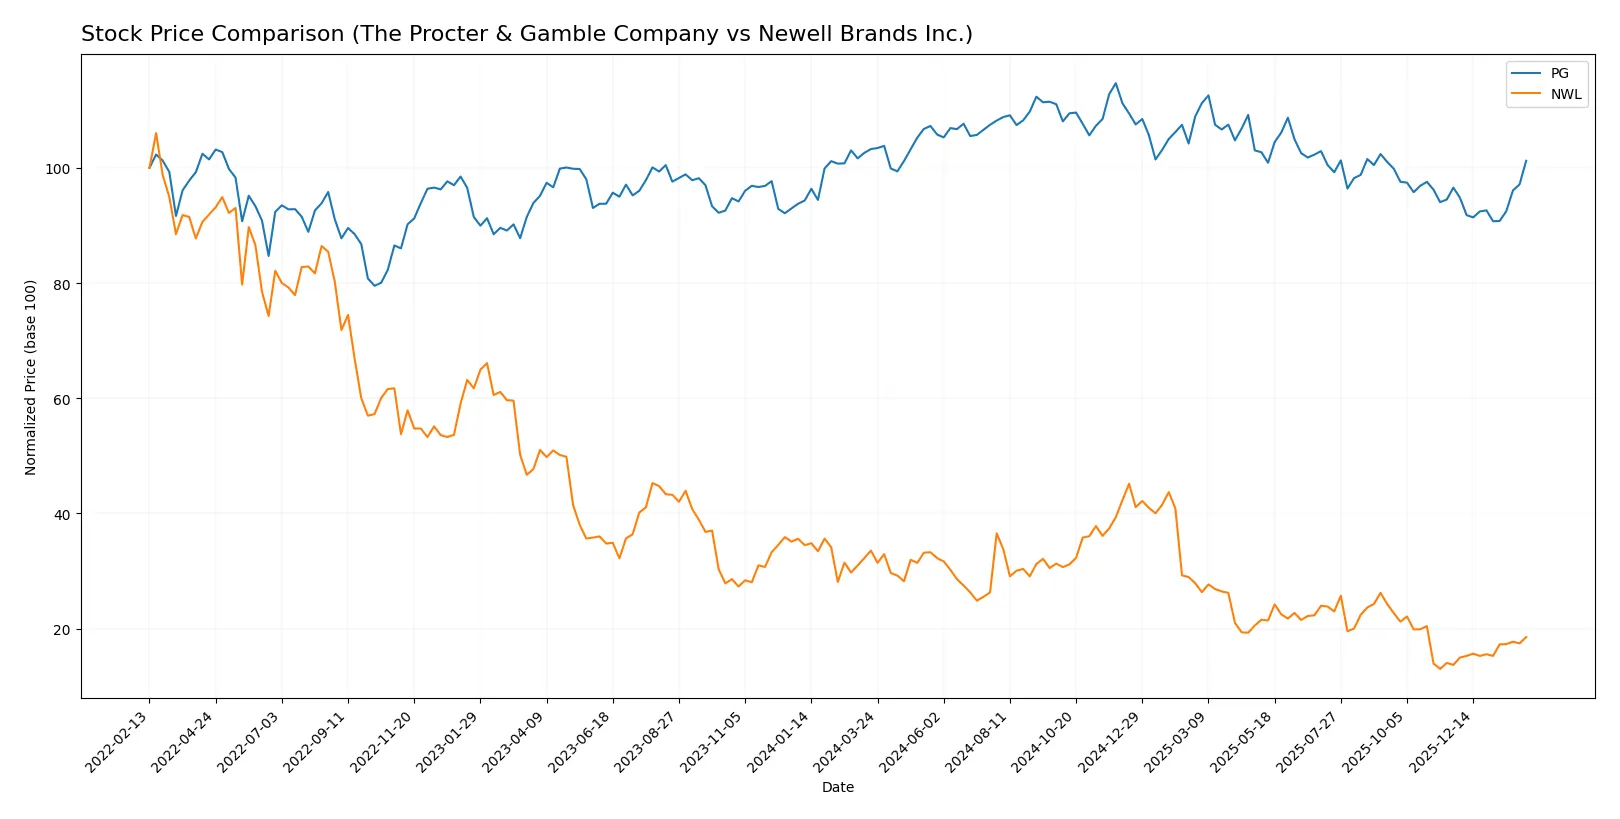
Trend Comparison
The Procter & Gamble Company (PG) displays a bearish trend over 12 months with a -1.97% price change and accelerating decline. It reached a high of 179.26 and a low of 141.79, showing moderate volatility with an 8.85 standard deviation.
Newell Brands Inc. (NWL) suffers a pronounced bearish trend, dropping -44.81% over the year amid accelerating losses. Its price ranged from 11.01 to 3.17, with lower volatility evident from a 1.9 standard deviation.
Comparing both, PG’s trend is less severe and closer to neutral, while NWL shows a much steeper decline. PG delivered the highest market performance over the past 12 months.
Target Prices
Analysts show a mixed but generally optimistic target consensus for these consumer goods companies.
| Company | Target Low | Target High | Consensus |
|---|---|---|---|
| The Procter & Gamble Company | 150 | 179 | 165.67 |
| Newell Brands Inc. | 4.25 | 8 | 5.58 |
Procter & Gamble’s consensus target surpasses its current price of 158.14, indicating moderate upside potential. Newell Brands’ target consensus sits slightly above its current 4.50 price, signaling cautious optimism.

Don’t Let Luck Decide Your Entry Point
Optimize your entry points with our advanced ProRealTime indicators. You’ll get efficient buy signals with precise price targets for maximum performance. Start outperforming now!
How do institutions grade them?
Here are the institutional grades for The Procter & Gamble Company and Newell Brands Inc.:
The Procter & Gamble Company Grades
The following table summarizes recent grades and actions from key financial institutions:
| Grading Company | Action | New Grade | Date |
|---|---|---|---|
| TD Cowen | Downgrade | Hold | 2026-01-27 |
| Wells Fargo | Maintain | Overweight | 2026-01-23 |
| UBS | Maintain | Buy | 2026-01-23 |
| JP Morgan | Upgrade | Overweight | 2026-01-23 |
| UBS | Maintain | Buy | 2026-01-14 |
| TD Cowen | Maintain | Buy | 2026-01-08 |
| Wells Fargo | Maintain | Overweight | 2026-01-05 |
| JP Morgan | Maintain | Neutral | 2025-12-18 |
| Jefferies | Upgrade | Buy | 2025-12-17 |
| JP Morgan | Maintain | Neutral | 2025-10-27 |
Newell Brands Inc. Grades
This table presents the latest grading data from major rating firms:
| Grading Company | Action | New Grade | Date |
|---|---|---|---|
| Canaccord Genuity | Maintain | Buy | 2026-01-26 |
| Citigroup | Maintain | Neutral | 2026-01-14 |
| UBS | Maintain | Neutral | 2026-01-14 |
| Citigroup | Maintain | Neutral | 2025-12-17 |
| UBS | Maintain | Neutral | 2025-12-02 |
| RBC Capital | Maintain | Sector Perform | 2025-11-03 |
| Canaccord Genuity | Maintain | Buy | 2025-11-03 |
| JP Morgan | Maintain | Overweight | 2025-11-03 |
| Citigroup | Maintain | Neutral | 2025-11-03 |
| JP Morgan | Maintain | Overweight | 2025-10-23 |
Which company has the best grades?
The Procter & Gamble Company holds generally stronger grades, including multiple Buy and Overweight ratings. Newell Brands Inc. mostly receives Neutral and Overweight grades. Investors may view Procter & Gamble’s higher ratings as a sign of greater confidence from analysts.
Risks specific to each company
The following categories identify the critical pressure points and systemic threats facing both firms in the 2026 market environment:
1. Market & Competition
The Procter & Gamble Company
- Dominates large consumer packaged goods with strong brands and global reach, but faces intense competition in premium segments.
Newell Brands Inc.
- Operates in diverse but fragmented consumer products segments, struggling with brand differentiation and market share losses.
2. Capital Structure & Debt
The Procter & Gamble Company
- Maintains moderate leverage (D/E 0.68) with strong interest coverage (23.23x), signaling financial stability.
Newell Brands Inc.
- High leverage (D/E 1.86) and weak interest coverage (0.12x) raise concerns about refinancing risk and solvency.
3. Stock Volatility
The Procter & Gamble Company
- Low beta (0.38) reflects defensive stock behavior, reducing volatility risk for investors.
Newell Brands Inc.
- Beta near 0.93 indicates higher stock volatility, exposing investors to larger price swings.
4. Regulatory & Legal
The Procter & Gamble Company
- Faces routine regulatory scrutiny typical for global consumer goods; compliance infrastructure is robust.
Newell Brands Inc.
- Encounters regulatory risks in multiple product categories with less scale to absorb compliance costs.
5. Supply Chain & Operations
The Procter & Gamble Company
- Benefits from a highly integrated global supply chain but exposed to raw material inflation and logistics disruptions.
Newell Brands Inc.
- Supply chain complexity and smaller scale raise vulnerability to operational inefficiencies and cost pressures.
6. ESG & Climate Transition
The Procter & Gamble Company
- Advanced ESG initiatives strengthen brand loyalty but require continuous capital investment amid rising regulatory demands.
Newell Brands Inc.
- ESG efforts are emerging but lag industry leaders, potentially risking investor and consumer backlash.
7. Geopolitical Exposure
The Procter & Gamble Company
- Extensive global footprint entails exposure to trade tensions and currency fluctuations but benefits from geographic diversification.
Newell Brands Inc.
- More concentrated North American exposure limits geopolitical risk but offers less growth from emerging markets.
Which company shows a better risk-adjusted profile?
Procter & Gamble’s dominant market position and strong financial health create a substantially better risk-adjusted profile. Newell Brands’ heavy debt burden and weak profitability pose significant risk, underscored by its distress zone Altman Z-score. The most impactful risk for P&G is supply chain inflation, while for Newell, it is financial distress from excessive leverage. Notably, P&G’s interest coverage of 23.23x versus Newell’s 0.12x justifies my heightened concern for Newell’s solvency risks.
Final Verdict: Which stock to choose?
The Procter & Gamble Company wields unmatched efficiency in capital allocation, consistently generating returns well above its cost of capital. Its robust cash flow engine supports steady dividends, making it a reliable choice. However, a low current ratio signals a liquidity point of vigilance. PG suits portfolios aiming for stable, long-term growth.
Newell Brands Inc. offers a strategic moat in its potential turnaround and asset repositioning, reflected in improving ROIC trends despite past value destruction. Its lower valuation and higher recent price momentum provide a speculative edge. Relative to PG, NWL carries higher risk but could appeal to investors seeking contrarian opportunities and value recovery plays.
If you prioritize capital preservation and consistent profitability, PG outshines NWL with its proven moat and cash flow strength. However, if you seek growth through restructuring and are comfortable with elevated risk, NWL offers better upside potential driven by operational improvements and market re-rating. Both scenarios demand close monitoring of liquidity and leverage risks.
Disclaimer: Investment carries a risk of loss of initial capital. The past performance is not a reliable indicator of future results. Be sure to understand risks before making an investment decision.
Go Further
I encourage you to read the complete analyses of The Procter & Gamble Company and Newell Brands Inc. to enhance your investment decisions: