In the competitive world of household and personal products, The Estée Lauder Companies Inc. (EL) and Newell Brands Inc. (NWL) stand out as influential players with distinct market approaches. Estée Lauder leads in luxury beauty and skincare innovation, while Newell focuses on diverse consumer and commercial goods. This comparison explores their strategies, market positions, and growth potential to help you identify which company might best enhance your investment portfolio. Let’s dive in to find the more compelling opportunity for investors.

Table of contents
Companies Overview
I will begin the comparison between The Estée Lauder Companies Inc. and Newell Brands Inc. by providing an overview of these two companies and their main differences.
The Estée Lauder Companies Inc. Overview
The Estée Lauder Companies Inc. focuses on manufacturing, marketing, and selling a broad range of skin care, makeup, fragrance, and hair care products worldwide. Its portfolio includes premium brands such as Clinique, MAC, and La Mer. Positioned in the Household & Personal Products industry, Estée Lauder operates through diverse retail channels including department stores, specialty retailers, and e-commerce platforms. The company is headquartered in New York City and employs approximately 44K people.
Newell Brands Inc. Overview
Newell Brands Inc. designs, manufactures, and distributes consumer and commercial products across five segments: Commercial Solutions, Home Appliances, Home Solutions, Learning and Development, and Outdoor and Recreation. Its portfolio features brands like Rubbermaid, Calphalon, and Coleman. Operating in the same industry as Estée Lauder, Newell serves multiple retail channels including mass merchants and specialty stores. The company is based in Atlanta, Georgia, with around 24K employees.
Key similarities and differences
Both companies operate within the Household & Personal Products sector and maintain diversified brand portfolios distributed through various retail channels. While Estée Lauder specializes in high-end beauty and personal care products, Newell Brands offers a broader range of consumer and commercial goods spanning home appliances, outdoor equipment, and office supplies. Estée Lauder’s focus is more concentrated on premium cosmetics, whereas Newell’s business model covers multiple consumer needs through segmented product lines.
Income Statement Comparison
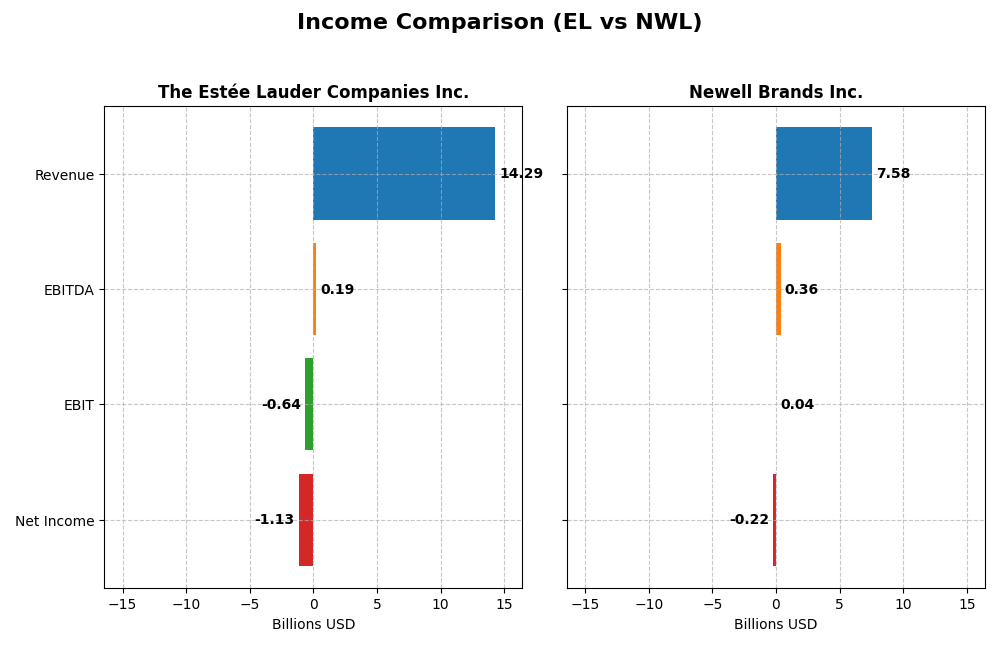
The following table presents the key income statement metrics for The Estée Lauder Companies Inc. and Newell Brands Inc. for their most recent fiscal years, facilitating a direct financial comparison.
| Metric | The Estée Lauder Companies Inc. | Newell Brands Inc. |
|---|---|---|
| Market Cap | 40.7B | 1.74B |
| Revenue | 14.3B | 7.58B |
| EBITDA | 193M | 358M |
| EBIT | -636M | 35M |
| Net Income | -1.13B | -216M |
| EPS | -3.15 | -0.52 |
| Fiscal Year | 2025 | 2024 |
Income Statement Interpretations
The Estée Lauder Companies Inc.
Between 2021 and 2025, Estée Lauder’s revenue declined from $16.2B to $14.3B, with net income swinging from $2.87B profit in 2021 to a $1.13B loss in 2025. Gross margin remained strong near 74%, but EBIT and net margins turned negative in the latest year. The 2025 fiscal year showed deteriorated profitability and declining revenue, signaling operational and profitability challenges.
Newell Brands Inc.
Newell’s revenue fell from $10.6B in 2021 to $7.6B in 2024, with net income shifting from $622M profit to a $216M loss. Gross margin hovered around 34%, while EBIT margin improved slightly to near breakeven in 2024. Despite revenue decline, Newell showed positive EBIT growth and improved net margin recently, reflecting some operational progress amid top-line pressures.
Which one has the stronger fundamentals?
Estée Lauder exhibits higher gross margins but suffered significant net income and EBIT margin deterioration in 2025, indicating weakened profitability. Newell shows lower margins but improved EBIT and net margin trends overall, with favorable growth in net income and earnings per share over the period. Based purely on income statement evaluations, Newell’s fundamentals appear relatively stronger due to recent margin improvement and income growth despite revenue declines.
Financial Ratios Comparison
The table below presents a side-by-side comparison of key financial ratios for The Estée Lauder Companies Inc. (EL) and Newell Brands Inc. (NWL) based on the most recent fiscal year data available.
| Ratios | The Estée Lauder Companies Inc. (EL) | Newell Brands Inc. (NWL) |
|---|---|---|
| ROE | -29.3% (2025) | -7.9% (2024) |
| ROIC | 6.4% (2025) | 0.6% (2024) |
| P/E | -25.7 (2025) | -19.2 (2024) |
| P/B | 7.53 (2025) | 1.50 (2024) |
| Current Ratio | 1.30 (2025) | 1.14 (2024) |
| Quick Ratio | 0.92 (2025) | 0.56 (2024) |
| D/E (Debt-to-Equity) | 2.44 (2025) | 1.86 (2024) |
| Debt-to-Assets | 47.5% (2025) | 46.6% (2024) |
| Interest Coverage | 2.37 (2025) | 0.23 (2024) |
| Asset Turnover | 0.72 (2025) | 0.69 (2024) |
| Fixed Asset Turnover | 2.79 (2025) | 4.67 (2024) |
| Payout Ratio | -54.5% (2025) | -54.6% (2024) |
| Dividend Yield | 2.12% (2025) | 2.85% (2024) |
Interpretation of the Ratios
The Estée Lauder Companies Inc.
The Estée Lauder presents a mixed financial profile with several unfavorable ratios: net margin at -7.93%, ROE at -29.31%, and interest coverage negative at -1.57, indicating profit and debt servicing concerns. Neutral ratios include ROIC at 6.44% and current ratio at 1.3. The dividend yield is favorable at 2.12%, supported by steady dividends despite some risks from negative free cash flow to equity.
Newell Brands Inc.
Newell Brands shows weaker profitability with net margin at -2.85% and ROE at -7.85%, alongside unfavorable quick ratio of 0.56 and interest coverage barely positive at 0.12. It has a favorable WACC of 5.56% and a solid fixed asset turnover of 4.67. Dividend yield is attractive at 2.85%, but free cash flow challenges and high debt require monitoring.
Which one has the best ratios?
Both companies face challenges with profitability and leverage, reflected in their negative net margins and ROE. Newell Brands has a slight edge in favorable ratios, including WACC and fixed asset turnover, while Estée Lauder shows a stronger dividend yield and more neutral liquidity. Overall, both present slightly unfavorable ratio profiles with distinct strengths and risks.
Strategic Positioning
This section compares the strategic positioning of The Estée Lauder Companies Inc. (EL) and Newell Brands Inc. (NWL), including market position, key segments, and exposure to technological disruption:
The Estée Lauder Companies Inc. (EL)
- Leading global player in personal products with strong competitive pressure in cosmetics and skincare sectors.
- Focuses on skin care, makeup, fragrance, and hair care with flagship brands like Estée Lauder and MAC driving revenues.
- Limited explicit exposure to technological disruption; primarily reliant on brand strength and product innovation.
Newell Brands Inc. (NWL)
- Mid-sized consumer products company facing moderate competition across diverse household and commercial markets.
- Operates in Commercial Solutions, Home Appliances, Learning, and Outdoor Recreation segments with broad product diversity.
- No direct mention of technological disruption; operates in mature consumer and commercial product markets.
The Estée Lauder Companies Inc. vs Newell Brands Inc. Positioning
EL pursues a concentrated strategy centered on high-margin beauty and personal care products, leveraging strong brand portfolios. NWL adopts a diversified approach across various consumer and commercial segments, which may dilute focus but spreads market risk.
Which has the best competitive advantage?
Both companies are currently shedding value with ROIC below WACC; however, NWL shows improving profitability trends while EL experiences declining returns, indicating NWL holds a slightly more favorable competitive advantage.
Stock Comparison
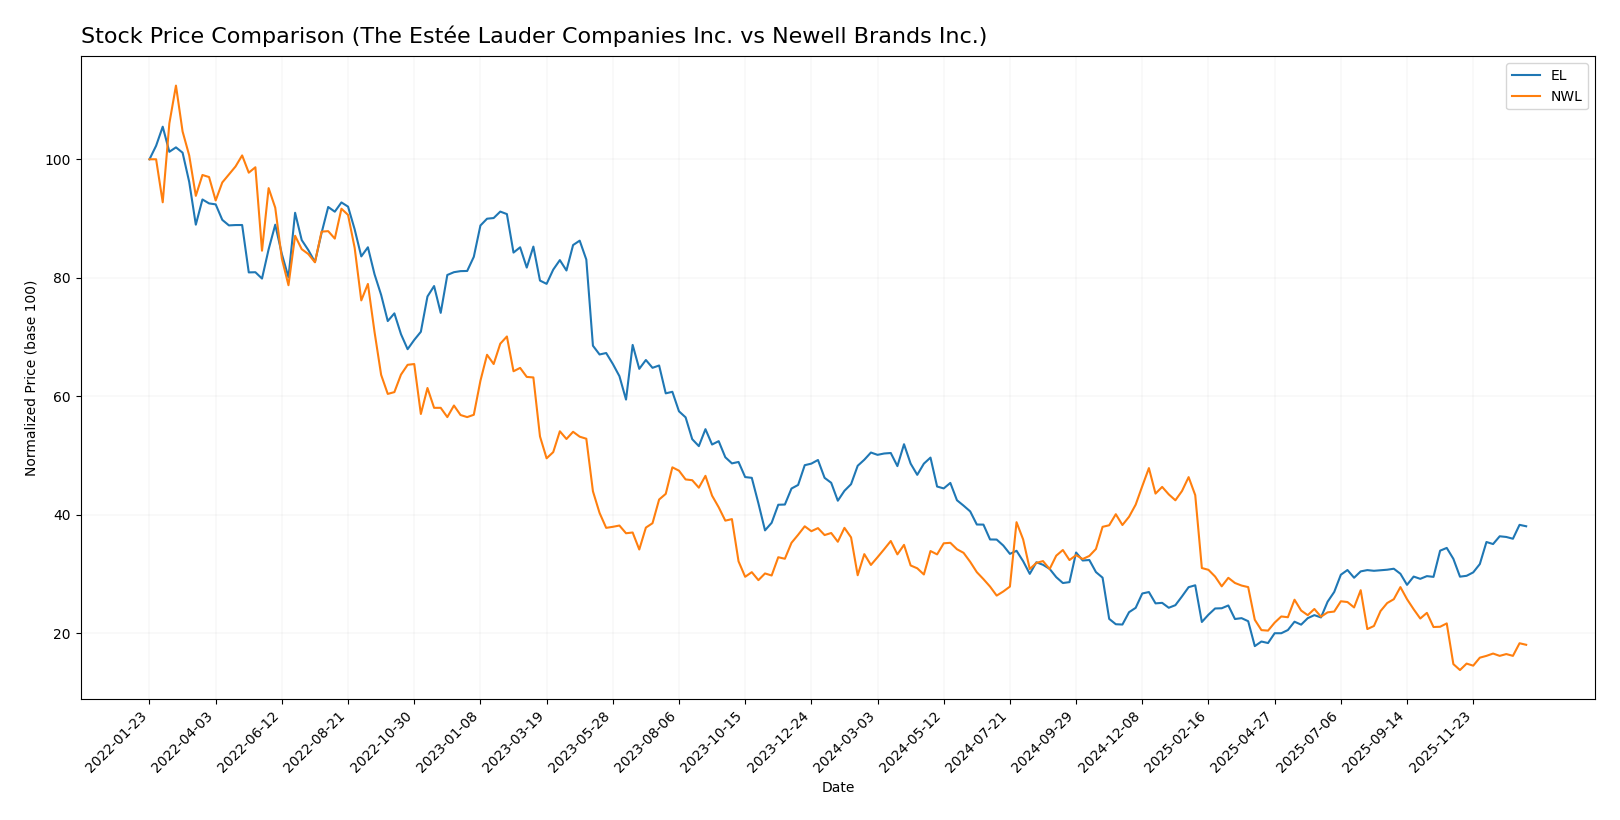
The stock price movements of The Estée Lauder Companies Inc. and Newell Brands Inc. over the past year reveal significant bearish trends with recent signs of recovery and varied trading dynamics.
Trend Analysis
The Estée Lauder Companies Inc. experienced a 24.65% decrease over the past 12 months, indicating a bearish trend with accelerating decline and high volatility, marked by a high of 154.15 and a low of 52.93. Recently, the stock gained 16.89% from November 2025 to January 2026, showing a bullish short-term recovery with moderate volatility.
Newell Brands Inc. saw a 42.76% price drop over the same period, also reflecting a bearish trend with acceleration but significantly lower volatility. Its recent rebound of 22.06% in the last quarter indicates a moderate bullish recovery, though volatility remains minimal.
Comparing the two, Newell Brands Inc. suffered a steeper overall decline but posted a stronger recent rebound. The Estée Lauder Companies Inc. delivered the highest market performance in terms of less severe long-term loss and notable short-term gains.
Target Prices
The current analyst consensus provides a clear target range for both The Estée Lauder Companies Inc. and Newell Brands Inc.
| Company | Target High | Target Low | Consensus |
|---|---|---|---|
| The Estée Lauder Companies Inc. | 130 | 70 | 106.67 |
| Newell Brands Inc. | 7 | 4 | 5.08 |
Analysts expect Estée Lauder’s stock to trade slightly below its current price of $113.02, while Newell Brands shows a modest upside potential from $4.15. Overall, the consensus suggests cautious optimism for both stocks.
Analyst Opinions Comparison
This section compares analysts’ ratings and grades for The Estée Lauder Companies Inc. (EL) and Newell Brands Inc. (NWL):
Rating Comparison
EL Rating
- Rating: D+ with a very favorable status.
- Discounted Cash Flow Score: 2, indicating moderate valuation outlook.
- ROE Score: 1, signaling very unfavorable efficiency in generating equity returns.
- ROA Score: 1, reflecting very unfavorable asset utilization.
- Debt To Equity Score: 1, showing very unfavorable financial risk profile.
- Overall Score: 1, reflecting a very unfavorable aggregated financial standing.
NWL Rating
- Rating: C+ with a very favorable status.
- Discounted Cash Flow Score: 5, indicating a very favorable valuation outlook.
- ROE Score: 1, also very unfavorable in generating equity returns.
- ROA Score: 1, equally very unfavorable asset utilization.
- Debt To Equity Score: 1, equally very unfavorable financial risk profile.
- Overall Score: 2, reflecting a moderate aggregated financial standing.
Which one is the best rated?
Based strictly on the provided data, NWL holds a better overall rating (C+) and a higher discounted cash flow and overall score compared to EL’s D+ rating and lower scores, despite both sharing very unfavorable profitability and financial risk metrics.
Scores Comparison
The scores comparison between The Estée Lauder Companies Inc. (EL) and Newell Brands Inc. (NWL) is as follows:
EL Scores
- Altman Z-Score: 3.11, indicating a safe zone status
- Piotroski Score: 5, classified as average strength
NWL Scores
- Altman Z-Score: 0.51, indicating a distress zone status
- Piotroski Score: 4, classified as average strength
Which company has the best scores?
Based on the provided data, EL shows stronger financial stability with a safe zone Altman Z-Score, while NWL is in the distress zone. Both have average Piotroski Scores, with EL slightly higher than NWL.
Grades Comparison
Here is the comparison of recent reliable grades from established grading companies for the two companies:
The Estée Lauder Companies Inc. Grades
The following table summarizes recent grades assigned by reputable financial institutions:
| Grading Company | Action | New Grade | Date |
|---|---|---|---|
| Wells Fargo | Maintain | Equal Weight | 2026-01-05 |
| Raymond James | Upgrade | Strong Buy | 2026-01-05 |
| Citigroup | Maintain | Neutral | 2025-12-17 |
| Evercore ISI Group | Maintain | Outperform | 2025-12-16 |
| Rothschild & Co | Downgrade | Sell | 2025-11-25 |
| Argus Research | Upgrade | Buy | 2025-11-11 |
| JP Morgan | Maintain | Overweight | 2025-10-31 |
| Telsey Advisory Group | Maintain | Market Perform | 2025-10-31 |
| UBS | Maintain | Neutral | 2025-10-31 |
| RBC Capital | Maintain | Outperform | 2025-10-31 |
Overall, The Estée Lauder Companies Inc. shows a mixed rating trend with several upgrades and maintains, but also includes a notable downgrade to Sell, reflecting divergent analyst views.
Newell Brands Inc. Grades
The following table presents recent grades from recognized grading firms:
| Grading Company | Action | New Grade | Date |
|---|---|---|---|
| Citigroup | Maintain | Neutral | 2025-12-17 |
| UBS | Maintain | Neutral | 2025-12-02 |
| Canaccord Genuity | Maintain | Buy | 2025-11-03 |
| RBC Capital | Maintain | Sector Perform | 2025-11-03 |
| JP Morgan | Maintain | Overweight | 2025-11-03 |
| Citigroup | Maintain | Neutral | 2025-11-03 |
| JP Morgan | Maintain | Overweight | 2025-10-23 |
| Citigroup | Maintain | Neutral | 2025-10-09 |
| Citigroup | Maintain | Neutral | 2025-09-16 |
| Canaccord Genuity | Maintain | Buy | 2025-08-04 |
Newell Brands Inc. maintains a stable rating pattern with mostly Neutral and Buy grades, indicating consistent analyst sentiment without major upgrades or downgrades.
Which company has the best grades?
The Estée Lauder Companies Inc. has received a wider range of grades including Strong Buy and Outperform, whereas Newell Brands Inc. mostly holds Neutral and Buy grades. This spread for Estée Lauder may imply higher analyst conviction but also more divergent opinions, which investors should consider for risk assessment.
Strengths and Weaknesses
Below is a comparison of key strengths and weaknesses for The Estée Lauder Companies Inc. (EL) and Newell Brands Inc. (NWL) based on their recent financial and operational data.
| Criterion | The Estée Lauder Companies Inc. (EL) | Newell Brands Inc. (NWL) |
|---|---|---|
| Diversification | Strong product mix across Skin Care (6.96B), Makeup (4.21B), Fragrance (2.49B), and Hair Care (565M) | Broad portfolio including Home & Commercial (4.07B), Learning & Development (2.72B), Outdoor & Recreation (794M) |
| Profitability | Negative net margin (-7.93%) and ROE (-29.31%), ROIC neutral at 6.44% but below WACC (8.08%) | Negative net margin (-2.85%) and ROE (-7.85%), ROIC low at 0.64% but growing, WACC favorable (5.56%) |
| Innovation | Moderate innovation indicated by stable Makeup and Skin Care revenues but declining overall profitability | Improving profitability trend suggests increasing operational efficiency and potential product innovation |
| Global presence | Strong global brand with consistent revenue in high-demand beauty segments | Diverse geographic reach with focus on consumer and commercial products, but facing profitability challenges |
| Market Share | Leading market positions in premium beauty segments but value destruction signals risk | Stable market presence in home and commercial sectors with growing ROIC, yet still shedding value overall |
Key takeaways: Both EL and NWL face profitability challenges with negative margins and value destruction. EL benefits from a highly diversified beauty portfolio but declining returns, while NWL shows improving ROIC and favorable capital costs despite ongoing profitability hurdles. Investors should weigh EL’s brand strength against NWL’s operational recovery potential, managing risk carefully.
Risk Analysis
Below is a comparison table outlining key risks for The Estée Lauder Companies Inc. (EL) and Newell Brands Inc. (NWL) based on the most recent data available.
| Metric | The Estée Lauder Companies Inc. (EL) | Newell Brands Inc. (NWL) |
|---|---|---|
| Market Risk | Beta 1.15, moderate volatility | Beta 0.89, lower volatility |
| Debt level | High debt-to-equity (2.44), interest coverage negative (-1.57) | High debt-to-equity (1.86), low interest coverage (0.12) |
| Regulatory Risk | Moderate, global cosmetic regulations | Moderate, consumer product regulations |
| Operational Risk | Complex supply chain, brand portfolio management | Diverse product lines, integration challenges |
| Environmental Risk | Increasing focus on sustainability, brand reputation sensitive | Growing pressure on environmental compliance |
| Geopolitical Risk | Exposure due to global sales footprint | Exposure through global sourcing and distribution |
The most impactful risks for EL are its high leverage with negative interest coverage, increasing financial vulnerability despite a safe Altman Z-Score. NWL faces a more severe financial distress signal with a low Altman Z-Score and weak profitability, compounded by operational complexity and high debt. Both companies must carefully manage debt and operational risks to mitigate potential downturns.
Which Stock to Choose?
The Estée Lauder Companies Inc. (EL) has shown a declining income with unfavorable net margin and profitability metrics, including a negative return on equity of -29.31%. Its financial ratios present a slightly unfavorable overall profile, with a high debt-to-equity ratio and weak interest coverage, despite some favorable valuation measures and a safe-zone Altman Z-Score.
Newell Brands Inc. (NWL) displays a mixed income evolution with a small unfavorable net margin but favorable growth in net income and EPS over the period. Its financial ratios are slightly unfavorable overall, with a high net debt to EBITDA and low interest coverage, compounded by an Altman Z-Score in the distress zone indicating financial risk.
Investors prioritizing growth and improving profitability might find Newell’s increasing ROIC and favorable income growth metrics more appealing, while those focused on financial stability could see Estée Lauder’s stronger Altman Z-Score and market capitalization as indicative of lower bankruptcy risk, despite its declining profitability and higher leverage.
Disclaimer: Investment carries a risk of loss of initial capital. The past performance is not a reliable indicator of future results. Be sure to understand risks before making an investment decision.
Go Further
I encourage you to read the complete analyses of The Estée Lauder Companies Inc. and Newell Brands Inc. to enhance your investment decisions: