Home > Comparison > Consumer Defensive > CLX vs NWL
The strategic rivalry between The Clorox Company and Newell Brands Inc. shapes the consumer defensive sector’s evolution. Clorox operates as a focused manufacturer of household and wellness products, emphasizing brand strength and innovation. Newell Brands, by contrast, manages a diversified portfolio spanning commercial solutions and outdoor recreation. This head-to-head pits Clorox’s concentrated growth against Newell’s broad market reach. This analysis will reveal which trajectory delivers superior risk-adjusted returns for a diversified portfolio.
Table of contents
Companies Overview
The Clorox Company and Newell Brands Inc. are key players in the household and personal products market, each commanding significant presence.
The Clorox Company: Consumer Products Powerhouse
The Clorox Company dominates the household and personal products sector with a diverse portfolio including cleaning, health, and lifestyle brands. Its revenue primarily stems from mass retail and e-commerce sales of trusted brands like Clorox, Glad, and Burt’s Bees. In 2026, Clorox focuses strategically on expanding its health and wellness segment while reinforcing its international footprint.
Newell Brands Inc.: Multifaceted Consumer Goods Leader
Newell Brands Inc. operates broadly across consumer and commercial products, generating revenue through five segments including home appliances and outdoor recreation. It leverages a mix of iconic brands such as Rubbermaid, Calphalon, and Coleman to serve diverse retail channels. The company’s 2026 strategy emphasizes innovation and growth across commercial solutions and outdoor lifestyle categories.
Strategic Collision: Similarities & Divergences
Clorox and Newell share a commitment to branded consumer essentials but differ in scope; Clorox prioritizes a focused portfolio, while Newell pursues broader diversification. Their primary battleground lies in retail dominance and brand loyalty within household goods. Investors face distinct profiles: Clorox offers stable, concentrated cash flow; Newell presents diversified risk with broader exposure.
Income Statement Comparison
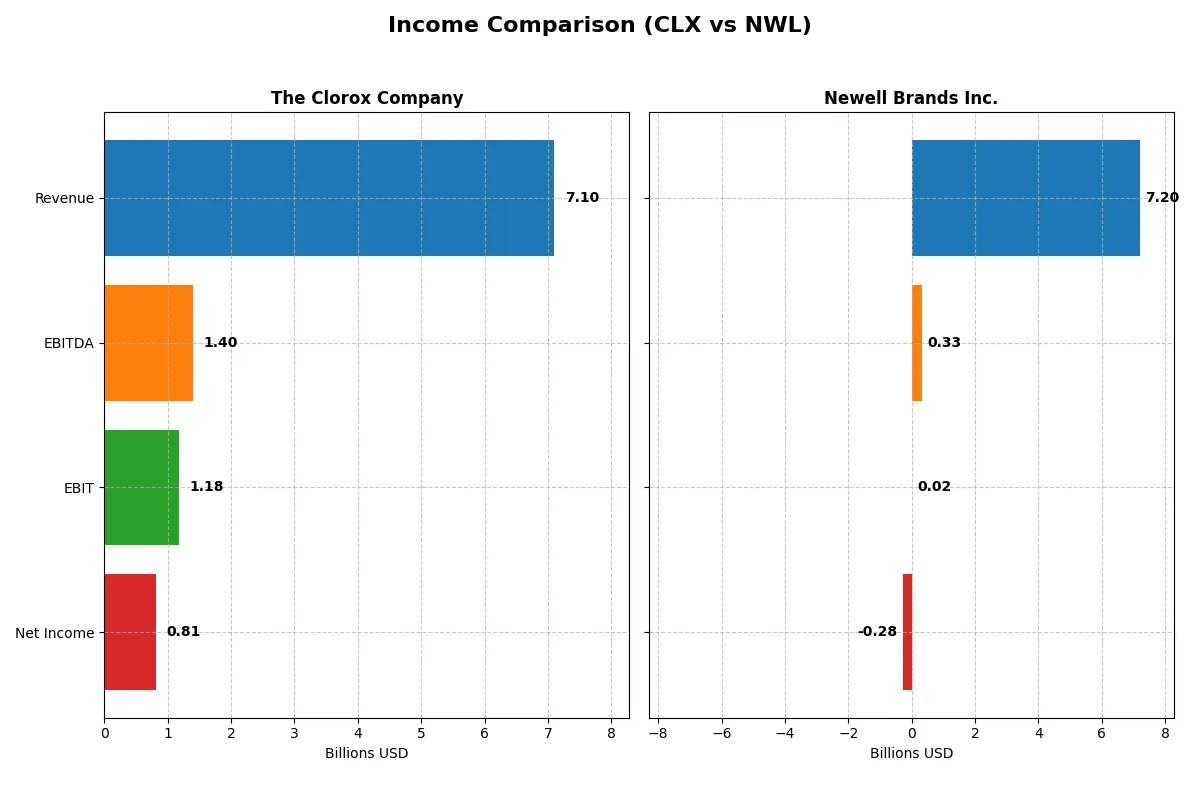
The following data dissects the core profitability and scalability of both corporate engines to reveal who dominates the bottom line:
| Metric | The Clorox Company (CLX) | Newell Brands Inc. (NWL) |
|---|---|---|
| Revenue | 7.1B | 7.2B |
| Cost of Revenue | 3.9B | 4.8B |
| Operating Expenses | 2.0B | 2.0B |
| Gross Profit | 3.2B | 2.4B |
| EBITDA | 1.4B | 331M |
| EBIT | 1.2B | 20M |
| Interest Expense | 101M | 321M |
| Net Income | 810M | -285M |
| EPS | 6.56 | -0.68 |
| Fiscal Year | 2025 | 2025 |
Income Statement Analysis: The Bottom-Line Duel
This income statement comparison reveals which company operates its business engine more efficiently through profitability and margin trends.
The Clorox Company Analysis
Clorox’s revenue stayed stable around 7.1B over five years, while net income surged 14% overall, reaching 810M in 2025. Gross margins hold firm near 45%, and net margins rose to 11.4%, signaling solid cost control. The latest year shows strong momentum with a 135% jump in EBIT and nearly 190% EPS growth, reflecting notable operational efficiency gains.
Newell Brands Inc. Analysis
Newell’s revenue declined significantly from 10.6B in 2021 to 7.2B in 2025, with net income turning negative to -285M last year. Gross margin contracted to 33.8%, and net margin plunged below zero at -4%, reflecting shrinking profitability. The latest year deteriorated further as EBIT slumped 43%, underscoring ongoing struggles to stabilize costs amid falling top line.
Margin Strength vs. Revenue Decline
Clorox clearly outperforms Newell in profitability and margin expansion despite modest revenue growth. Clorox’s disciplined expense management and rising net income create a fundamentally stronger profile. Newell’s steep revenue decline and persistent losses mark it as a higher-risk turnaround. Investors prioritizing margin resilience will find Clorox’s stable and improving earnings more attractive.
Financial Ratios Comparison
These vital ratios act as a diagnostic tool to expose the underlying fiscal health, valuation premiums, and capital efficiency of the companies analyzed:
| Ratios | The Clorox Company (CLX) | Newell Brands Inc. (NWL) |
|---|---|---|
| ROE | 2.5% | -11.9% |
| ROIC | 24.1% | 5.1% |
| P/E | 18.3 | -5.5 |
| P/B | 46.2 | 0.65 |
| Current Ratio | 0.84 | 1.07 |
| Quick Ratio | 0.57 | 0.57 |
| D/E | 8.97 | 2.32 |
| Debt-to-Assets | 51.8% | 51.7% |
| Interest Coverage | 11.7 | 1.39 |
| Asset Turnover | 1.28 | 0.67 |
| Fixed Asset Turnover | 4.44 | 4.33 |
| Payout ratio | 74.3% | -42.1% |
| Dividend yield | 4.06% | 7.71% |
| Fiscal Year | 2025 | 2025 |
Efficiency & Valuation Duel: The Vital Signs
Ratios act as a company’s DNA, revealing hidden risks and operational strengths beyond surface-level financials.
The Clorox Company
Clorox displays robust profitability with a stellar 252% ROE and solid 11.4% net margin, signaling operational excellence. Its P/E ratio at 18.3 suggests a fairly valued stock, though a high P/B of 46.2 raises caution. The company rewards shareholders with a healthy 4.06% dividend yield, reflecting steady cash returns amid focused capital allocation.
Newell Brands Inc.
Newell suffers from negative profitability metrics, including a -11.9% ROE and -3.96% net margin, indicating operational challenges. Its P/E ratio is negative due to losses, but a low P/B of 0.65 implies undervaluation. Despite weak earnings, Newell offers a 7.71% dividend yield, though interest coverage near zero flags significant financial risk.
Premium Valuation vs. Operational Safety
Clorox balances strong profitability and shareholder returns with moderate valuation, offering a safer risk-reward profile. Newell’s undervaluation appeals to value seekers but is overshadowed by poor profitability and financial strain. Investors prioritizing stability would lean toward Clorox, while those chasing deep value must weigh substantial risks.
Which one offers the Superior Shareholder Reward?
I compare The Clorox Company (CLX) and Newell Brands Inc. (NWL) on dividends, buybacks, and sustainability in 2026. CLX pays a strong 4.06% dividend yield with a high 74% payout ratio but covers dividends well with 78% FCF. NWL offers a higher 7.7% yield but suffers negative net margins and minimal free cash flow, signaling dividend risk. CLX executes consistent buybacks, enhancing total return. NWL’s buyback activity is limited amid financial strain. I see CLX’s balanced distribution and cash flow discipline as a more sustainable model. Thus, CLX offers the superior total shareholder reward in 2026.
Comparative Score Analysis: The Strategic Profile
The radar chart reveals the fundamental DNA and trade-offs of both firms, highlighting their financial strengths and vulnerabilities:
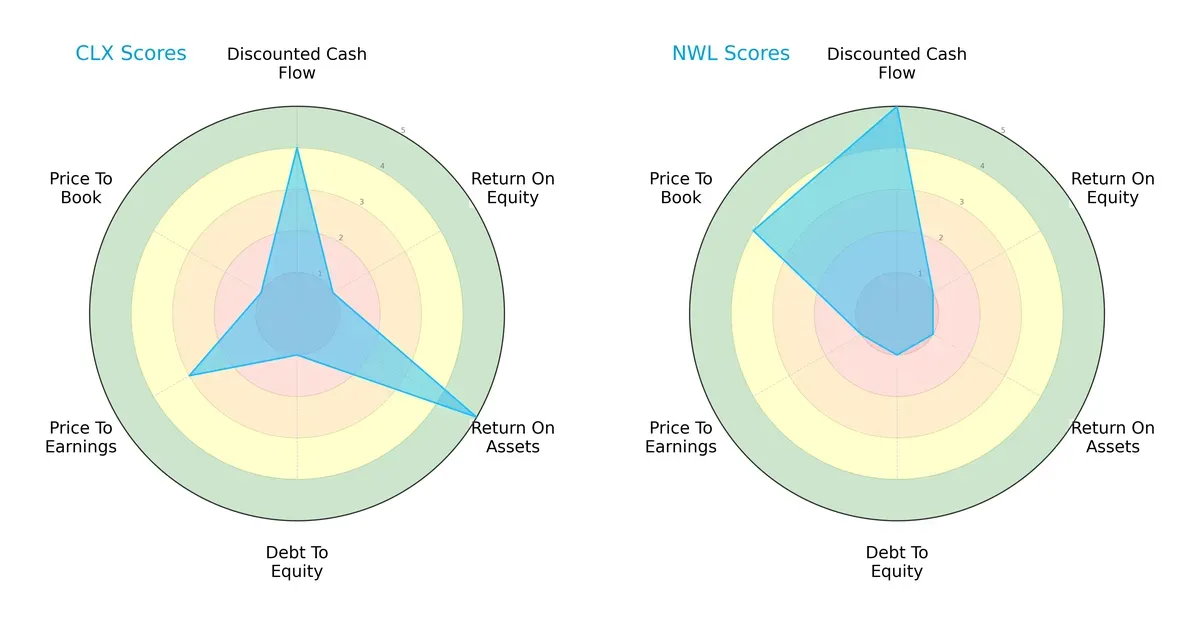
Clorox shows strength in asset utilization (ROA 5) and discounted cash flow (DCF 4), but weak equity returns (ROE 1) and high leverage risk (Debt/Equity 1). Newell leads in DCF (5) and price-to-book valuation (4), yet struggles with asset efficiency (ROA 1) and valuation metrics (PE 1). Clorox’s profile is more balanced, while Newell relies heavily on cash flow projections and valuation discounts.
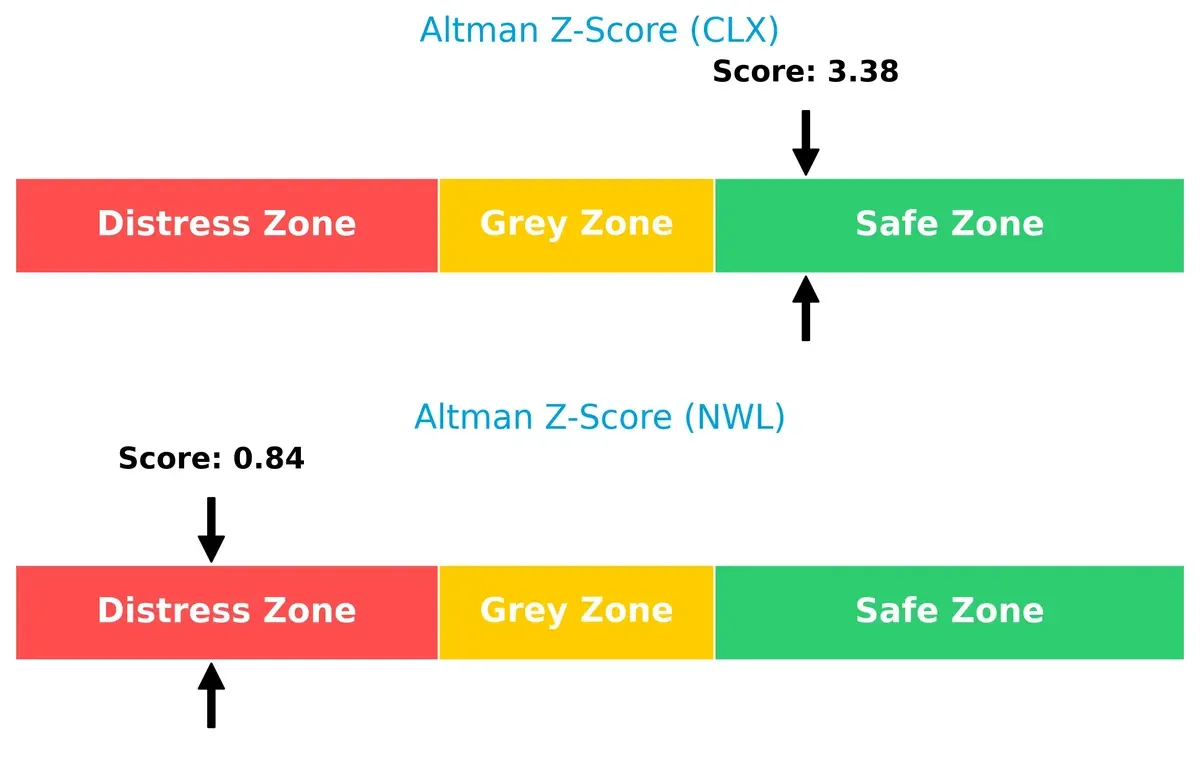
Bankruptcy Risk: Solvency Showdown
Clorox’s Altman Z-Score of 3.38 places it safely above distress thresholds, signaling strong long-term survival odds. Newell’s 0.84 falls deep in the distress zone, raising significant bankruptcy concerns:
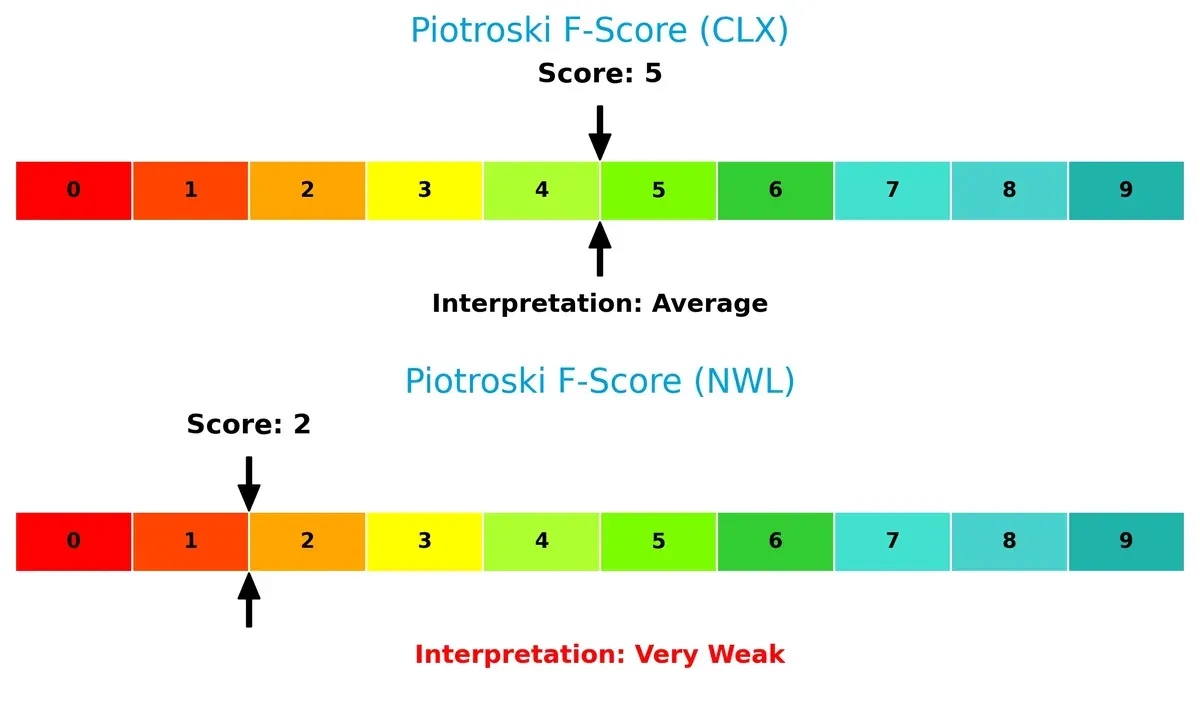
Financial Health: Quality of Operations
Clorox’s Piotroski F-Score of 5 suggests moderate financial health with some operational strengths. Newell’s score of 2 flags serious internal weaknesses and red flags compared to its peer:
How are the two companies positioned?
This section dissects the operational DNA of Clorox and Newell by comparing their revenue distribution and internal strengths and weaknesses. The goal is to confront their economic moats and reveal which business model offers the most resilient competitive advantage today.
Revenue Segmentation: The Strategic Mix
This visual comparison dissects how The Clorox Company and Newell Brands Inc. diversify their income streams and where their primary sector bets lie:
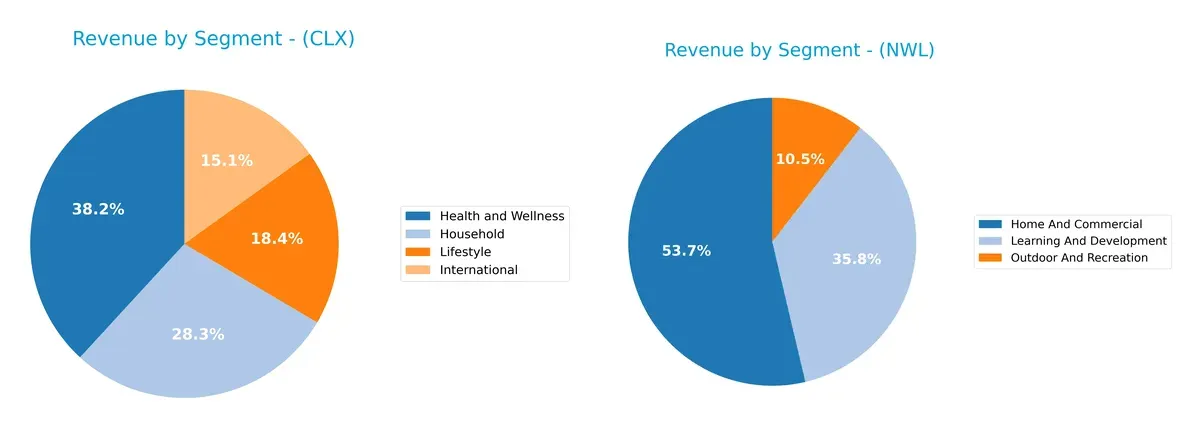
Clorox anchors its revenue in Health and Wellness at $2.7B, supported by Household ($2B), Lifestyle ($1.3B), and International ($1.1B) segments, showing balanced diversification. Newell Brands pivots on Home and Commercial solutions, with $4.1B in 2024, but also leans heavily on Learning and Development at $2.7B. Clorox’s spread reduces concentration risk, while Newell’s reliance on fewer big segments suggests potential vulnerability but stronger ecosystem lock-in.
Strengths and Weaknesses Comparison
This table compares the Strengths and Weaknesses of The Clorox Company and Newell Brands Inc.:
CLX Strengths
- Diverse product segments including Health, Household, International, Lifestyle
- Strong profitability with 11.4% net margin and 252% ROE
- Favorable ROIC of 24.14% well above WACC
- Solid dividend yield at 4.06%
- Robust asset turnover indicating efficient operations
NWL Strengths
- Broad product diversification across Home, Learning, Outdoor segments
- Favorable valuation metrics: low P/E and P/B ratios
- Presence in multiple geographic markets including North America and Foreign countries
- Reasonable WACC of 5.81% supports capital efficiency
- Favorable fixed asset turnover close to CLX
CLX Weaknesses
- Weak liquidity ratios: current ratio 0.84 and quick ratio 0.57 below 1.0
- High leverage: debt-to-assets at 51.79% and high D/E ratio
- Unfavorable P/B ratio at 46.2 indicating possible overvaluation
- Moderate P/E ratio neutral for valuation
- Debt burden may pressure interest coverage despite a favorable 11.67x
NWL Weaknesses
- Negative profitability: net margin -3.96% and ROE -11.92%
- Poor interest coverage at 0.06 signals financial distress
- Moderate liquidity with quick ratio 0.57 unfavorable
- High debt-to-assets at 51.69% and leverage concerns
- Neutral asset turnover signals operational inefficiency
- Dividend yield neutral, no clear shareholder return advantage
Overall, CLX demonstrates a stronger profitability and operational efficiency profile but faces liquidity and leverage risks. NWL exhibits broader diversification and attractive valuation metrics but struggles with profitability and financial health. These contrasting profiles imply distinct strategic priorities related to capital structure and operational improvement.
The Moat Duel: Analyzing Competitive Defensibility
A structural moat protects long-term profits from competitive erosion. Only durable moats secure persistent economic value in evolving markets:
The Clorox Company: Intangible Assets Powerhouse
Clorox’s moat stems from its strong brand portfolio and product trust, reflected in very favorable ROIC exceeding WACC by 18%. Its stable margins and growing profitability show deep competitive defensibility. New health and wellness products in 2026 could widen this moat further.
Newell Brands Inc.: Struggling Cost and Scale Advantage
Newell’s moat is weaker, relying on scale but suffering from declining ROIC and negative net margins. Unlike Clorox, it is shedding value with a 32% ROIC decline over five years. Market disruption and restructuring efforts in 2026 may offer turnaround chances but risks remain high.
Moat Strength Showdown: Brand Equity vs. Scale Efficiency
Clorox holds a deeper, more sustainable moat supported by growing returns and stable margins. Newell’s deteriorating profitability signals a fragile moat. Clorox is clearly better equipped to defend its market share amid intensifying competition.
Which stock offers better returns?
The past year reveals contrasting trajectories for The Clorox Company and Newell Brands Inc., marked by steep declines but recent strong rebounds in both stocks’ price movements.
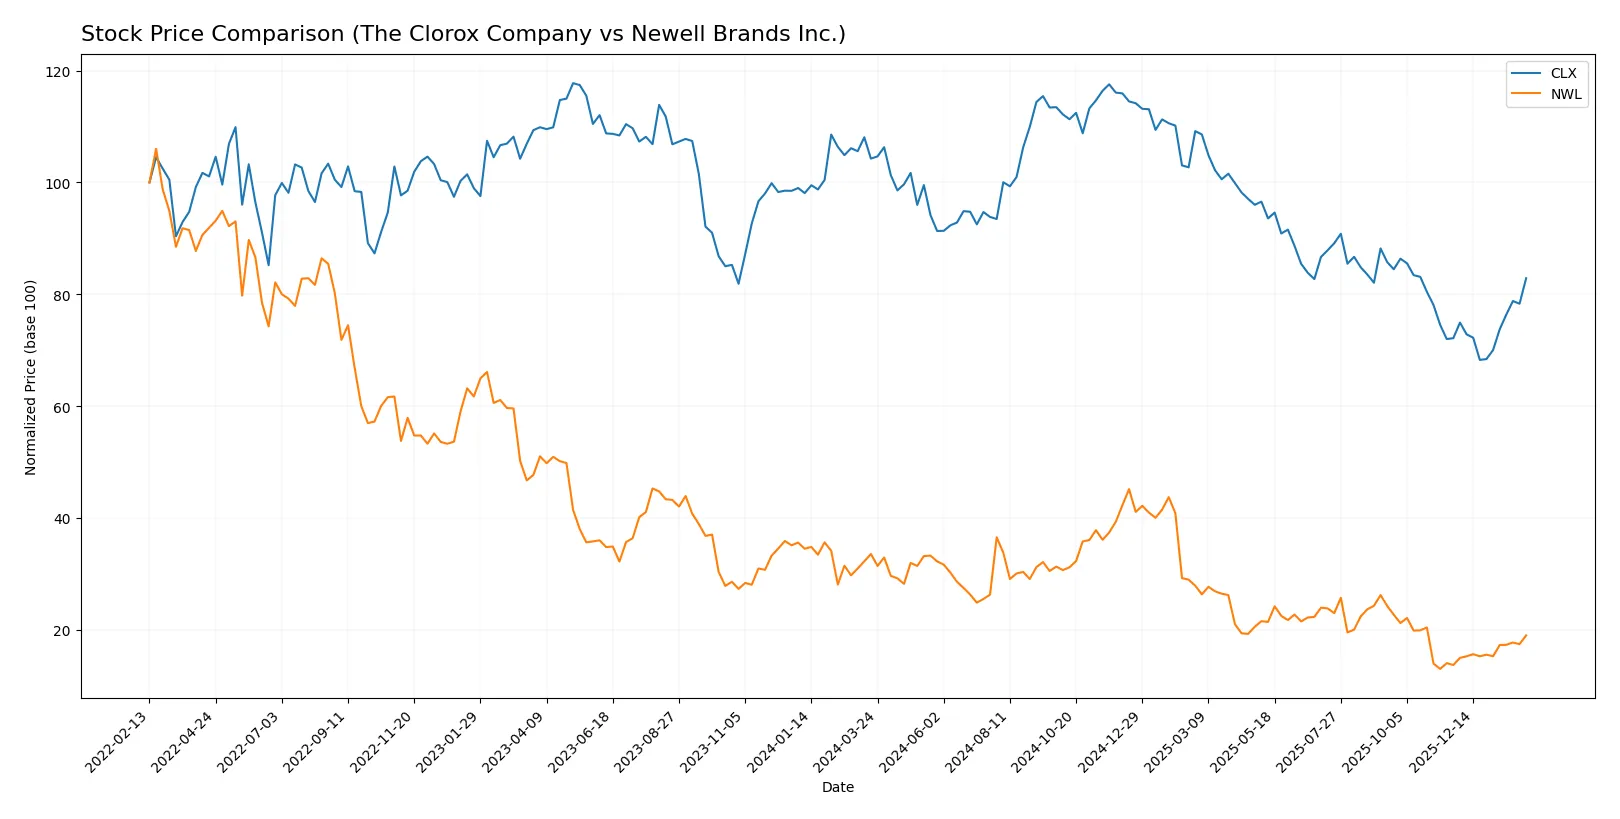
Trend Comparison
The Clorox Company’s stock fell sharply by 20.51% over the past year, showing a bearish trend with accelerating decline and high volatility. It recently rebounded 14.86% over two and a half months, indicating positive momentum.
Newell Brands Inc. posted a steeper 43.4% drop in the last year, also bearish with accelerating losses but lower volatility. Its recent 38.62% gain suggests a meaningful recovery phase amid buyer dominance.
Comparing both, Newell Brands experienced a larger overall decline but outperformed Clorox in recent gains, delivering the highest market performance in the latest months.
Target Prices
Analysts present a clear consensus on target prices for The Clorox Company and Newell Brands Inc.
| Company | Target Low | Target High | Consensus |
|---|---|---|---|
| The Clorox Company | 94 | 152 | 120.25 |
| Newell Brands Inc. | 4.25 | 8 | 5.58 |
The Clorox Company’s consensus target closely matches its current price of $119.36, indicating balanced expectations. Newell Brands’ target consensus of $5.58 exceeds its current $4.63 price, suggesting modest upside potential.

Don’t Let Luck Decide Your Entry Point
Optimize your entry points with our advanced ProRealTime indicators. You’ll get efficient buy signals with precise price targets for maximum performance. Start outperforming now!
How do institutions grade them?
The Clorox Company Grades
The following table summarizes recent institutional grades for The Clorox Company:
| Grading Company | Action | New Grade | Date |
|---|---|---|---|
| Morgan Stanley | Maintain | Equal Weight | 2026-02-05 |
| Citigroup | Maintain | Neutral | 2026-02-04 |
| UBS | Maintain | Neutral | 2026-02-04 |
| Evercore ISI Group | Maintain | Underperform | 2026-02-04 |
| JP Morgan | Maintain | Neutral | 2026-02-04 |
| Wells Fargo | Maintain | Equal Weight | 2026-01-23 |
| JP Morgan | Maintain | Neutral | 2026-01-16 |
| UBS | Maintain | Neutral | 2026-01-14 |
| TD Cowen | Maintain | Hold | 2026-01-08 |
| Goldman Sachs | Maintain | Sell | 2026-01-07 |
Newell Brands Inc. Grades
The following table summarizes recent institutional grades for Newell Brands Inc.:
| Grading Company | Action | New Grade | Date |
|---|---|---|---|
| Canaccord Genuity | Maintain | Buy | 2026-01-26 |
| UBS | Maintain | Neutral | 2026-01-14 |
| Citigroup | Maintain | Neutral | 2026-01-14 |
| Citigroup | Maintain | Neutral | 2025-12-17 |
| UBS | Maintain | Neutral | 2025-12-02 |
| Canaccord Genuity | Maintain | Buy | 2025-11-03 |
| Citigroup | Maintain | Neutral | 2025-11-03 |
| JP Morgan | Maintain | Overweight | 2025-11-03 |
| RBC Capital | Maintain | Sector Perform | 2025-11-03 |
| JP Morgan | Maintain | Overweight | 2025-10-23 |
Which company has the best grades?
Newell Brands holds stronger institutional grades with multiple Buy and Overweight ratings. Clorox displays more caution, with several Neutral and Sell ratings. This divergence may influence investor confidence and portfolio positioning.
Risks specific to each company
The following categories identify the critical pressure points and systemic threats facing both firms in the 2026 market environment:
1. Market & Competition
The Clorox Company
- Strong brand portfolio in consumer staples provides resilient demand but faces intense competition from private labels.
Newell Brands Inc.
- Diverse product lines in consumer goods face margin pressure amid shifting consumer preferences and fierce retail competition.
2. Capital Structure & Debt
The Clorox Company
- High debt-to-assets at 51.8% and low current ratio (0.84) raise liquidity concerns despite favorable interest coverage (11.67).
Newell Brands Inc.
- Similar high leverage (51.7% debt-to-assets) but critically low interest coverage (0.06) signals significant financial distress risk.
3. Stock Volatility
The Clorox Company
- Beta of 0.61 indicates lower volatility than the market, providing stability in turbulent times.
Newell Brands Inc.
- Beta near 0.93 suggests higher volatility and greater sensitivity to market swings.
4. Regulatory & Legal
The Clorox Company
- Operating globally in regulated consumer products markets entails compliance costs but limited litigation risks historically.
Newell Brands Inc.
- Broad product range exposes it to diverse regulatory environments, increasing complexity and compliance risk.
5. Supply Chain & Operations
The Clorox Company
- Efficient asset turnover (1.28) and fixed asset turnover (4.44) reflect operational strength and supply chain efficiency.
Newell Brands Inc.
- Lower asset turnover (0.67) indicates less operational efficiency, increasing vulnerability to supply disruptions.
6. ESG & Climate Transition
The Clorox Company
- Increasing focus on sustainable product lines and packaging to meet regulatory and consumer demands.
Newell Brands Inc.
- ESG efforts lag behind peers, with significant room for improvement in sustainable sourcing and carbon footprint reduction.
7. Geopolitical Exposure
The Clorox Company
- International sales diversify revenue but expose the company to currency and trade risks.
Newell Brands Inc.
- Global footprint is extensive, but reliance on complex supply chains heightens geopolitical risk exposure.
Which company shows a better risk-adjusted profile?
The Clorox Company exhibits a stronger risk-adjusted profile, driven by lower stock volatility, superior operational efficiency, and a safer Altman Z-score (3.38, safe zone). Newell Brands struggles with critical financial distress signals, including a low Altman Z-score (0.84, distress zone), weak interest coverage, and poor profitability metrics. The most impactful risk for Clorox is its high leverage and liquidity strain, while Newell faces severe financial instability. Clorox’s stable beta and efficient asset use highlight its relative resilience in 2026’s challenging consumer defensive sector.
Final Verdict: Which stock to choose?
The Clorox Company (CLX) stands out as a cash-generating powerhouse with a sustainable competitive advantage. Its strong ROIC well above WACC signals value creation and efficient capital use. However, its weaker liquidity ratios warrant caution. CLX suits investors targeting steady income and long-term growth in a resilient portfolio.
Newell Brands Inc. (NWL) offers a strategic moat rooted in asset turnover and a low valuation, appealing for value-focused investors. Yet, its declining profitability and concerning liquidity metrics make it riskier than CLX. NWL could fit portfolios seeking turnaround potential with a tolerance for volatility and financial risk.
If you prioritize durable value creation and financial resilience, CLX is the compelling choice due to its strong moat and consistent profitability. However, if you seek a speculative opportunity with deep value characteristics, NWL offers potential upside despite its current instability. Both require careful risk management aligned with your investment profile.
Disclaimer: Investment carries a risk of loss of initial capital. The past performance is not a reliable indicator of future results. Be sure to understand risks before making an investment decision.
Go Further
I encourage you to read the complete analyses of The Clorox Company and Newell Brands Inc. to enhance your investment decisions: