Investors seeking opportunities in the household and personal products sector often consider Newell Brands Inc. (NWL) and Spectrum Brands Holdings, Inc. (SPB), two established players with overlapping markets and distinct innovation strategies. Both companies offer diverse product portfolios ranging from home appliances to pet care, appealing to broad consumer bases. This analysis will help you discern which company presents a more compelling investment case in 2026, balancing growth potential and risk.
Table of contents
Companies Overview
I will begin the comparison between Newell Brands Inc. and Spectrum Brands Holdings, Inc. by providing an overview of these two companies and their main differences.
Newell Brands Inc. Overview
Newell Brands Inc. designs, manufactures, sources, and distributes consumer and commercial products worldwide. Operating across five segments including Commercial Solutions, Home Appliances, Home Solutions, Learning and Development, and Outdoor and Recreation, it offers a diverse product portfolio under well-known brands like Rubbermaid, Calphalon, and Graco. Founded in 1903 and based in Atlanta, Georgia, Newell serves various retail channels globally.
Spectrum Brands Holdings, Inc. Overview
Spectrum Brands Holdings, Inc. is a global branded consumer products company operating through Home and Personal Care, Global Pet Care, and Home and Garden segments. It markets products under brands such as Black & Decker, 8IN1, and Spectracide, catering to diverse consumer needs in home appliances, pet care, and pest control. Incorporated in 2009, the company is headquartered in Middleton, Wisconsin.
Key similarities and differences
Both companies operate within the household and personal products industry and serve global markets through multiple retail channels. Newell Brands offers a broader segment diversification including commercial solutions and outdoor products, while Spectrum Brands focuses more on pet care and home and garden categories. Newell employs significantly more staff than Spectrum, reflecting a larger operational scale despite similar market capitalizations.
Income Statement Comparison
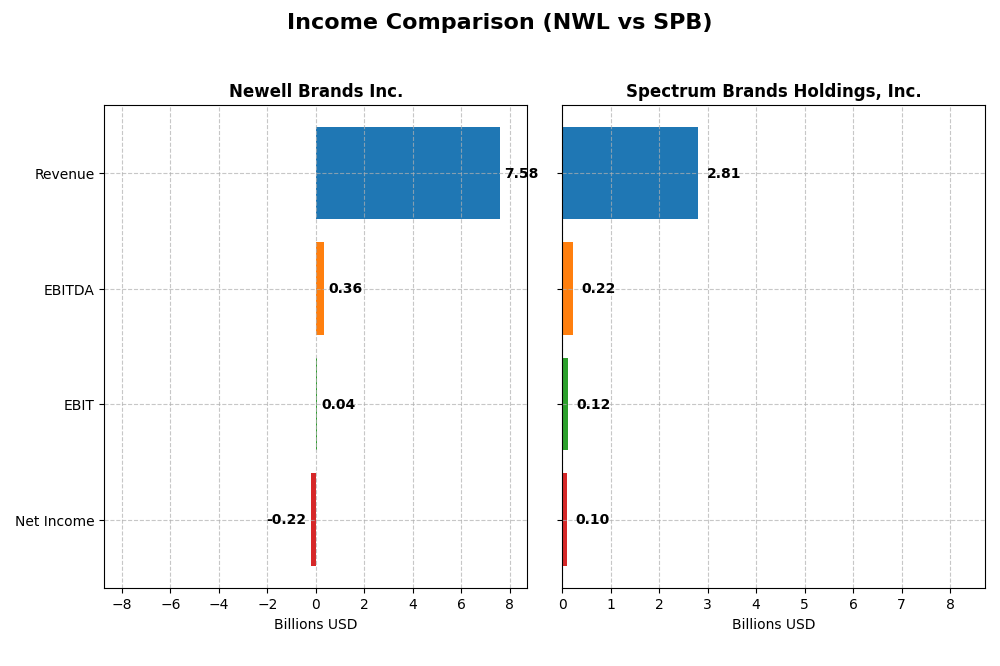
Below is a side-by-side comparison of the most recent fiscal year income statement metrics for Newell Brands Inc. and Spectrum Brands Holdings, Inc.
| Metric | Newell Brands Inc. (NWL) | Spectrum Brands Holdings, Inc. (SPB) |
|---|---|---|
| Market Cap | 1.74B | 1.53B |
| Revenue | 7.58B | 2.81B |
| EBITDA | 358M | 215M |
| EBIT | 35M | 117M |
| Net Income | -216M | 100M |
| EPS | -0.52 | 3.88 |
| Fiscal Year | 2024 | 2025 |
Income Statement Interpretations
Newell Brands Inc.
Newell Brands experienced a declining revenue trend from $10.6B in 2021 to $7.6B in 2024, with net income fluctuating from a $770M loss in 2020 to a $216M loss in 2024. Gross margin remained favorable around 33.6%, while net margin was negative at -2.85%. The 2024 performance showed improved EBIT and net margin growth despite a 6.8% revenue decline.
Spectrum Brands Holdings, Inc.
Spectrum Brands’ revenue decreased from $3.1B in 2022 to $2.8B in 2025, with net income also declining overall, recording $100M in 2025. Gross margin stayed favorable at 36.7%, but EBIT margin was neutral at 4.17%. The last year saw a 5.2% revenue drop and weaker profitability, with negative growth in EBIT and net margin.
Which one has the stronger fundamentals?
Newell Brands shows a favorable overall income statement evaluation with improving EBIT and net income growth despite revenue contraction. In contrast, Spectrum Brands has an unfavorable stance marked by declining revenue, earnings, and margins. Newell’s stronger margin improvement and profit growth appear more robust compared to Spectrum’s recent weakening fundamentals.
Financial Ratios Comparison
The table below presents a side-by-side comparison of key financial ratios for Newell Brands Inc. (NWL) and Spectrum Brands Holdings, Inc. (SPB) based on their most recent fiscal year data.
| Ratios | Newell Brands Inc. (2024) | Spectrum Brands Holdings, Inc. (2025) |
|---|---|---|
| ROE | -7.85% | 5.23% |
| ROIC | 0.64% | 4.95% |
| P/E | -19.16 | 13.51 |
| P/B | 1.50 | 0.71 |
| Current Ratio | 1.14 | 2.26 |
| Quick Ratio | 0.56 | 1.41 |
| D/E (Debt-to-Equity) | 1.86 | 0.34 |
| Debt-to-Assets | 46.56% | 19.36% |
| Interest Coverage | 0.23 | 4.16 |
| Asset Turnover | 0.69 | 0.83 |
| Fixed Asset Turnover | 4.67 | 8.55 |
| Payout Ratio | -54.63% | 48.25% |
| Dividend Yield | 2.85% | 3.57% |
Interpretation of the Ratios
Newell Brands Inc.
Newell Brands shows several unfavorable ratios, including negative net margin (-2.85%) and return on equity (-7.85%), indicating profitability and efficiency challenges. The company’s quick ratio (0.56) and interest coverage (0.12) reflect liquidity and debt servicing risks. However, a favorable dividend yield of 2.85% suggests stable shareholder returns, supported by a consistent payout, though coverage by free cash flow requires monitoring.
Spectrum Brands Holdings, Inc.
Spectrum Brands presents mostly favorable ratios, with a solid current ratio (2.26) and low debt-to-equity (0.34), supporting financial stability. While net margin (3.56%) and return on equity (5.23%) are modest and flagged as unfavorable, the company maintains a dividend yield of 3.57%, supported by manageable payout ratios and moderate share buybacks, reflecting a balanced approach to shareholder returns.
Which one has the best ratios?
Spectrum Brands offers a more favorable ratio profile, with 64.29% favorable metrics and strong liquidity, low leverage, and a higher dividend yield. Newell Brands, by contrast, has a slightly unfavorable profile with significant profitability and liquidity concerns. Based on these ratio evaluations alone, Spectrum Brands appears stronger in financial health and shareholder return metrics.
Strategic Positioning
This section compares the strategic positioning of Newell Brands Inc. and Spectrum Brands Holdings, Inc. in terms of Market position, Key segments, and Exposure to technological disruption:
Newell Brands Inc.
- Mid-size market cap of 1.74B in consumer household products facing competitive pressure.
- Diversified segments including Commercial Solutions, Home Appliances, Learning and Development, and Outdoor recreation.
- No explicit exposure to technological disruption mentioned.
Spectrum Brands Holdings, Inc.
- Slightly smaller market cap of 1.53B in similar sector with moderate competitive pressure.
- Focused on three segments: Home and Personal Care, Global Pet Care, and Home and Garden.
- No explicit exposure to technological disruption mentioned.
Newell Brands Inc. vs Spectrum Brands Holdings, Inc. Positioning
Newell Brands has a diversified business model spanning multiple consumer product categories, providing varied revenue streams. Spectrum Brands concentrates on fewer segments with emphasis on pet care and home products, which may simplify management but limits diversification.
Which has the best competitive advantage?
Both companies show a slightly unfavorable MOAT evaluation, indicating value destruction despite growing ROIC trends. Neither demonstrates a clear competitive advantage based on the ROIC versus WACC analysis over recent years.
Stock Comparison
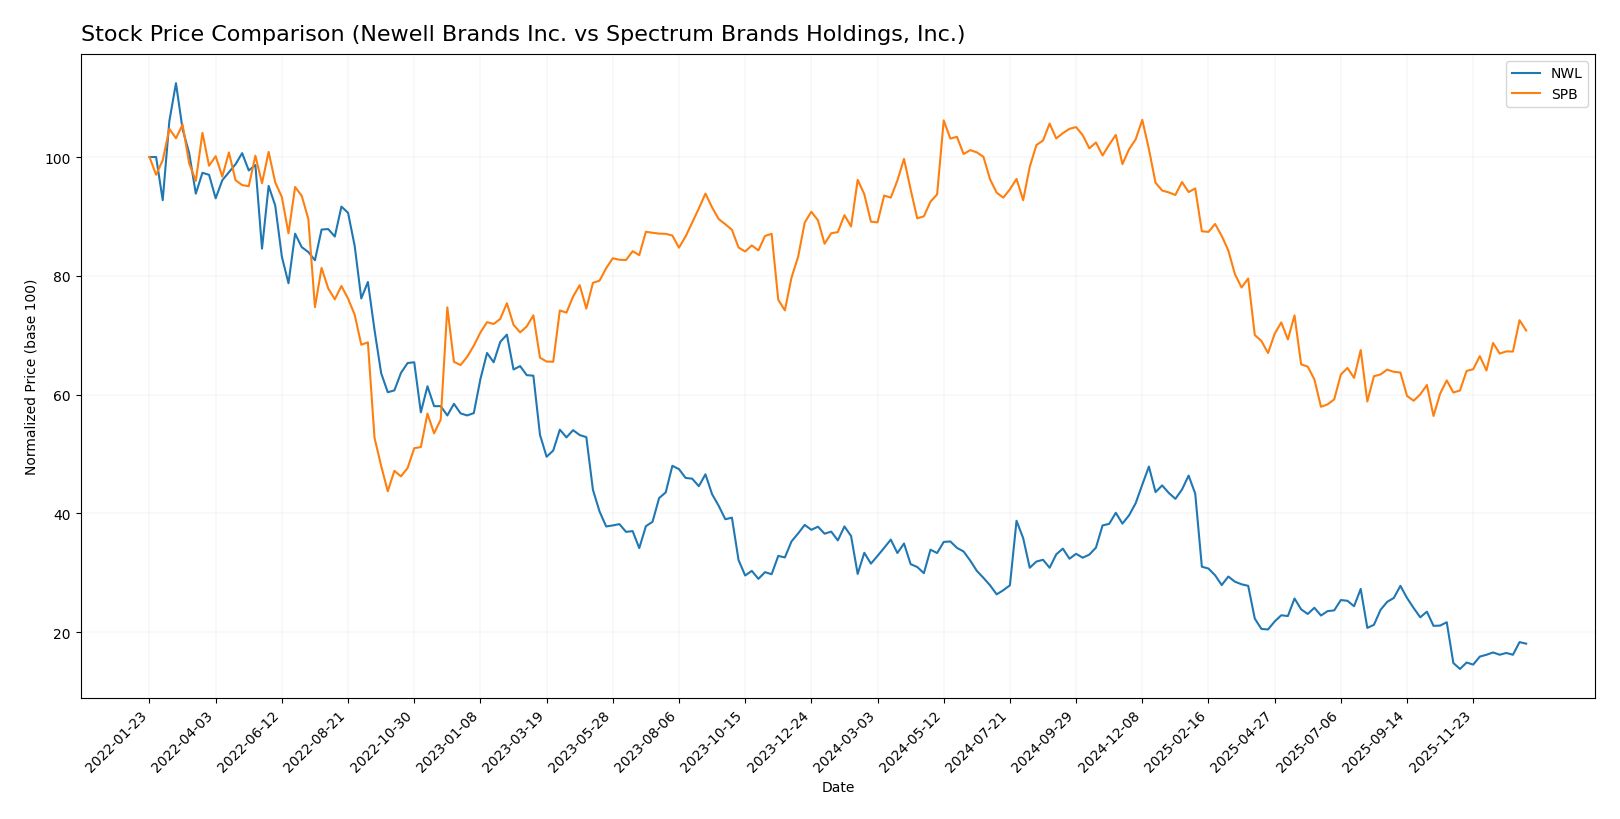
The stock prices of Newell Brands Inc. (NWL) and Spectrum Brands Holdings, Inc. (SPB) have exhibited significant bearish trends over the past 12 months, marked by notable declines and recent positive momentum in the final weeks.
Trend Analysis
Newell Brands Inc. (NWL) shows a 42.76% price decline over the past year, confirming a bearish trend with accelerating downward momentum. The stock hit a high of 11.01 and a low of 3.17, with recent weeks showing a 22.06% rebound and low volatility.
Spectrum Brands Holdings, Inc. (SPB) experienced a 20.57% price drop over the same period, also bearish with accelerating decline and high volatility. The stock ranged between 94.88 and 50.35, with a 17.3% recent recovery and increased upward slope.
Comparing both stocks, NWL endured a steeper overall decline but achieved a stronger recent rebound, while SPB had a milder loss and higher volatility; NWL’s performance was the weakest over the full year.
Target Prices
Analysts provide clear target price consensus for Newell Brands Inc. and Spectrum Brands Holdings, Inc.
| Company | Target High | Target Low | Consensus |
|---|---|---|---|
| Newell Brands Inc. | 7 | 4 | 5.08 |
| Spectrum Brands Holdings, Inc. | 75 | 75 | 75 |
The target consensus for Newell Brands suggests moderate upside from the current price of 4.15 USD, while Spectrum Brands’ consensus target of 75 USD indicates significant potential appreciation from its current 63.2 USD price.
Analyst Opinions Comparison
This section compares analysts’ ratings and grades for Newell Brands Inc. and Spectrum Brands Holdings, Inc.:
Rating Comparison
Newell Brands Inc. Rating
- Rating: C+ indicating a very favorable overall evaluation
- Discounted Cash Flow Score: 5, very favorable valuation
- ROE Score: 1, very unfavorable efficiency in equity use
- ROA Score: 1, very unfavorable asset utilization
- Debt To Equity Score: 1, very unfavorable financial risk
- Overall Score: 2, moderate overall financial standing
Spectrum Brands Holdings, Inc. Rating
- Rating: B indicating a very favorable overall evaluation
- Discounted Cash Flow Score: 1, very unfavorable valuation
- ROE Score: 2, moderate efficiency in generating profit
- ROA Score: 3, moderate asset utilization
- Debt To Equity Score: 3, moderate financial risk
- Overall Score: 3, moderate overall financial standing
Which one is the best rated?
Spectrum Brands holds a higher rating of B compared to Newell’s C+, supported by better scores in ROE, ROA, debt-to-equity, and overall score. However, Newell shows a significantly better discounted cash flow score.
Scores Comparison
The comparison of scores for Newell Brands Inc. and Spectrum Brands Holdings, Inc. is as follows:
NWL Scores
- Altman Z-Score: 0.51, indicating the company is in the distress zone.
- Piotroski Score: 4, categorized as average financial strength.
SPB Scores
- Altman Z-Score: 1.77, indicating the company is also in the distress zone.
- Piotroski Score: 6, categorized as average financial strength.
Which company has the best scores?
Based strictly on the provided data, SPB has a higher Altman Z-Score and Piotroski Score than NWL, suggesting relatively better financial stability and strength. Both remain in the distress zone for Altman Z-Score but SPB’s scores indicate a stronger position overall.
Grades Comparison
Here is a comparison of the latest reliable grades assigned by recognized financial institutions for Newell Brands Inc. and Spectrum Brands Holdings, Inc.:
Newell Brands Inc. Grades
The following table summarizes recent grades from major financial analysts for Newell Brands Inc.:
| Grading Company | Action | New Grade | Date |
|---|---|---|---|
| Citigroup | Maintain | Neutral | 2025-12-17 |
| UBS | Maintain | Neutral | 2025-12-02 |
| Canaccord Genuity | Maintain | Buy | 2025-11-03 |
| RBC Capital | Maintain | Sector Perform | 2025-11-03 |
| JP Morgan | Maintain | Overweight | 2025-11-03 |
| Citigroup | Maintain | Neutral | 2025-11-03 |
| JP Morgan | Maintain | Overweight | 2025-10-23 |
| Citigroup | Maintain | Neutral | 2025-10-09 |
| Citigroup | Maintain | Neutral | 2025-09-16 |
| Canaccord Genuity | Maintain | Buy | 2025-08-04 |
Overall, Newell Brands shows a balanced mix of neutral and buy ratings, indicating cautious optimism from analysts.
Spectrum Brands Holdings, Inc. Grades
The table below presents recent grades from reputable grading companies for Spectrum Brands Holdings, Inc.:
| Grading Company | Action | New Grade | Date |
|---|---|---|---|
| Canaccord Genuity | Maintain | Buy | 2025-11-17 |
| Wells Fargo | Maintain | Equal Weight | 2025-11-14 |
| Wells Fargo | Maintain | Equal Weight | 2025-09-25 |
| Canaccord Genuity | Maintain | Buy | 2025-08-08 |
| Wells Fargo | Maintain | Equal Weight | 2025-07-09 |
| Canaccord Genuity | Maintain | Buy | 2025-06-25 |
| UBS | Maintain | Buy | 2025-05-09 |
| UBS | Maintain | Buy | 2025-04-17 |
| Wells Fargo | Maintain | Equal Weight | 2025-04-16 |
| Wells Fargo | Maintain | Equal Weight | 2025-04-02 |
Spectrum Brands has consistently received buy and equal weight ratings, reflecting a generally positive outlook.
Which company has the best grades?
Spectrum Brands Holdings, Inc. holds a stronger consensus with more buy ratings and fewer holds compared to Newell Brands Inc., which has a heavier concentration of neutral and hold opinions. This suggests a more favorable analyst sentiment toward Spectrum Brands, potentially influencing investor confidence and portfolio decisions.
Strengths and Weaknesses
Below is a comparison of Newell Brands Inc. (NWL) and Spectrum Brands Holdings, Inc. (SPB) highlighting their key strengths and weaknesses based on recent financial and operational data.
| Criterion | Newell Brands Inc. (NWL) | Spectrum Brands Holdings, Inc. (SPB) |
|---|---|---|
| Diversification | Moderate product range focused on home, learning, outdoor segments; some decline in segment variety recently | Diversified across pet supplies, home care, and garden businesses with stable segment revenues |
| Profitability | Negative net margin (-2.85%) and ROE (-7.85%), shedding value but improving ROIC trend (0.64%) | Positive net margin (3.56%) and ROE (5.23%), though still below ideal; improving ROIC (4.95%) |
| Innovation | Moderate innovation with focus on product categories restructuring | Steady innovation in pet supplies and home care sectors, supporting revenue growth |
| Global presence | Strong in North America with some global reach in outdoor and commercial solutions | Balanced global presence, especially strong in pet supplies and home care worldwide |
| Market Share | Declining market share in some segments; competitive pressures evident | Stable or growing market share in core categories, benefiting from diversified portfolio |
Key takeaways: Both companies are currently shedding value as their ROIC is below WACC, but their profitability trends are improving. SPB shows stronger financial health and diversification, making it a slightly more favorable option for cautious investors focused on risk management.
Risk Analysis
Below is a comparative table of key risks for Newell Brands Inc. (NWL) and Spectrum Brands Holdings, Inc. (SPB) based on the most recent data available:
| Metric | Newell Brands Inc. (NWL) | Spectrum Brands Holdings, Inc. (SPB) |
|---|---|---|
| Market Risk | Moderate (Beta 0.89) | Lower (Beta 0.68) |
| Debt level | High (D/E 1.86, Interest coverage 0.12) | Low (D/E 0.34, Interest coverage 3.91) |
| Regulatory Risk | Moderate (Consumer product regulations, US-based) | Moderate (Global operations, multiple regulations) |
| Operational Risk | Elevated (Negative net margin, ROE, ROIC) | Moderate (Positive margins but moderate returns) |
| Environmental Risk | Moderate (Household products sector) | Moderate (Home & personal care, pet care) |
| Geopolitical Risk | Moderate (US focus, global sourcing) | Moderate (US base, global distribution) |
The most impactful risks for NWL are its high debt level and weak profitability metrics, with an Altman Z-score indicating financial distress. SPB shows stronger financial health with lower leverage and better liquidity, though both face typical sector regulatory and geopolitical risks. Investors should weigh NWL’s financial instability against SPB’s relatively safer profile.
Which Stock to Choose?
Newell Brands Inc. (NWL) shows a mixed income evolution with favorable EBIT and EPS growth but declining revenue over 2020-2024. Its financial ratios are slightly unfavorable, reflecting weak profitability and high debt, despite a strong dividend yield and stable capital turnover. The company is shedding value with a growing ROIC, and it holds a moderate rating of C+ with distress-zone Altman Z-Score and an average Piotroski score.
Spectrum Brands Holdings, Inc. (SPB) exhibits an unfavorable income trend marked by declining revenue and net income over 2021-2025. However, its financial ratios are largely favorable, featuring solid liquidity, low leverage, and efficient asset use. Like NWL, it is shedding value but with a stronger ROIC growth trend. SPB holds a higher rating of B, though its Altman Z-Score remains in the distress zone with an average Piotroski score.
The choice between NWL and SPB stocks might appear to depend on investor profiles: growth-oriented investors could find NWL’s improving profitability and dividend yield attractive despite its challenges, while those valuing financial stability and favorable ratios may lean towards SPB. Both companies are currently shedding value but show signs of profitability improvements, suggesting cautious observation may be prudent.
Disclaimer: Investment carries a risk of loss of initial capital. The past performance is not a reliable indicator of future results. Be sure to understand risks before making an investment decision.
Go Further
I encourage you to read the complete analyses of Newell Brands Inc. and Spectrum Brands Holdings, Inc. to enhance your investment decisions: