Home > Comparison > Consumer Defensive > NWL vs NUS
The strategic rivalry between Newell Brands Inc. and Nu Skin Enterprises, Inc. shapes the consumer defensive sector’s landscape. Newell operates as a diversified household products manufacturer with broad commercial and retail exposure. Nu Skin focuses on high-margin beauty and wellness products, leveraging direct sales and innovation. This head-to-head contrasts scale and diversification against niche specialization. This analysis will assess which corporate trajectory offers superior risk-adjusted returns for a diversified portfolio.
Table of contents
Companies Overview
Newell Brands and Nu Skin Enterprises hold significant positions in the household and personal products sector, shaping consumer choices globally.
Newell Brands Inc.: Diverse Consumer Products Powerhouse
Newell Brands dominates as a household and personal products manufacturer with a broad portfolio. It generates revenue through five segments, including commercial solutions and home appliances, leveraging brands like Rubbermaid and Calphalon. In 2026, Newell focuses strategically on expanding its outdoor and recreation segment while optimizing cross-category distribution channels to enhance market penetration.
Nu Skin Enterprises, Inc.: Direct-to-Consumer Beauty Innovator
Nu Skin leads in beauty and wellness with an emphasis on skin care and nutritional supplements. Its core revenue comes from direct sales and distributors offering products like ageLOC skin systems and LifePak supplements. The company prioritizes innovation in anti-aging technologies and growth in Mainland China retail operations to sustain competitive advantage in 2026.
Strategic Collision: Similarities & Divergences
Both firms thrive in consumer staples but differ sharply in approach: Newell embraces a multi-brand, multi-channel model, while Nu Skin relies on direct selling and distributor networks. Their primary battleground lies in personal care and wellness product market share. Investors face distinct profiles—Newell offers diversified resilience, Nu Skin bets on niche innovation and direct consumer engagement.
Income Statement Comparison
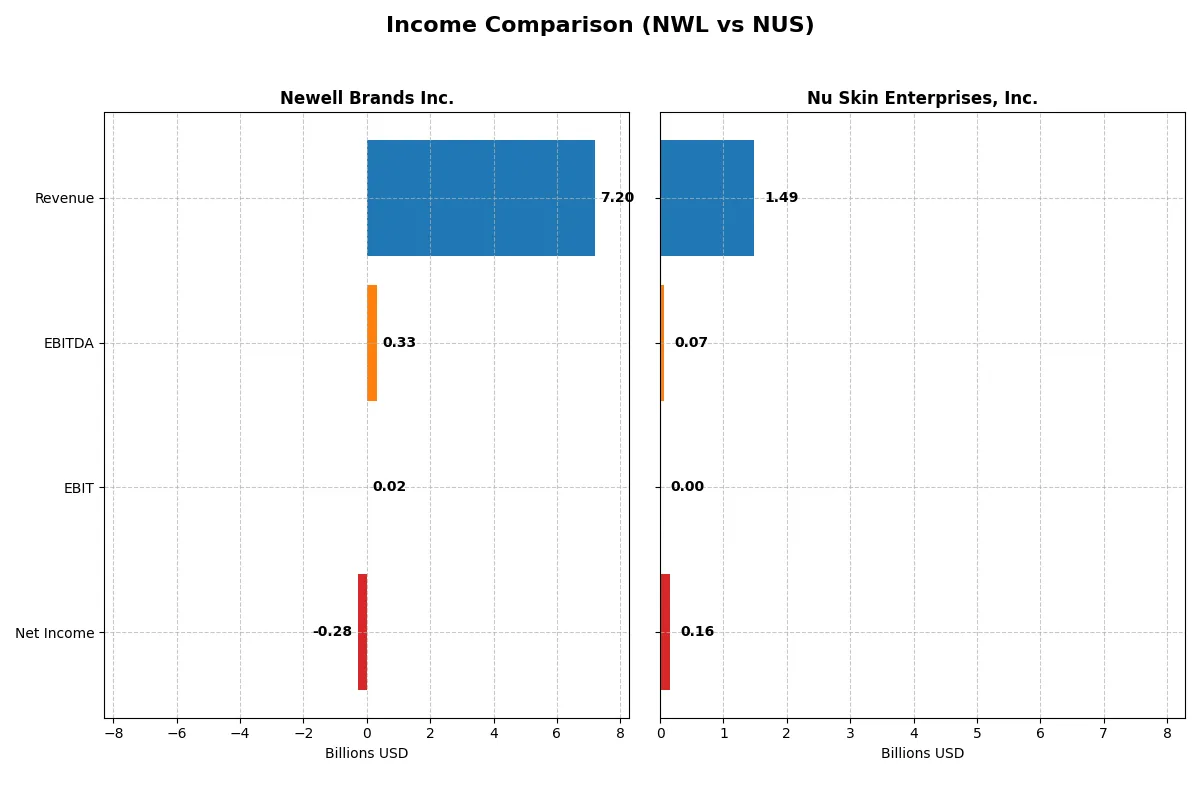
This data dissects the core profitability and scalability of both corporate engines to reveal who dominates the bottom line:
| Metric | Newell Brands Inc. (NWL) | Nu Skin Enterprises, Inc. (NUS) |
|---|---|---|
| Revenue | 7.2B | 1.49B |
| Cost of Revenue | 4.77B | 454M |
| Operating Expenses | 1.99B | 941M |
| Gross Profit | 2.43B | 1.03B |
| EBITDA | 331M | 66M |
| EBIT | 20M | 0 |
| Interest Expense | 321M | 14M |
| Net Income | -285M | 160M |
| EPS | -0.68 | 3.25 |
| Fiscal Year | 2025 | 2025 |
Income Statement Analysis: The Bottom-Line Duel
This income statement comparison reveals which company runs a more efficient and profitable corporate engine amid recent market challenges.
Newell Brands Inc. Analysis
Newell Brands’ revenue declined steadily from 10.6B in 2021 to 7.2B in 2025, with net income swinging from a 622M profit to a 285M loss. Its gross margin holds firm near 34%, but net margin turned negative at -4%, reflecting rising costs and shrinking profits. The latest year shows weakened EBIT and net income, signaling operational stress.
Nu Skin Enterprises, Inc. Analysis
Nu Skin’s revenue fell from 2.7B in 2021 to 1.5B in 2025, yet it maintained a robust 69% gross margin and rebounded to a positive net margin of 11% in 2025. Despite a recent revenue dip, net income improved overall, supported by better operating expense control and a strong EPS surge. The firm’s EBIT margin remains flat but the bottom line reflects improved efficiency.
Margin Strength vs. Revenue Contraction
Nu Skin clearly outperforms Newell Brands in profitability and margin resilience despite sharper revenue declines. Newell’s negative net margin and shrinking earnings highlight operational challenges. Nu Skin’s profile appeals more to investors seeking margin power and consistent bottom-line growth over scale-driven revenue.
Financial Ratios Comparison
These vital ratios act as a diagnostic tool to expose the underlying fiscal health, valuation premiums, and capital efficiency of the companies compared below:
| Ratios | Newell Brands Inc. (NWL) | Nu Skin Enterprises, Inc. (NUS) |
|---|---|---|
| ROE | -11.9% | 19.9% |
| ROIC | 5.1% | 4.6% |
| P/E | -5.46 | 2.96 |
| P/B | 0.65 | 0.59 |
| Current Ratio | 1.07 | 2.08 |
| Quick Ratio | 0.57 | 1.40 |
| D/E | 2.32 | 0.35 |
| Debt-to-Assets | 51.7% | 20.1% |
| Interest Coverage | 1.39 | 4.71 |
| Asset Turnover | 0.67 | 1.06 |
| Fixed Asset Turnover | 4.33 | 3.29 |
| Payout Ratio | -42.1% | 7.4% |
| Dividend Yield | 7.7% | 2.5% |
| Fiscal Year | 2025 | 2025 |
Efficiency & Valuation Duel: The Vital Signs
Ratios act as a company’s DNA, revealing hidden risks and operational excellence that raw numbers alone cannot expose.
Newell Brands Inc.
Newell Brands shows weak profitability with a negative ROE of -11.92% and a net margin of -3.96%, signaling operational challenges. Its valuation appears attractive, supported by favorable P/E and P/B ratios below 1. The company returns value mainly through a 7.71% dividend yield, reflecting a cautious shareholder payout amid mixed financial signals.
Nu Skin Enterprises, Inc.
Nu Skin delivers strong profitability with a 19.9% ROE and a solid 10.79% net margin, indicating operational efficiency. The stock trades at a low P/E of 2.96 and P/B of 0.59, suggesting it is undervalued relative to earnings and assets. It balances shareholder returns with a moderate 2.5% dividend yield, signaling prudent capital allocation.
Favorable Profitability vs. Dividend Reliance
Nu Skin offers the best balance of profitability and valuation, with mostly favorable ratios and lower financial risk. Newell Brands’ higher dividend yield offsets weaker fundamentals but raises caution. Investors seeking robust operational performance may prefer Nu Skin, while income-focused profiles might consider Newell’s yield.
Which one offers the Superior Shareholder Reward?
I compare Newell Brands Inc. (NWL) and Nu Skin Enterprises, Inc. (NUS) by their shareholder return strategies. NWL offers a high dividend yield near 7.7% but with negative free cash flow coverage, signaling risk to sustainability. Its buybacks appear minimal given cash constraints and high leverage (debt to equity ~2.3x). Conversely, NUS yields a lower dividend around 2.5% but maintains positive free cash flow and modest payout ratio (~7%). NUS executes steady buybacks supported by strong operating cash flow and low leverage (debt to equity ~0.35x). Historically, companies with sustainable cash-backed dividends and consistent buybacks outperform in total return. I conclude NUS offers a superior, more sustainable shareholder reward profile in 2026.
Comparative Score Analysis: The Strategic Profile
The radar chart reveals the fundamental DNA and financial trade-offs shaping Newell Brands Inc. and Nu Skin Enterprises, Inc.:
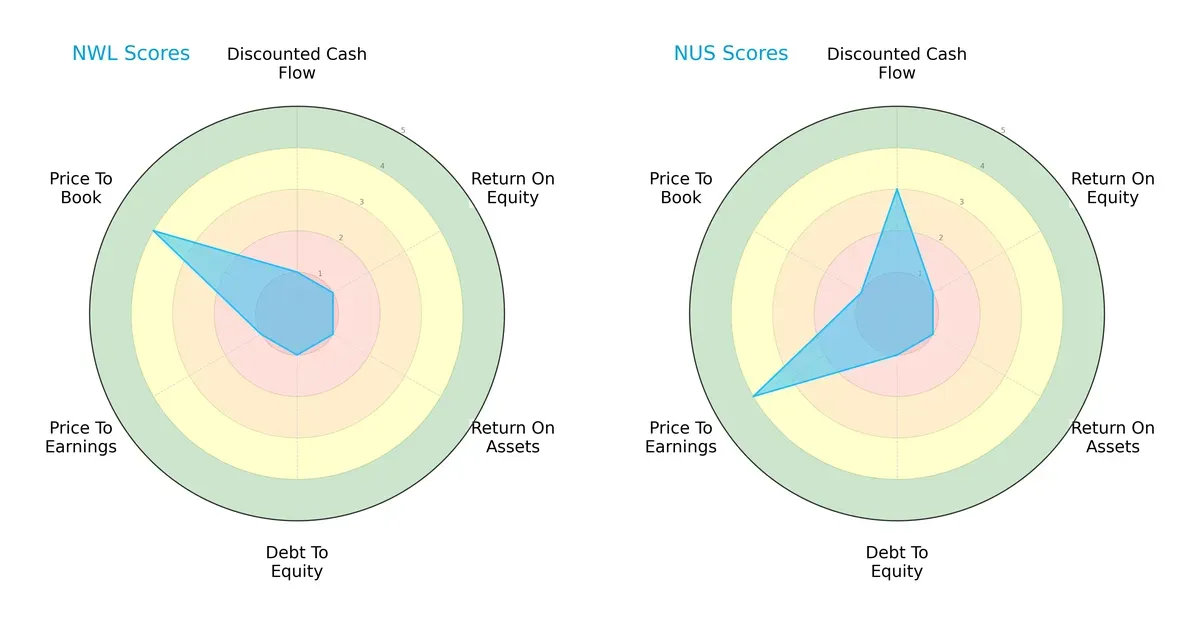
Newell Brands shows uniformly weak scores except for a favorable Price-to-Book metric, signaling undervaluation but operational struggles. Nu Skin’s profile is more nuanced, with a moderate DCF score and strong P/E valuation but similarly weak profitability and leverage scores. Nu Skin holds a more balanced, value-driven edge, while Newell relies heavily on asset valuation to attract investors.
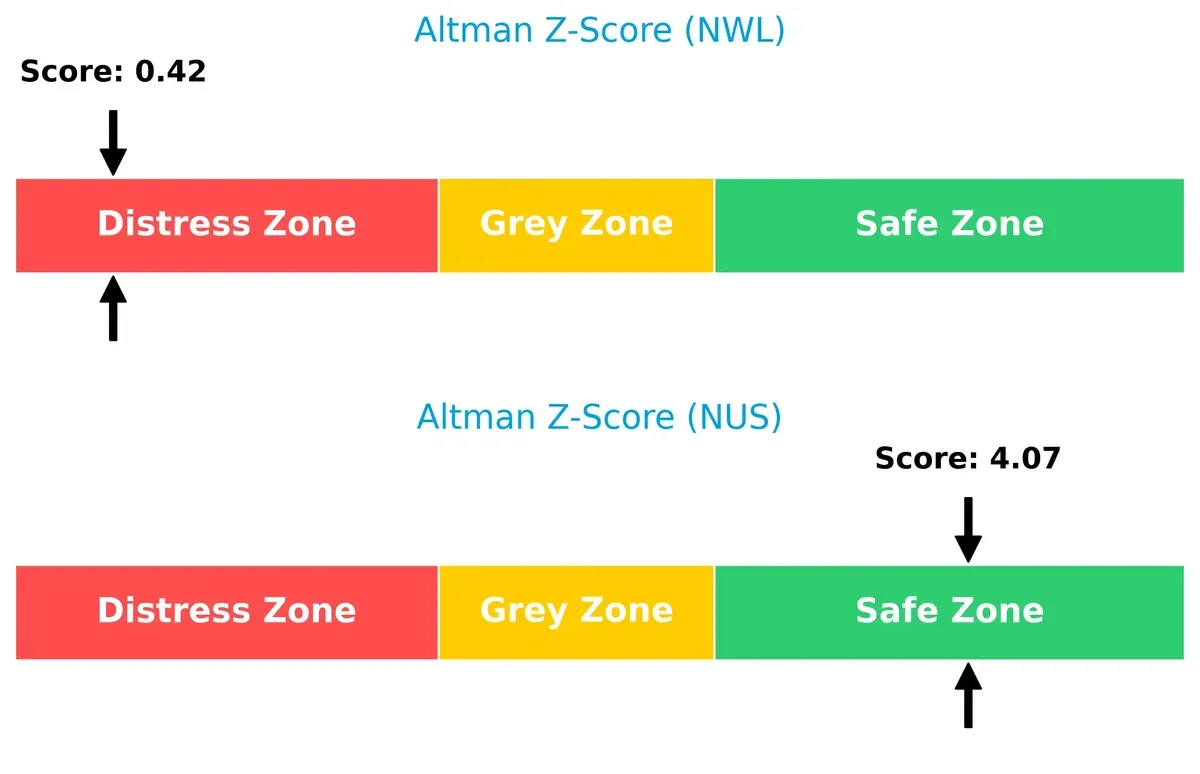
Bankruptcy Risk: Solvency Showdown
Nu Skin’s Altman Z-Score of 4.07 places it firmly in the safe zone, indicating robust long-term survival potential. Newell’s distress zone score of 0.42 signals acute bankruptcy risk, reflecting severe financial instability in this cycle:
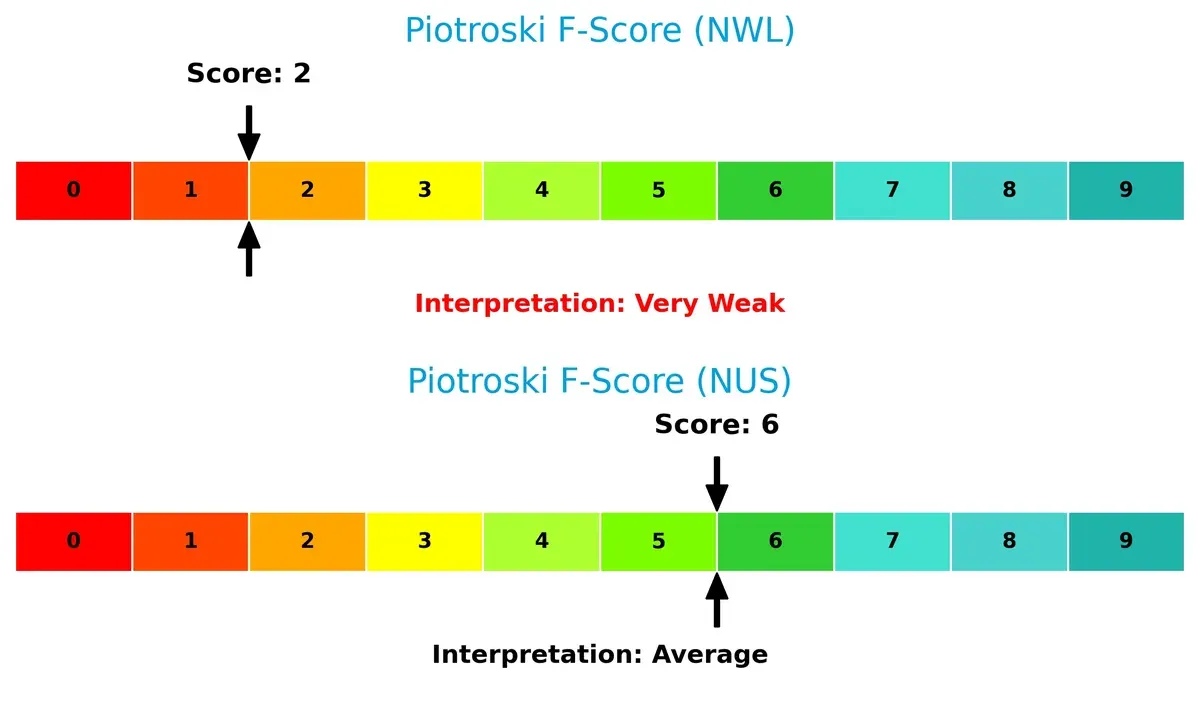
Financial Health: Quality of Operations
Nu Skin’s Piotroski F-Score of 6 suggests average financial health with no immediate red flags. Newell’s score of 2 signals very weak internal metrics and operational challenges, warning investors of potential financial distress:
How are the two companies positioned?
This section dissects the operational DNA of Newell Brands and Nu Skin by comparing their revenue distribution and internal dynamics. The goal is to confront their economic moats to identify which model offers the most resilient competitive advantage today.
Revenue Segmentation: The Strategic Mix
The following visual comparison dissects how Newell Brands Inc. and Nu Skin Enterprises, Inc. diversify their income streams and where their primary sector bets lie:
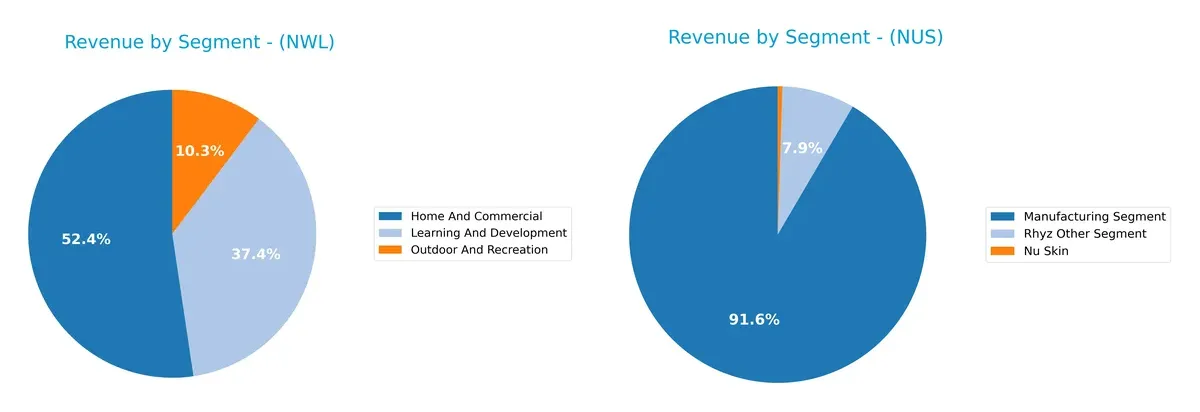
Newell Brands anchors revenue in Home And Commercial, generating $3.77B in 2025, backed by Learning And Development at $2.69B and Outdoor And Recreation at $741M. This mix shows moderate diversification across consumer segments. Nu Skin, however, pivots almost entirely on its Nu Skin segment, with $1.14B in 2025, while Manufacturing and Rhyz segments lag far behind. Nu Skin’s concentration signals concentration risk, whereas Newell’s segment spread suggests resilience through product diversity.
Strengths and Weaknesses Comparison
This table compares the Strengths and Weaknesses of Newell Brands Inc. (NWL) and Nu Skin Enterprises, Inc. (NUS):
NWL Strengths
- Diverse product segments including Home, Learning, Outdoor
- Significant North American and Foreign sales
- Favorable fixed asset turnover
- WACC below ROIC, indicating prudent capital cost management
NUS Strengths
- Strong net margin and ROE demonstrating high profitability
- Favorable leverage ratios with low debt-to-assets
- Broad global presence across Americas, Asia, and EMEA
- Favorable current and quick ratios indicate solid liquidity
NWL Weaknesses
- Negative net margin and ROE highlight profitability challenges
- High debt levels and weak interest coverage pose financial risk
- Low quick ratio signals potential liquidity constraints
NUS Weaknesses
- Unfavorable ROIC below WACC suggests inefficient capital use
- Interest coverage at zero flags potential solvency issues
Both companies show strengths in global reach and product diversification but differ markedly in profitability and financial health. NWL struggles with profitability and leverage, while NUS excels in returns and liquidity but faces capital efficiency and coverage risks. This contrast influences their strategic focus on operational efficiency and financial stability.
The Moat Duel: Analyzing Competitive Defensibility
A structural moat is the only reliable barrier protecting long-term profits from relentless competition erosion. Let’s examine how Newell Brands and Nu Skin defend their turf:
Newell Brands Inc. (NWL): Diverse Brand Portfolio with Cost Advantage
Newell’s moat stems from its broad brand portfolio and scale-driven cost advantages. Despite a declining ROIC and negative net margins, established household brands support stable gross margins near 34%. New product innovation and global reach could deepen resilience, but profitability erosion remains a risk in 2026.
Nu Skin Enterprises, Inc. (NUS): Intangible Assets Fueled by Brand Loyalty
Nu Skin relies on strong intangible assets and customer loyalty within the beauty and wellness niche. Its 69% gross margin and positive net margin signal pricing power unlike Newell’s. However, Nu Skin faces sharper revenue declines and a steep ROIC drop, challenging its ability to sustain value creation beyond 2026.
Moat Resilience: Cost Leadership vs. Brand Intangibles
Both companies show declining ROICs, signaling value destruction. Yet Newell’s cost-based moat spans multiple consumer categories, delivering steadier margins. Nu Skin’s intangible asset moat is narrower and more vulnerable to market shifts. I see Newell better positioned to defend market share amid intensifying competition.
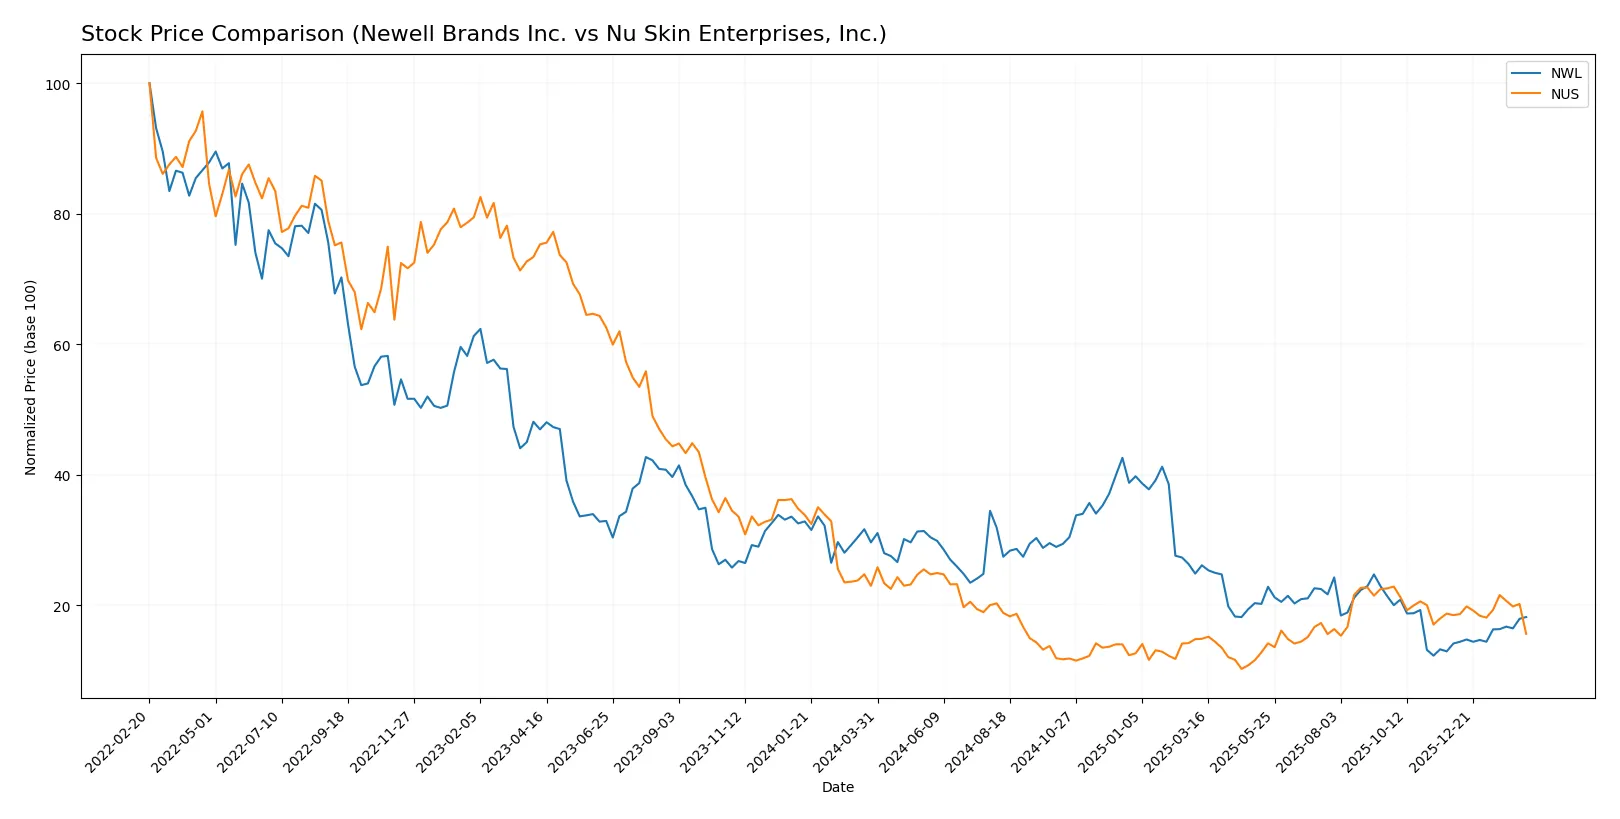
Which stock offers better returns?
The past year reveals contrasting price dynamics for Newell Brands Inc. and Nu Skin Enterprises, Inc., marked by divergent trends and distinct trading volumes.
Trend Comparison
Newell Brands Inc. shows a bearish trend over the past 12 months with a -38.64% price decline and accelerating downward momentum. Recently, it gained 28.77% since November 2025, signaling a short-term recovery phase.
Nu Skin Enterprises, Inc. also experienced a bearish trend with a -32.03% drop over the year and accelerating losses. Its recent trend remains negative, declining -15.47% since November 2025, reflecting persistent weakness.
Comparing both, Newell Brands posted the steepest overall decline but shows recent upward momentum. Nu Skin’s performance remains weaker overall and recently, placing Newell ahead on short-term recovery.
Target Prices
Analysts present a clear target consensus for Newell Brands Inc. and Nu Skin Enterprises, Inc.
| Company | Target Low | Target High | Consensus |
|---|---|---|---|
| Newell Brands Inc. | 4.5 | 8 | 5.83 |
| Nu Skin Enterprises, Inc. | 11 | 11 | 11 |
Newell Brands’ consensus target of 5.83 suggests moderate upside from the current 4.7 price. Nu Skin’s consensus at 11 indicates significant appreciation potential versus its 8.36 price.

Don’t Let Luck Decide Your Entry Point
Optimize your entry points with our advanced ProRealTime indicators. You’ll get efficient buy signals with precise price targets for maximum performance. Start outperforming now!
How do institutions grade them?
Newell Brands Inc. Grades
The following table summarizes recent institutional grades for Newell Brands Inc.:
| Grading Company | Action | New Grade | Date |
|---|---|---|---|
| Morgan Stanley | Maintain | Equal Weight | 2026-02-10 |
| Citigroup | Maintain | Neutral | 2026-02-09 |
| Canaccord Genuity | Maintain | Buy | 2026-01-26 |
| UBS | Maintain | Neutral | 2026-01-14 |
| Citigroup | Maintain | Neutral | 2026-01-14 |
| Citigroup | Maintain | Neutral | 2025-12-17 |
| UBS | Maintain | Neutral | 2025-12-02 |
| JP Morgan | Maintain | Overweight | 2025-11-03 |
| RBC Capital | Maintain | Sector Perform | 2025-11-03 |
| Citigroup | Maintain | Neutral | 2025-11-03 |
Nu Skin Enterprises, Inc. Grades
The following table summarizes recent institutional grades for Nu Skin Enterprises, Inc.:
| Grading Company | Action | New Grade | Date |
|---|---|---|---|
| DA Davidson | Maintain | Neutral | 2024-12-20 |
| Citigroup | Maintain | Neutral | 2024-10-22 |
| DA Davidson | Maintain | Neutral | 2024-08-12 |
| Citigroup | Maintain | Neutral | 2024-08-09 |
| DA Davidson | Maintain | Neutral | 2024-05-09 |
| DA Davidson | Maintain | Neutral | 2024-01-05 |
| Stifel | Maintain | Hold | 2023-10-16 |
| Stifel | Maintain | Hold | 2023-10-15 |
| Citigroup | Maintain | Neutral | 2023-09-29 |
| Citigroup | Maintain | Neutral | 2023-09-28 |
Which company has the best grades?
Newell Brands has received a broader range of grades, including Buy and Overweight ratings, indicating stronger institutional conviction. Nu Skin’s grades are consistently Neutral or Hold, suggesting more cautious sentiment. This divergence may influence investors seeking growth potential or stability.
Risks specific to each company
In 2026’s complex market environment, these categories expose critical pressure points and systemic threats confronting Newell Brands Inc. and Nu Skin Enterprises, Inc.:
1. Market & Competition
Newell Brands Inc.
- Faces intense competition in diverse consumer segments, challenging margin recovery.
Nu Skin Enterprises, Inc.
- Operates in a niche beauty and wellness market but faces fierce distributor rivalry and evolving consumer trends.
2. Capital Structure & Debt
Newell Brands Inc.
- High debt-to-equity (2.32) and weak interest coverage (0.06) raise distress concerns.
Nu Skin Enterprises, Inc.
- Maintains low leverage (debt-to-equity 0.35) but interest coverage is negligible, signaling potential cash flow constraints.
3. Stock Volatility
Newell Brands Inc.
- Beta of 0.93 suggests moderate market sensitivity and stable stock behavior.
Nu Skin Enterprises, Inc.
- Beta near 1.01 implies higher volatility aligned with market swings, increasing risk exposure.
4. Regulatory & Legal
Newell Brands Inc.
- Broad product portfolio exposes it to multiple regulatory environments, raising compliance complexity.
Nu Skin Enterprises, Inc.
- Health and wellness product regulation tightening globally could increase compliance costs and litigation risk.
5. Supply Chain & Operations
Newell Brands Inc.
- Complex global supply chains may suffer from inflation and logistics disruptions, pressuring margins.
Nu Skin Enterprises, Inc.
- Smaller scale and focus on direct sales reduce supply chain complexity but limit operational flexibility.
6. ESG & Climate Transition
Newell Brands Inc.
- Consumer pressure for sustainability demands capital allocation toward greener practices, increasing costs.
Nu Skin Enterprises, Inc.
- Faces increasing scrutiny on product ingredients and ethical sourcing, potentially impacting brand reputation.
7. Geopolitical Exposure
Newell Brands Inc.
- Global footprint exposes it to trade tensions and tariffs impacting raw material costs.
Nu Skin Enterprises, Inc.
- Significant sales in Mainland China raise risks from geopolitical tensions and regulatory shifts.
Which company shows a better risk-adjusted profile?
Nu Skin’s low leverage and higher profitability provide a stronger risk-adjusted foundation than Newell, despite Nu Skin’s volatility and geopolitical risks. Newell’s high debt and weak cash flow raise red flags. Nu Skin’s Altman Z-score of 4.07 vs. Newell’s 0.42 confirms superior financial stability. However, Nu Skin’s stock suffered an 18% drop recently, signaling investor concerns over growth and regulatory challenges. Overall, Nu Skin shows a more resilient risk profile with specific caution on emerging market exposure, while Newell demands close monitoring of its leverage and operational risks.
Final Verdict: Which stock to choose?
Newell Brands Inc. (NWL) demonstrates a superpower in tangible asset management and a strong fixed asset turnover, suggesting operational efficiency in its core manufacturing processes. However, its high leverage and deteriorating profitability remain points of vigilance. It fits portfolios that can tolerate distress-zone risk for potential turnaround opportunities.
Nu Skin Enterprises, Inc. (NUS) boasts a strategic moat in its recurring revenue model and solid balance sheet, reflected by favorable liquidity and lower debt ratios. Despite a declining ROIC trend, it offers better financial stability and a more consistent income profile. It suits investors focused on GARP – Growth at a Reasonable Price.
If you prioritize operational efficiency with a high-risk tolerance, Newell Brands might be the compelling choice due to its asset utilization strength despite financial headwinds. However, if you seek stability and a resilient recurring revenue base, Nu Skin offers better downside protection and a cleaner balance sheet, albeit with some profitability erosion.
Disclaimer: Investment carries a risk of loss of initial capital. The past performance is not a reliable indicator of future results. Be sure to understand risks before making an investment decision.
Go Further
I encourage you to read the complete analyses of Newell Brands Inc. and Nu Skin Enterprises, Inc. to enhance your investment decisions: