Home > Comparison > Consumer Defensive > ELF vs NWL
The strategic rivalry between e.l.f. Beauty, Inc. and Newell Brands Inc. shapes the consumer defensive sector’s competitive landscape. e.l.f. operates as a nimble, digitally driven cosmetics provider, while Newell Brands runs a diversified, capital-intensive product conglomerate. This analysis pits growth agility against scale and diversification. I will determine which corporate path offers a superior risk-adjusted return for a well-rounded investment portfolio.
Table of contents
Companies Overview
e.l.f. Beauty, Inc. and Newell Brands Inc. both hold significant positions in the household and personal products market.
e.l.f. Beauty, Inc.: Innovative Cosmetics Leader
e.l.f. Beauty stands out as a cosmetics and skincare provider primarily driving revenue through direct-to-consumer sales and retail partnerships. Its 2026 strategy emphasizes expanding its e-commerce presence and international distributor network, aiming to capture growing demand in affordable, high-quality personal care products.
Newell Brands Inc.: Diverse Consumer Goods Powerhouse
Newell Brands operates as a broad-based consumer product manufacturer spanning five segments, including home appliances and outdoor gear. It generates revenue through diverse retail channels, focusing in 2026 on optimizing its brand portfolio and enhancing operational efficiency across multiple consumer markets globally.
Strategic Collision: Similarities & Divergences
While both compete in consumer essentials, e.l.f. leverages a focused beauty ecosystem, and Newell embraces a diversified product portfolio across categories. Their primary battleground is retail channel dominance, with e.l.f. pushing direct sales and Newell relying on mass merchants. These distinctions shape their investment profiles: e.l.f. as a niche growth play, Newell as a diversified value proposition.
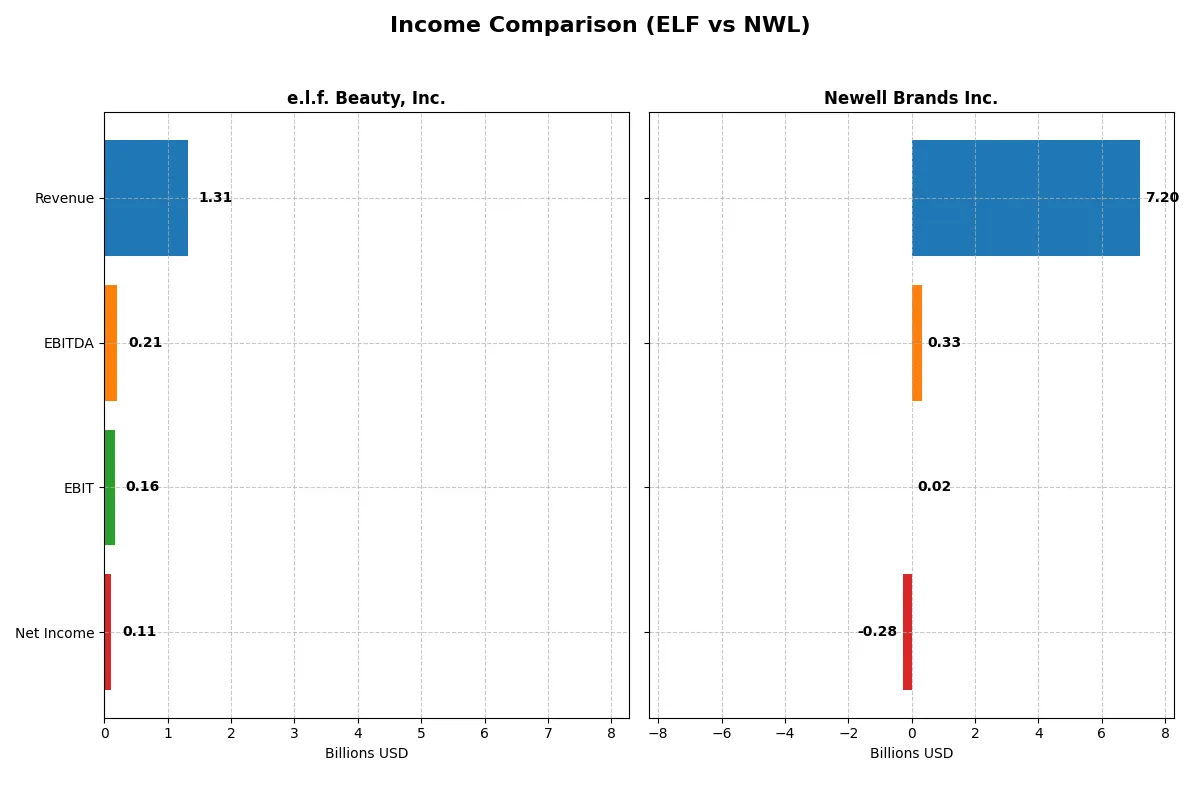
Income Statement Comparison
This data dissects the core profitability and scalability of both corporate engines to reveal who dominates the bottom line:
| Metric | e.l.f. Beauty, Inc. (ELF) | Newell Brands Inc. (NWL) |
|---|---|---|
| Revenue | 1.31B | 7.20B |
| Cost of Revenue | 378M | 4.77B |
| Operating Expenses | 778M | 1.99B |
| Gross Profit | 936M | 2.43B |
| EBITDA | 206M | 331M |
| EBIT | 162M | 20M |
| Interest Expense | 17M | 321M |
| Net Income | 112M | -285M |
| EPS | 1.99 | -0.68 |
| Fiscal Year | 2025 | 2025 |
Income Statement Analysis: The Bottom-Line Duel
The following income statement comparison exposes the true efficiency behind each company’s revenue and profit engines over recent years.
e.l.f. Beauty, Inc. Analysis
e.l.f. Beauty’s revenue surged from 318M in 2021 to 1.31B in 2025, displaying robust growth momentum. Gross margin remains strong at 71.24%, while net margin held a favorable 8.53% in 2025. Despite a one-year net income dip, the company demonstrated efficient cost control and margin expansion overall.
Newell Brands Inc. Analysis
Newell Brands’ revenue declined from 10.6B in 2021 to 7.2B in 2025, reflecting shrinking top-line scale. Gross margin held steady at 33.76%, but net margin slipped into negative territory at -3.96% in 2025. EBIT margin barely broke even, signaling operational challenges and heavy interest burdens undermining profitability.
Growth Momentum vs. Margin Stability
e.l.f. Beauty outpaces Newell Brands with robust revenue and net income growth, driven by superior margin management and expanding profitability. Conversely, Newell struggles with declining revenues and deep net losses. For investors, e.l.f. offers a growth-oriented profile with improving margins, while Newell presents significant turnaround risks and weaker earnings fundamentals.
Financial Ratios Comparison
These vital ratios act as a diagnostic tool to expose the underlying fiscal health, valuation premiums, and capital efficiency of the companies compared below:
| Ratios | e.l.f. Beauty, Inc. (ELF) | Newell Brands Inc. (NWL) |
|---|---|---|
| ROE | 14.7% | -11.9% |
| ROIC | 11.2% | 5.1% |
| P/E | 31.5 | -5.5 |
| P/B | 4.64 | 0.65 |
| Current Ratio | 3.05 | 1.07 |
| Quick Ratio | 2.00 | 0.57 |
| D/E | 0.41 | 2.32 |
| Debt-to-Assets | 25.1% | 51.7% |
| Interest Coverage | 9.20 | 1.39 |
| Asset Turnover | 1.05 | 0.67 |
| Fixed Asset Turnover | 45.6 | 4.33 |
| Payout Ratio | 0% | -42.1% |
| Dividend Yield | 0% | 7.7% |
| Fiscal Year | 2025 | 2025 |
Efficiency & Valuation Duel: The Vital Signs
Financial ratios act as a company’s DNA, exposing hidden risks and operational excellence that shape investment decisions.
e.l.f. Beauty, Inc.
e.l.f. Beauty posts a solid 14.7% ROE and an 8.5% net margin, signaling decent profitability. Yet, its P/E ratio of 31.5 suggests the stock trades at a premium, which may be stretched relative to earnings. The company pays no dividend, instead reinvesting cash flow into growth and operational efficiency, reflecting a focus on long-term value creation.
Newell Brands Inc.
Newell struggles with a negative ROE of -11.9% and a net margin of -4%, highlighting profitability challenges. However, its low P/E of -5.5 and P/B of 0.65 imply the stock is undervalued or distressed. Newell offers a 7.7% dividend yield, signaling cash returns to shareholders despite operational headwinds, but high debt raises notable risks.
Premium Valuation vs. Operational Safety
e.l.f. Beauty shows stronger profitability but commands a premium valuation. Newell offers attractive yield and valuation but suffers from weak returns and high leverage. Investors seeking growth may prefer e.l.f., while income-focused investors might find Newell’s dividend appealing despite risks.
Which one offers the Superior Shareholder Reward?
I observe that e.l.f. Beauty (ELF) pays no dividends but reinvests heavily in growth, supported by strong free cash flow of 2.05/share and a disciplined buyback program. Newell Brands (NWL) delivers a 2.85% dividend yield with a negative net margin and weak free cash flow of 0.04/share, but maintains a modest buyback. ELF’s zero payout ratio and robust cash flow coverage suggest a sustainable, growth-focused model. NWL’s dividend appears risky given its negative profitability and high leverage. I conclude ELF offers the superior total shareholder return in 2026, driven by reinvestment and buybacks over a precarious dividend.
Comparative Score Analysis: The Strategic Profile
The radar chart reveals the fundamental DNA and trade-offs of e.l.f. Beauty, Inc. and Newell Brands Inc., highlighting their financial strengths and vulnerabilities:
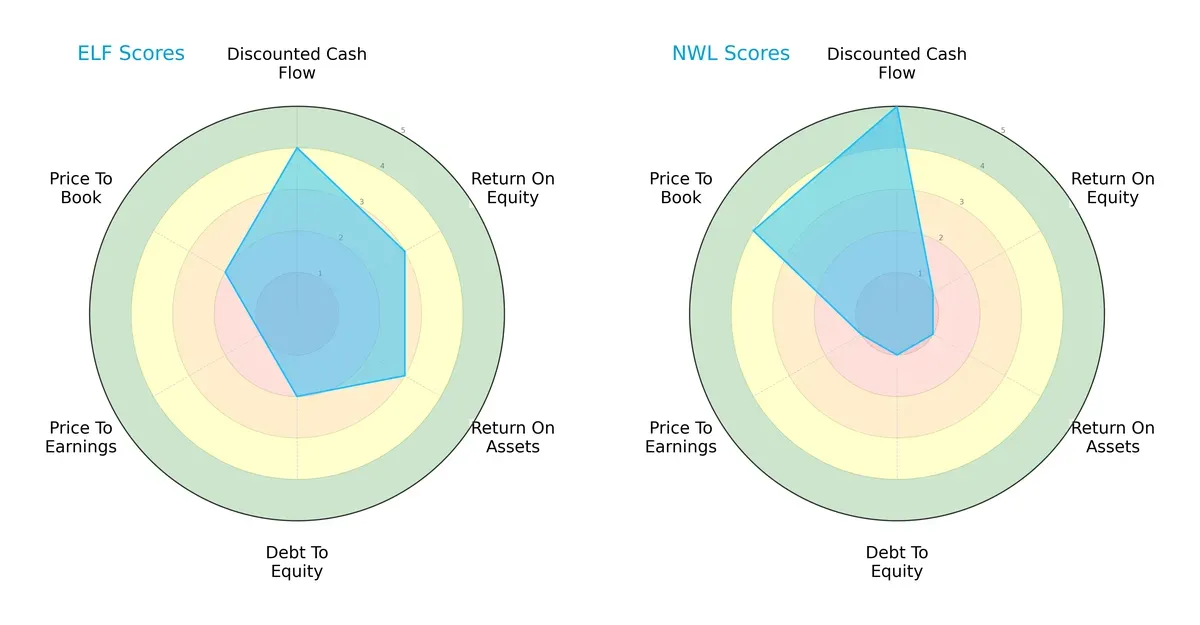
e.l.f. Beauty shows a balanced profile with moderate scores in ROE (3) and ROA (3), and a favorable DCF score (4), despite weaker debt (2) and valuation metrics (PE 1, PB 2). Newell Brands relies heavily on a very favorable DCF score (5) but struggles with profitability (ROE 1, ROA 1), high leverage (debt 1), and poor P/E (1), though it scores better on P/B (4). e.l.f. Beauty’s more even distribution signals steadier operational efficiency, while Newell’s edge lies in cash flow valuation but with significant financial risks.
Bankruptcy Risk: Solvency Showdown
The Altman Z-Score delta places e.l.f. Beauty in a safe zone at 3.6, while Newell Brands languishes in the distress zone at 0.8, indicating starkly different bankruptcy risks in this cycle:
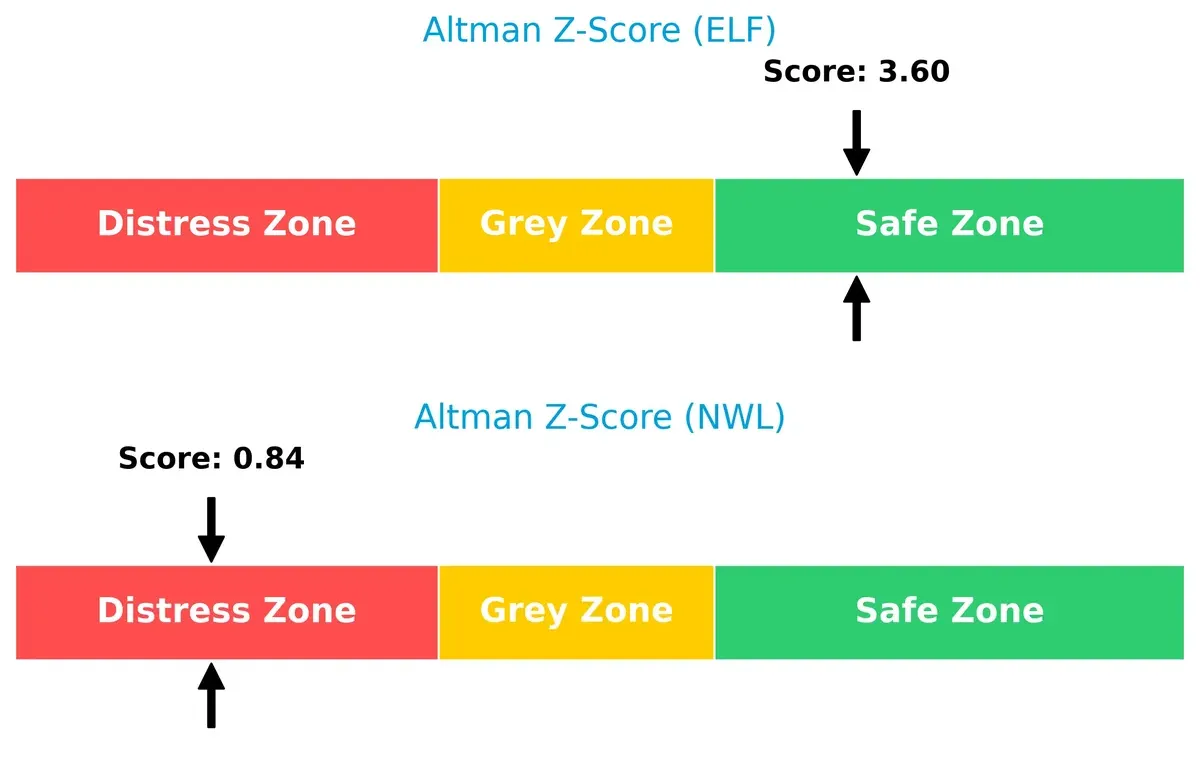
e.l.f. Beauty’s score above 3 signals strong solvency and resilience against economic downturns. Conversely, Newell’s sub-1 score warns of acute financial distress and potential default risk, making it a higher-risk choice for long-term investors.
Financial Health: Quality of Operations
e.l.f. Beauty posts an average Piotroski F-Score of 5, whereas Newell Brands scores a weak 2, flagging significant operational concerns:
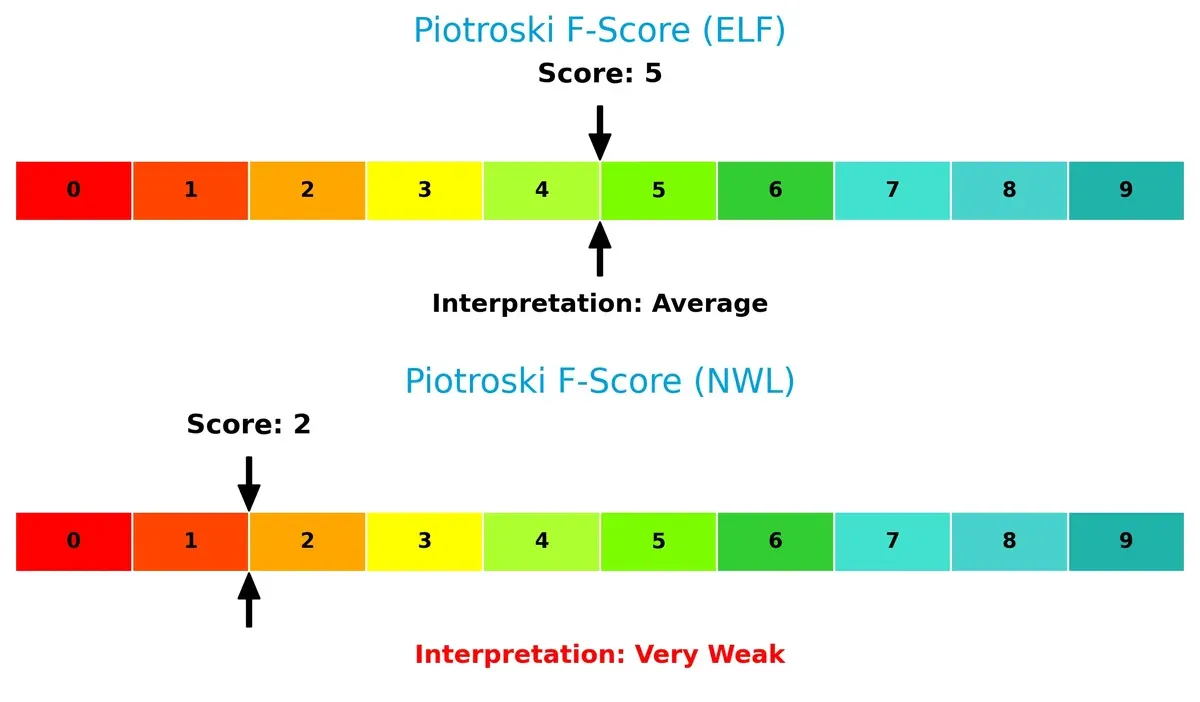
A Piotroski score of 5 suggests e.l.f. Beauty maintains moderate financial discipline and internal efficiencies. Newell’s score of 2 reveals red flags in profitability, leverage, or liquidity metrics, undermining its financial quality and signaling caution for risk-averse investors.
How are the two companies positioned?
This section dissects the operational DNA of e.l.f. Beauty and Newell Brands by comparing their revenue distribution and internal dynamics. The goal is to confront their economic moats and identify which business model offers the most resilient, sustainable competitive advantage today.
Revenue Segmentation: The Strategic Mix
This visual comparison dissects how e.l.f. Beauty, Inc. and Newell Brands Inc. diversify their income streams and where their primary sector bets lie:
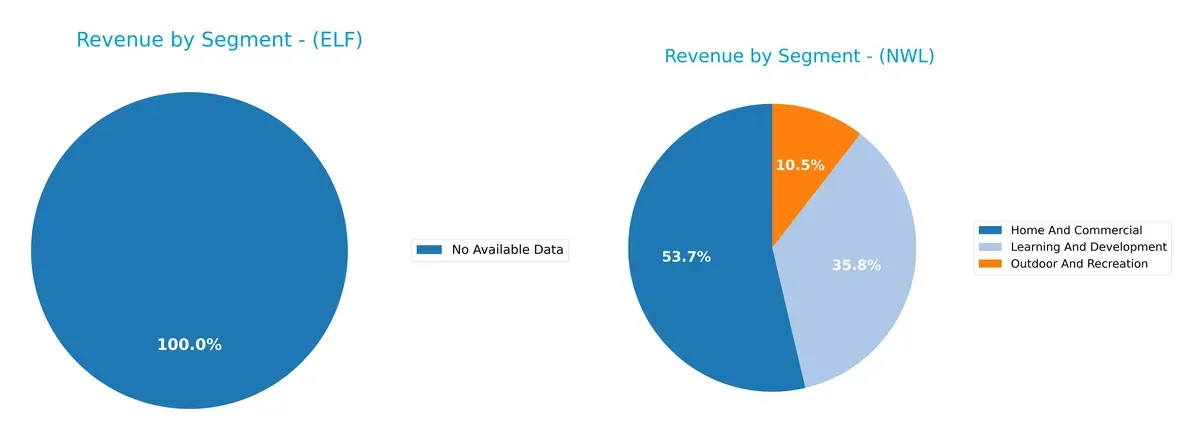
Newell Brands anchors its revenue in a diversified portfolio, with significant contributions from Home And Commercial ($4.07B in 2024), Learning And Development ($2.72B), and Outdoor And Recreation ($794M). In contrast, I found no available data to evaluate e.l.f. Beauty’s segmentation. Newell’s mix reduces concentration risk and leverages multiple consumer ecosystems, signaling robust strategic positioning through varied market exposure.
Strengths and Weaknesses Comparison
This table compares the strengths and weaknesses of e.l.f. Beauty (ELF) and Newell Brands (NWL):
ELF Strengths
- Strong liquidity with quick ratio of 2.0
- Low debt-to-equity of 0.41 supports financial stability
- Favorable interest coverage at 9.44 indicates debt service capacity
- High fixed asset turnover of 45.63 shows efficient asset use
NWL Strengths
- Diverse product segments including Home, Learning, Outdoor
- Global presence with substantial foreign and North America revenue
- Favorable WACC at 5.81% reduces capital costs
- Low price-to-book of 0.65 suggests undervaluation
ELF Weaknesses
- ROIC (11.21%) slightly below WACC (11.28%) signals value erosion
- Unfavorable current ratio at 3.05 may indicate working capital concerns
- High P/E of 31.49 reflects stretched valuation
- No dividend yield limits income for investors
NWL Weaknesses
- Negative net margin (-3.96%) and ROE (-11.92%) indicate unprofitability
- High debt-to-equity of 2.32 and debt/assets at 51.69% increase leverage risk
- Weak quick ratio of 0.57 suggests liquidity constraints
- Very low interest coverage (0.06) raises solvency concerns
Both companies show contrasting financial profiles. ELF benefits from efficient asset use and liquidity but faces valuation and capital return challenges. NWL offers diversification and cost-effective capital but struggles with profitability and financial leverage, impacting its risk profile. This comparison highlights differing strategic priorities and financial health.
The Moat Duel: Analyzing Competitive Defensibility
A structural moat is the sole shield protecting long-term profits from competitive erosion. Let’s dissect the moats of two industry players:
e.l.f. Beauty, Inc.: Brand-Driven Margin Resilience
e.l.f. leverages strong brand loyalty and product innovation to maintain high gross margins (71%) and stable EBIT margins (12%). Its expanding direct-to-consumer channels deepen this moat, though rising operating expenses pose margin pressure in 2026.
Newell Brands Inc.: Diversified Product Portfolio Under Strain
Newell’s moat stems from a broad product mix and legacy brand recognition. However, thin EBIT margins (0.3%) and declining ROIC reveal weakening competitive positioning. Future growth hinges on successful portfolio rationalization and market adaptation.
Verdict: Brand Loyalty vs. Portfolio Complexity
e.l.f. Beauty boasts a wider, more sustainable moat with growing profitability and strong consumer appeal. Newell struggles with value destruction and shrinking returns. e.l.f. is better equipped to defend market share amid 2026’s competitive pressures.
Which stock offers better returns?
The stock price trends of e.l.f. Beauty, Inc. and Newell Brands Inc. reveal significant declines over the past year, with recent recovery phases showing contrasting momentum and trading behavior.
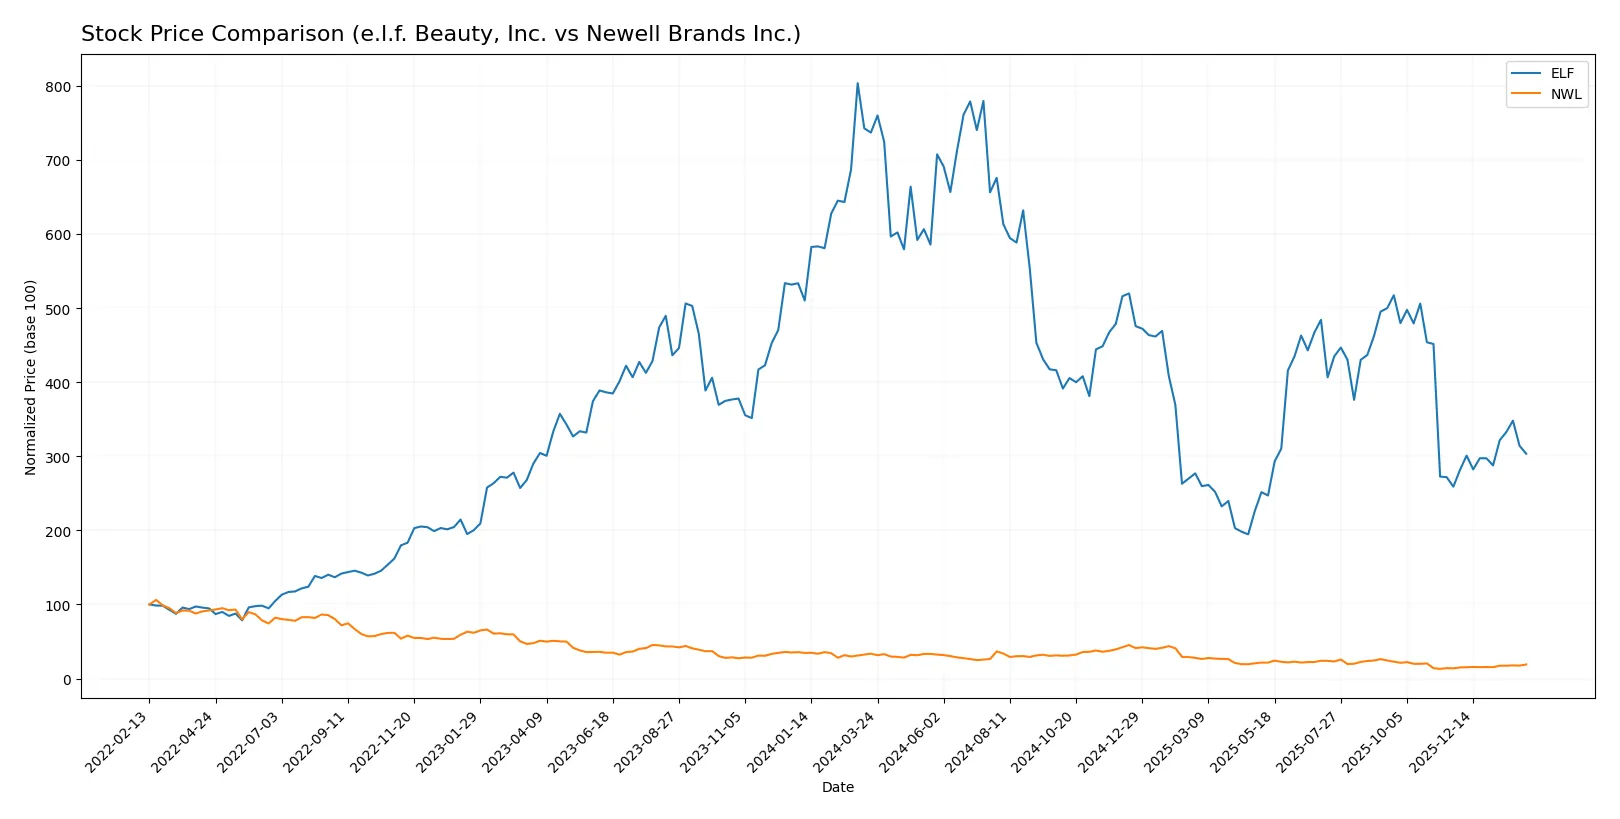
Trend Comparison
e.l.f. Beauty’s stock dropped 58.83% over the last 12 months, marking a bearish trend with accelerating decline and high volatility. A recent 17.19% rebound shows early recovery signs.
Newell Brands’ shares fell 43.4% in the same period, also bearish with accelerating losses but far lower volatility. Recently, the stock surged 38.62%, demonstrating stronger upward momentum.
Comparing both, Newell Brands outperformed e.l.f. Beauty overall, delivering a less severe decline and a more pronounced recent rally in market performance.
Target Prices
Analysts present a cautious yet optimistic consensus on e.l.f. Beauty and Newell Brands.
| Company | Target Low | Target High | Consensus |
|---|---|---|---|
| e.l.f. Beauty, Inc. | 85 | 165 | 112.86 |
| Newell Brands Inc. | 4.25 | 8 | 5.58 |
e.l.f. Beauty’s target consensus of 113 suggests upside from its current 82 price, reflecting growth expectations. Newell Brands’ 5.58 consensus modestly exceeds its 4.63 market price, indicating moderate confidence.

Don’t Let Luck Decide Your Entry Point
Optimize your entry points with our advanced ProRealTime indicators. You’ll get efficient buy signals with precise price targets for maximum performance. Start outperforming now!
How do institutions grade them?
Here is a summary of recent institutional grades for both companies:
e.l.f. Beauty, Inc. Grades
The table below shows recent grades from major financial institutions for e.l.f. Beauty, Inc.:
| Grading Company | Action | New Grade | Date |
|---|---|---|---|
| JP Morgan | Maintain | Overweight | 2026-02-05 |
| UBS | Maintain | Neutral | 2026-02-05 |
| Citigroup | Maintain | Buy | 2026-02-05 |
| TD Cowen | Maintain | Buy | 2026-01-21 |
| UBS | Maintain | Neutral | 2026-01-14 |
| Piper Sandler | Maintain | Neutral | 2025-12-22 |
| JP Morgan | Maintain | Overweight | 2025-12-18 |
| Goldman Sachs | Maintain | Buy | 2025-11-07 |
| JP Morgan | Maintain | Overweight | 2025-11-06 |
| UBS | Maintain | Neutral | 2025-11-06 |
Newell Brands Inc. Grades
The table below shows recent grades from major financial institutions for Newell Brands Inc.:
| Grading Company | Action | New Grade | Date |
|---|---|---|---|
| Canaccord Genuity | Maintain | Buy | 2026-01-26 |
| UBS | Maintain | Neutral | 2026-01-14 |
| Citigroup | Maintain | Neutral | 2026-01-14 |
| Citigroup | Maintain | Neutral | 2025-12-17 |
| UBS | Maintain | Neutral | 2025-12-02 |
| Canaccord Genuity | Maintain | Buy | 2025-11-03 |
| RBC Capital | Maintain | Sector Perform | 2025-11-03 |
| Citigroup | Maintain | Neutral | 2025-11-03 |
| JP Morgan | Maintain | Overweight | 2025-11-03 |
| JP Morgan | Maintain | Overweight | 2025-10-23 |
Which company has the best grades?
e.l.f. Beauty, Inc. consistently receives Buy and Overweight grades, while Newell Brands has a mix of Buy, Neutral, and Sector Perform ratings. This suggests stronger analyst confidence in e.l.f. Beauty’s upside potential, which may influence investor sentiment accordingly.
Risks specific to each company
The following categories identify the critical pressure points and systemic threats facing both firms in the 2026 market environment:
1. Market & Competition
e.l.f. Beauty, Inc.
- Faces intense competition in cosmetics and skincare, with pressure on innovation and brand loyalty.
Newell Brands Inc.
- Competes across diverse consumer products, facing margin pressure and brand portfolio complexity.
2. Capital Structure & Debt
e.l.f. Beauty, Inc.
- Maintains moderate leverage with debt-to-assets at 25%, manageable interest coverage at 9.44x.
Newell Brands Inc.
- High leverage with debt-to-assets at 52%, poor interest coverage at 0.06x signals distress.
3. Stock Volatility
e.l.f. Beauty, Inc.
- Beta 1.68 indicates higher volatility than the market, reflecting growth stock behavior.
Newell Brands Inc.
- Beta 0.93 shows less volatility, but stock price remains low and unstable.
4. Regulatory & Legal
e.l.f. Beauty, Inc.
- Subject to cosmetic product safety regulations and international trade compliance.
Newell Brands Inc.
- Faces regulatory scrutiny across multiple product categories and geographies.
5. Supply Chain & Operations
e.l.f. Beauty, Inc.
- Relies on global retail and e-commerce channels; supply chain disruptions could hurt revenue.
Newell Brands Inc.
- Complex supply chain across diverse segments increases operational risk.
6. ESG & Climate Transition
e.l.f. Beauty, Inc.
- Increasing pressure to adopt sustainable packaging and ethical sourcing.
Newell Brands Inc.
- Larger footprint demands aggressive ESG initiatives to meet investor expectations.
7. Geopolitical Exposure
e.l.f. Beauty, Inc.
- International sales expose it to trade tensions and foreign market volatility.
Newell Brands Inc.
- Global operations subject to geopolitical risks impacting sourcing and sales.
Which company shows a better risk-adjusted profile?
e.l.f. Beauty faces high market competition and volatility but manages leverage well and stays in a safe financial zone. Newell Brands struggles with high debt and financial distress signals, despite a broader product base. The dominant risk for e.l.f. is market competition and valuation pressure. For Newell, excessive leverage and weak profitability pose the greatest threat. Given its Altman Z-score in the safe zone versus Newell’s distress zone, e.l.f. Beauty shows a better risk-adjusted profile. The stark contrast in interest coverage ratios (9.44x vs. 0.06x) underscores Newell’s precarious financial health, justifying cautious investor scrutiny.
Final Verdict: Which stock to choose?
e.l.f. Beauty, Inc. shines with its superpower of rapid revenue growth and improving profitability, signaling a dynamic cash generator. Its point of vigilance lies in a high valuation and a current ratio that suggests liquidity management challenges. This stock suits an aggressive growth portfolio ready to weather volatility for outsized returns.
Newell Brands Inc. offers a strategic moat rooted in its entrenched brand portfolio and steady cash flow, providing relative safety compared to e.l.f. However, its declining profitability and heavy debt burden temper enthusiasm. It fits best within a GARP portfolio that values stability and potential turnaround over explosive growth.
If you prioritize aggressive growth and can tolerate valuation risks, e.l.f. Beauty is the compelling choice due to its accelerating profitability and market momentum. However, if you seek stability and a defensive play with established brands, Newell Brands offers better resilience despite its profitability headwinds. Both come with notable risks; your portfolio strategy should weigh growth versus safety accordingly.
Disclaimer: Investment carries a risk of loss of initial capital. The past performance is not a reliable indicator of future results. Be sure to understand risks before making an investment decision.
Go Further
I encourage you to read the complete analyses of e.l.f. Beauty, Inc. and Newell Brands Inc. to enhance your investment decisions: