Home > Comparison > Communication Services > NFLX vs TKO
The strategic rivalry between Netflix, Inc. and TKO Group Holdings, Inc. defines the current trajectory of the Communication Services sector. Netflix operates as a global streaming powerhouse with a vast subscriber base, while TKO focuses on live events and diversified entertainment content across multiple platforms. This head-to-head pits a subscription-driven digital model against a multifaceted media enterprise. This analysis aims to identify which company offers superior risk-adjusted returns for a diversified portfolio.
Table of contents
Companies Overview
Netflix and TKO Group Holdings each shape global entertainment with distinct scales and strategies.
Netflix, Inc.: Streaming Powerhouse
Netflix dominates the streaming entertainment market with over 222M paid members globally. Its core revenue derives from subscription fees for TV series, films, documentaries, and mobile games. In 2026, Netflix focuses on content diversification and expanding international reach to sustain its competitive edge in a saturated market.
TKO Group Holdings, Inc.: Sports and Live Events Innovator
TKO Group Holdings operates a diversified entertainment platform across live events, media, sponsorships, and consumer products. Revenue streams include ticket sales, broadcasting rights, and merchandising. Its 2026 strategy emphasizes expanding digital content and leveraging corporate sponsorships to grow its global footprint in 170 countries.
Strategic Collision: Similarities & Divergences
Netflix pursues a subscription-based content ecosystem while TKO leverages a multi-segment approach blending live events with media and merchandising. Both compete fiercely for audience attention and advertising dollars in digital entertainment. Netflix offers scalability and global reach; TKO provides niche engagement with high-margin live experiences, reflecting contrasting investment profiles in growth versus diversification.
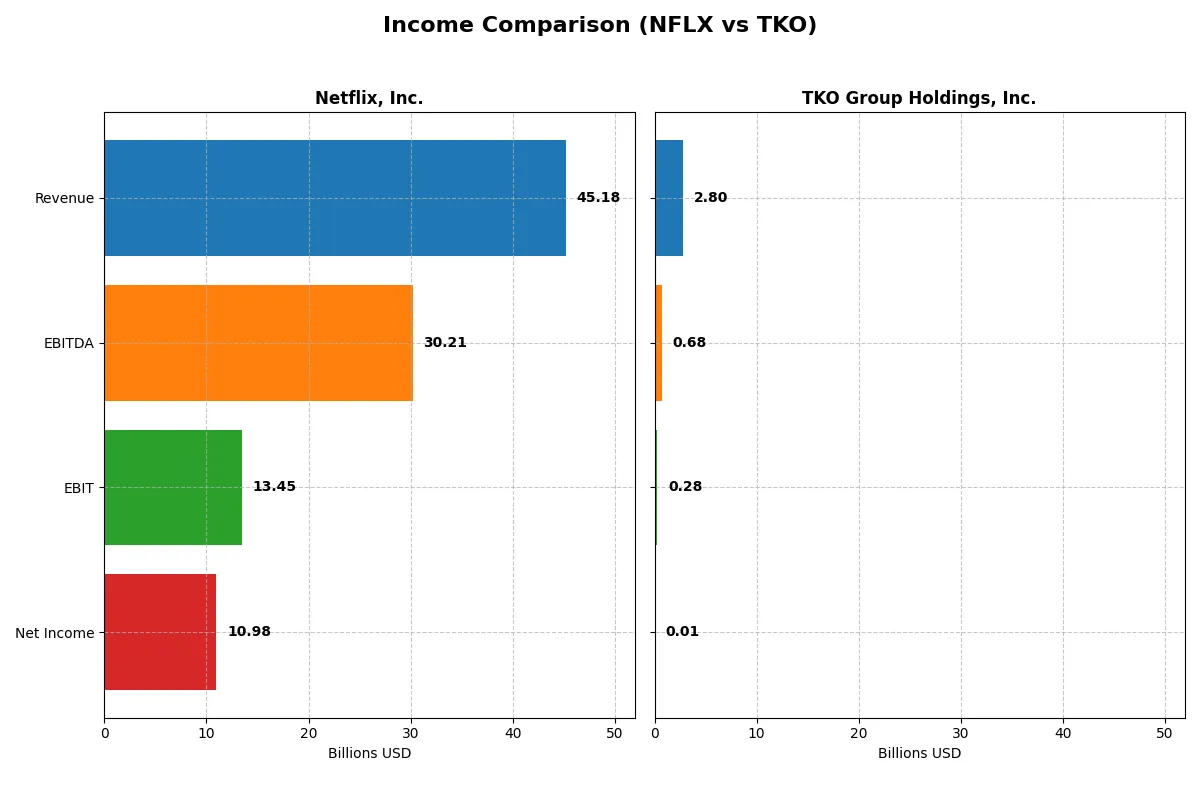
Income Statement Comparison
This data dissects the core profitability and scalability of both corporate engines to reveal who dominates the bottom line:
| Metric | Netflix, Inc. (NFLX) | TKO Group Holdings, Inc. (TKO) |
|---|---|---|
| Revenue | 45.2B | 2.8B |
| Cost of Revenue | 23.3B | 1.3B |
| Operating Expenses | 8.6B | 737M |
| Gross Profit | 21.9B | 1.5B |
| EBITDA | 30.2B | 676M |
| EBIT | 13.5B | 283M |
| Interest Expense | 777M | 249M |
| Net Income | 11.0B | 9.4M |
| EPS | 2.58 | 0.12 |
| Fiscal Year | 2025 | 2024 |
Income Statement Analysis: The Bottom-Line Duel
The following income statement comparison reveals each company’s operational efficiency and profitability under different market conditions.
Netflix, Inc. Analysis
Netflix shows a strong upward trajectory in revenue and net income, reaching $45.2B and $11B respectively in 2025. Its gross margin remains robust at 48.5%, while net margin stands at a healthy 24.3%. The company’s efficiency accelerates, with EBIT up 26% year-over-year, underscoring solid momentum and disciplined cost control.
TKO Group Holdings, Inc. Analysis
TKO’s revenue surged 67% in 2024 to $2.8B, with gross margin at a favorable 53.9%. However, net income barely registers at $9.4M, reflecting a razor-thin net margin of 0.34%. Despite impressive top-line growth, TKO’s EBIT dropped 37% year-over-year, indicating struggles in converting sales into profit efficiently.
Margin Power vs. Revenue Scale
Netflix dominates with superior margin health and consistent profit growth, while TKO impresses with rapid revenue expansion but weak bottom-line results. Netflix’s profile offers steady, scalable profitability. TKO’s high growth comes with elevated risk and volatile earnings, less appealing for risk-conscious investors.
Financial Ratios Comparison
These vital ratios act as a diagnostic tool to expose underlying fiscal health, valuation premiums, and capital efficiency for the companies compared below:
| Ratios | Netflix, Inc. (NFLX) | TKO Group Holdings, Inc. (TKO) |
|---|---|---|
| ROE | 41.3% | 0.2% |
| ROIC | 25.2% | 1.3% |
| P/E | 36.1 | 1228.7 |
| P/B | 14.9 | 2.83 |
| Current Ratio | 1.19 | 1.30 |
| Quick Ratio | 1.19 | 1.30 |
| D/E (Debt to Equity) | 0.54 | 0.74 |
| Debt-to-Assets | 26.0% | 23.9% |
| Interest Coverage | 17.2 | 3.11 |
| Asset Turnover | 0.81 | 0.22 |
| Fixed Asset Turnover | 22.5 | 3.48 |
| Payout Ratio | 0 | 7.15% |
| Dividend Yield | 0.00% | 0.58% |
| Fiscal Year | 2025 | 2024 |
Efficiency & Valuation Duel: The Vital Signs
Financial ratios serve as a company’s DNA, unveiling hidden risks and operational strengths that shape investor decisions.
Netflix, Inc.
Netflix demonstrates strong profitability with a 41.26% ROE and a 24.3% net margin, reflecting operational excellence. However, its valuation appears stretched, with a P/E ratio of 36.11 and P/B of 14.9. The firm returns value through reinvestment in growth and R&D, as it pays no dividend.
TKO Group Holdings, Inc.
TKO shows weak profitability, with a 0.23% ROE and 0.34% net margin, signaling operational challenges. Its valuation is highly stretched, evidenced by an extreme P/E of 1228.66 and a modest P/B of 2.83. The company struggles with shareholder returns, lacking dividends and showing limited free cash flow.
Premium Valuation vs. Operational Safety
Netflix offers a superior balance of solid profitability and growth reinvestment despite high valuation multiples. TKO’s inflated valuation contrasts with weak returns and operational inefficiency. Investors prioritizing operational safety and proven margins may lean toward Netflix, while TKO fits higher-risk profiles seeking turnaround potential.
Which one offers the Superior Shareholder Reward?
I observe that Netflix (NFLX) opts for zero dividends but reinvests heavily in growth, supported by a robust free cash flow of 2.24/share in 2025 and a strong operating margin near 30%. TKO pays a modest 0.58% dividend yield with a 7% payout ratio, alongside steady buybacks reflected in its 6.25/share free cash flow. NFLX’s zero payout and high FCF coverage suggest a sustainable growth model, while TKO’s modest dividends and buybacks offer immediate income but with higher financial leverage (3.1x vs. NFLX’s 2.1x). Given NFLX’s superior margins, lower debt burden, and reinvestment strategy, I conclude Netflix offers a more attractive total return profile for 2026 investors focused on long-term value creation.
Comparative Score Analysis: The Strategic Profile
The radar chart reveals the fundamental DNA and trade-offs of Netflix, Inc. and TKO Group Holdings, Inc., highlighting their financial strengths and vulnerabilities side by side:
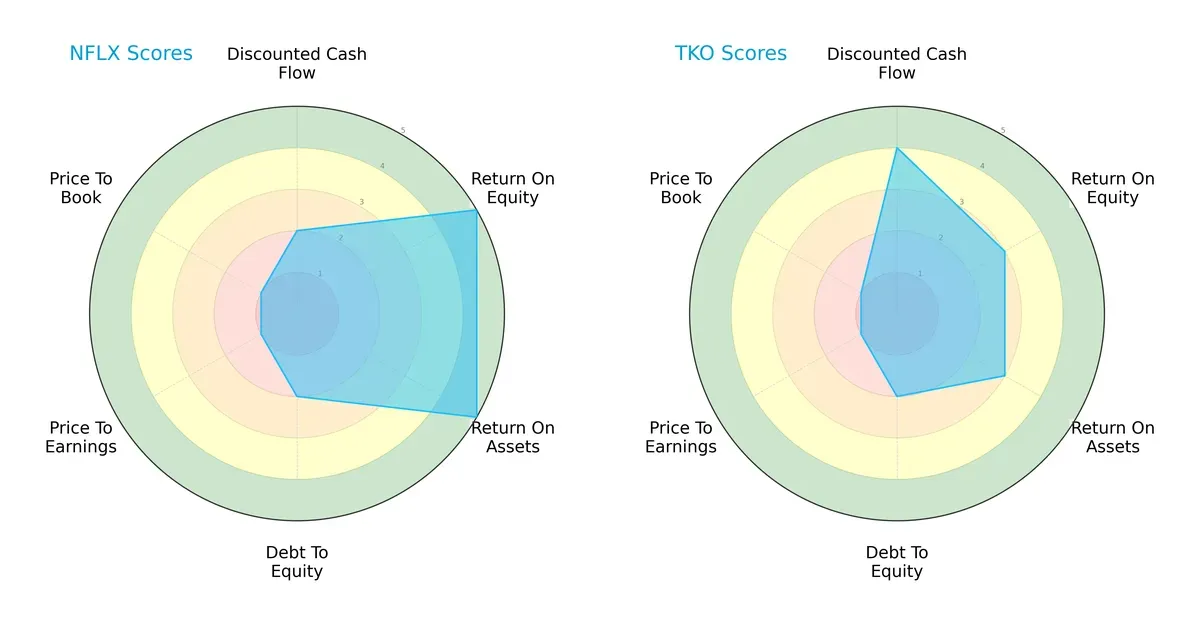
Netflix exhibits exceptional profitability with top ROE and ROA scores (5 each), reflecting efficient asset and equity use. However, it struggles with valuation metrics (P/E and P/B scores at 1), indicating potential overvaluation. TKO shows a stronger position in discounted cash flow (score 4) but lags in profitability (ROE and ROA at 3). Both share moderate debt management (Debt/Equity score 2). Netflix’s profile is less balanced, driven by operational efficiency, while TKO leans on cash flow valuation strength.
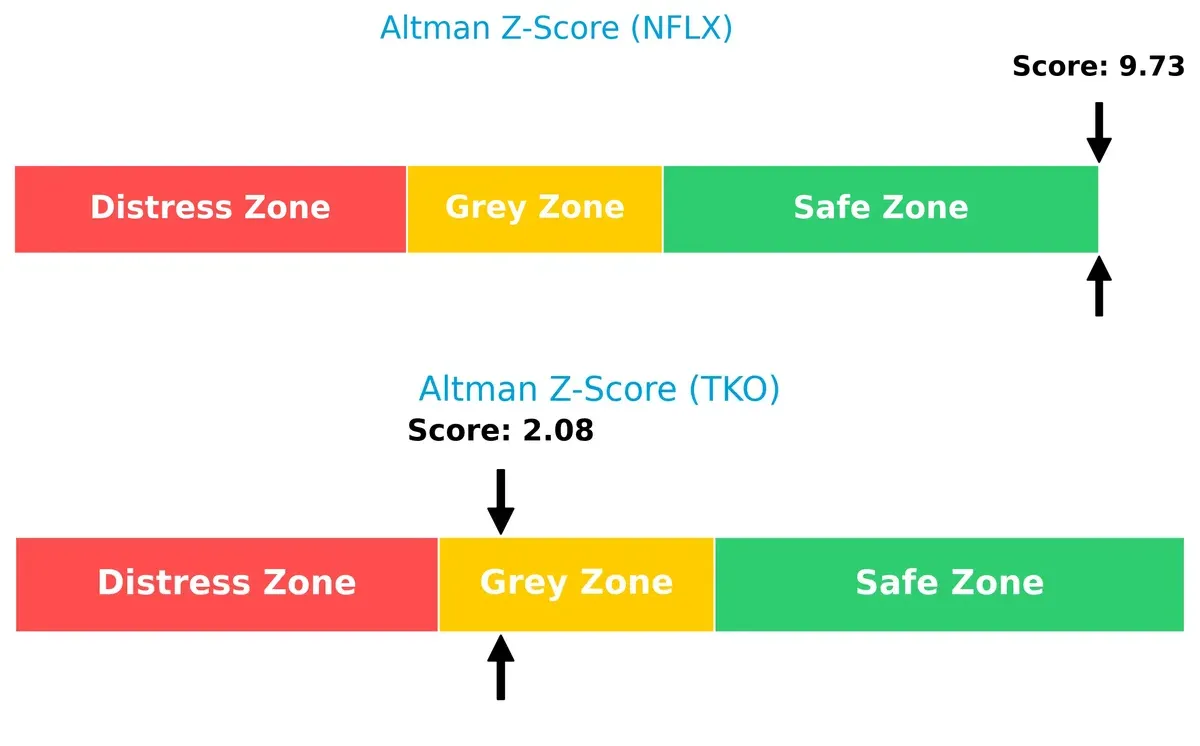
Bankruptcy Risk: Solvency Showdown
Netflix’s Altman Z-Score of 9.73 places it deep in the safe zone, signaling robust solvency and low bankruptcy risk. TKO’s score of 2.08 situates it in the grey zone, implying moderate financial distress risk in this cycle:
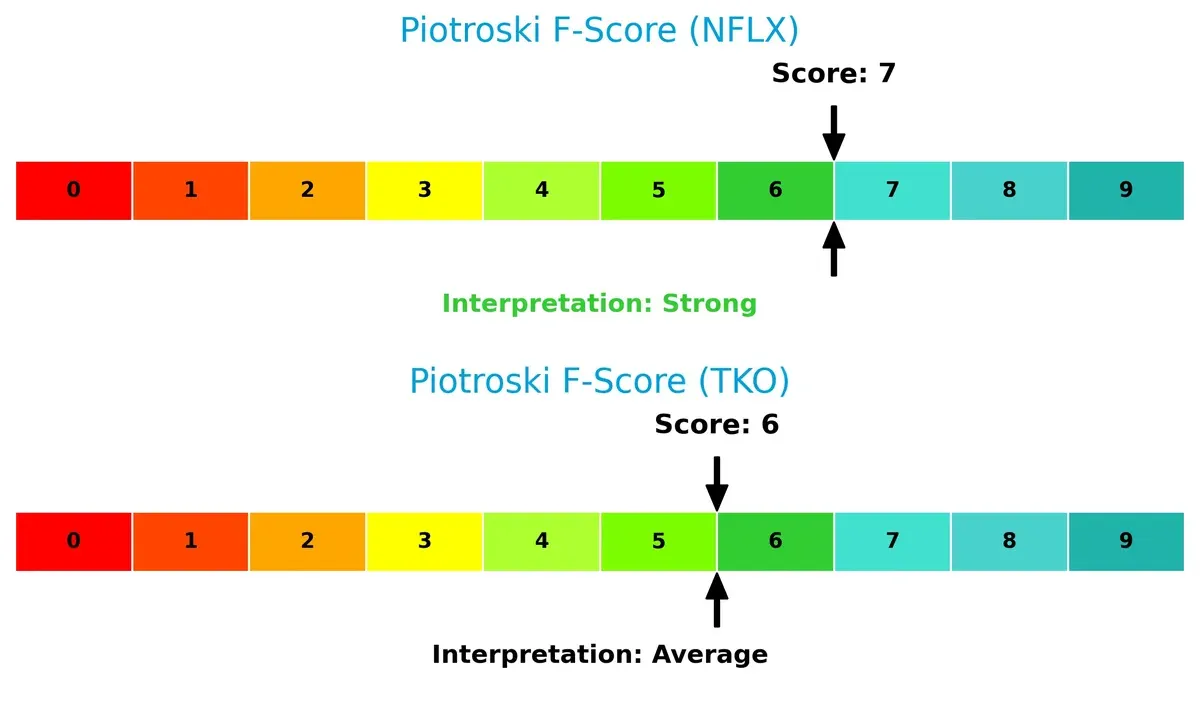
Financial Health: Quality of Operations
Netflix’s Piotroski F-Score of 7 signals strong financial health with sound profitability and operational metrics. TKO’s score of 6 is average, suggesting some internal weaknesses compared to Netflix, but no immediate red flags:
How are the two companies positioned?
This section dissects NFLX and TKO’s operational DNA by comparing revenue distribution and internal dynamics. The goal is to confront their economic moats and identify the more resilient, sustainable competitive advantage today.
Revenue Segmentation: The Strategic Mix
The following visual comparison dissects how both firms diversify their income streams and where their primary sector bets lie:
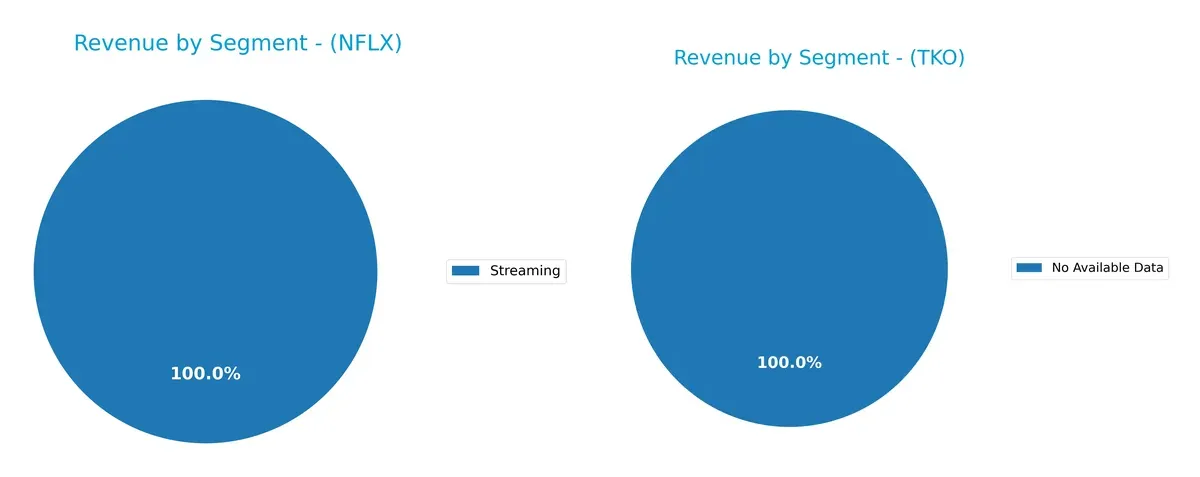
Netflix, Inc. relies almost entirely on its streaming segment, which dwarfs its modest domestic DVD revenue of under $100M in 2023. This concentration anchors Netflix’s strategic moat in content delivery and subscription scale. Conversely, TKO Group Holdings, Inc. lacks available data, preventing evaluation. Netflix’s single-segment dominance suggests strong ecosystem lock-in but also exposes it to risks if streaming trends shift.
Strengths and Weaknesses Comparison
This table compares the Strengths and Weaknesses of Netflix, Inc. and TKO Group Holdings, Inc.:
Netflix Strengths
- Strong global presence with $39B streaming revenue in 2024
- Diversified geographic revenue across US, EMEA, and Latin America
- High profitability with 24.3% net margin and 41.26% ROE
- Favorable ROIC at 25.22% exceeding WACC
- Solid financial stability with 1.19 quick ratio and low debt-to-assets
TKO Strengths
- Favorable WACC at 4.9% supports cost-effective capital
- Moderate geographic presence with $2.3B revenue mainly North America
- Favorable quick ratio at 1.3 reflects liquidity
- Favorable fixed asset turnover at 3.48 indicates efficient asset use
Netflix Weaknesses
- Elevated valuation ratios with PE at 36.11 and PB at 14.9
- WACC higher than ROIC indicating some capital inefficiency
- No dividend yield may deter income-focused investors
- Current ratio only neutral at 1.19
TKO Weaknesses
- Very low profitability with 0.34% net margin and 0.23% ROE
- Unfavorable interest coverage at 1.14 raises financial risk
- High PE of 1228.66 suggests overvaluation risk
- Low asset turnover at 0.22 indicates operational inefficiency
- Dividend yield status unfavorable despite 0.58% yield
Netflix’s strengths center on profitability and global scale, while TKO struggles with profitability and operational efficiency despite liquidity strengths. The weaknesses highlight valuation concerns for Netflix and significant earnings challenges for TKO, shaping strategic priorities differently.
The Moat Duel: Analyzing Competitive Defensibility
A structural moat is the only barrier protecting long-term profits from relentless competitive pressure and market disruption:
Netflix, Inc.: Streaming Giant with a Content and Scale Moat
Netflix’s moat stems from a vast subscriber base and exclusive content library, driving high ROIC and margin stability. In 2026, expanding mobile gaming and global markets could deepen this advantage.
TKO Group Holdings, Inc.: Live Events and Sponsorship Niche
TKO’s moat relies on live event exclusivity and sponsorships, contrasting Netflix’s digital scale. However, declining ROIC signals weakening profitability. Future growth hinges on expanding digital content and merchandise lines.
Exclusive Content vs. Live Event Dominance: Which Moat Holds Stronger?
Netflix exhibits a wider, more durable moat with growing ROIC and expanding global reach. TKO’s declining returns and value destruction suggest it struggles to defend market share effectively. Netflix remains better equipped.
Which stock offers better returns?
The past year shows stark contrasts in price movement: Netflix gained steadily but slowed recently, while TKO surged dramatically with recent acceleration.
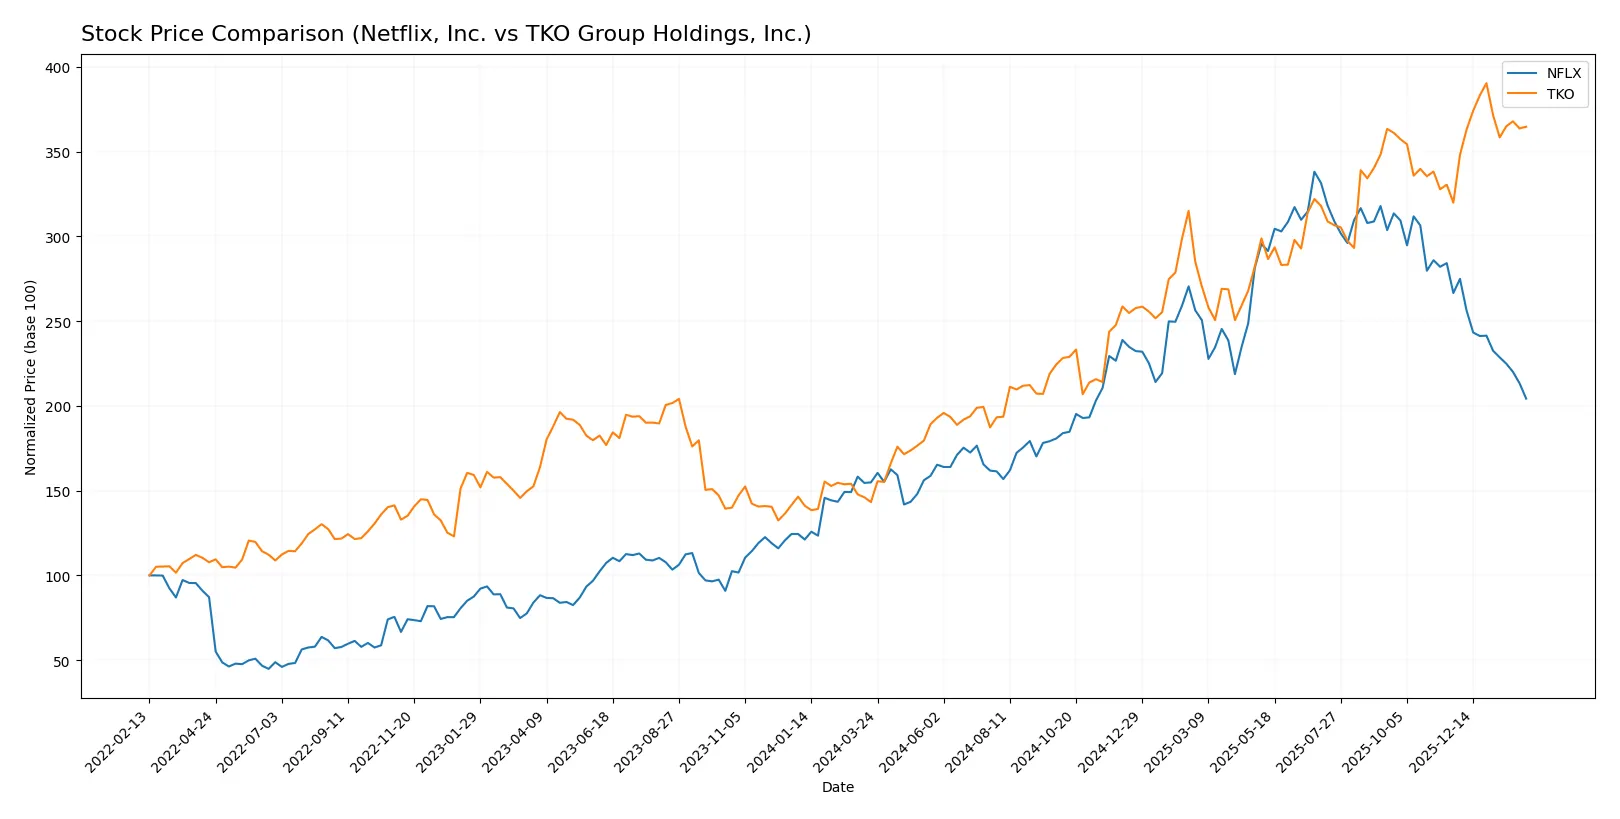
Trend Comparison
Netflix’s stock rose 31.94% over the last 12 months, indicating a bullish trend with decelerating momentum. It hit a high of 132.31 and a low of 55.5.
TKO’s stock soared 154.57% in the same period, marking a strong bullish trend but also decelerating. The price ranged from 79.79 to 217.44, showing greater volatility than Netflix.
TKO delivered the highest market performance, significantly outperforming Netflix with a larger overall price gain and recent upward momentum.
Target Prices
The consensus target prices indicate robust upside potential for both Netflix, Inc. and TKO Group Holdings, Inc.
| Company | Target Low | Target High | Consensus |
|---|---|---|---|
| Netflix, Inc. | 95 | 152 | 117.25 |
| TKO Group Holdings, Inc. | 210 | 251 | 230.2 |
Analysts expect Netflix’s stock to rise roughly 47% from its current 79.94 USD price, signaling confidence in growth. TKO’s consensus target implies a 13% gain from 203.12 USD, reflecting strong sector momentum.

Don’t Let Luck Decide Your Entry Point
Optimize your entry points with our advanced ProRealTime indicators. You’ll get efficient buy signals with precise price targets for maximum performance. Start outperforming now!
How do institutions grade them?
Netflix, Inc. Grades
The following table summarizes recent institutional grades for Netflix, Inc. by reputable firms.
| Grading Company | Action | New Grade | Date |
|---|---|---|---|
| Freedom Capital Markets | Upgrade | Buy | 2026-01-27 |
| Argus Research | Maintain | Buy | 2026-01-22 |
| Wedbush | Maintain | Outperform | 2026-01-21 |
| Deutsche Bank | Maintain | Hold | 2026-01-21 |
| Guggenheim | Maintain | Buy | 2026-01-21 |
| Wolfe Research | Maintain | Outperform | 2026-01-21 |
| Morgan Stanley | Maintain | Overweight | 2026-01-21 |
| Canaccord Genuity | Maintain | Buy | 2026-01-21 |
| Piper Sandler | Maintain | Overweight | 2026-01-21 |
| TD Cowen | Maintain | Buy | 2026-01-21 |
TKO Group Holdings, Inc. Grades
The table below displays current institutional grades for TKO Group Holdings, Inc. from established grading firms.
| Grading Company | Action | New Grade | Date |
|---|---|---|---|
| JP Morgan | Maintain | Overweight | 2026-01-21 |
| BTIG | Maintain | Buy | 2025-12-31 |
| Susquehanna | Maintain | Positive | 2025-12-10 |
| TD Cowen | Maintain | Buy | 2025-12-08 |
| JP Morgan | Maintain | Overweight | 2025-12-02 |
| BTIG | Maintain | Buy | 2025-11-18 |
| Seaport Global | Upgrade | Buy | 2025-10-15 |
| BTIG | Maintain | Buy | 2025-10-10 |
| Bernstein | Maintain | Outperform | 2025-10-06 |
| Guggenheim | Maintain | Buy | 2025-10-03 |
Which company has the best grades?
Netflix consistently earns Buy or better ratings, including Outperform and Overweight, from top-tier firms. TKO also receives strong Buy and Overweight grades but includes a Positive rating, which is less definitive. Netflix’s superior consensus grade profile suggests higher market confidence that may influence investor sentiment positively.
Risks specific to each company
The following categories identify the critical pressure points and systemic threats facing both firms in the 2026 market environment:
1. Market & Competition
Netflix, Inc.
- Faces intense streaming competition with fluctuating subscriber growth; high valuation pressures persist.
TKO Group Holdings, Inc.
- Operates in a niche sports-entertainment segment but contends with limited scale and market fragmentation.
2. Capital Structure & Debt
Netflix, Inc.
- Maintains a moderate debt-to-equity ratio of 0.54; strong interest coverage at 17.33 cushions financial risk.
TKO Group Holdings, Inc.
- Higher debt-to-equity at 0.74 and weak interest coverage of 1.14 signal tighter debt servicing capacity.
3. Stock Volatility
Netflix, Inc.
- Beta of 1.71 indicates higher market sensitivity and volatility relative to the S&P 500.
TKO Group Holdings, Inc.
- Low beta of 0.23 suggests defensive stock behavior but may limit upside in bull markets.
4. Regulatory & Legal
Netflix, Inc.
- Subject to evolving content regulation and data privacy laws across global markets.
TKO Group Holdings, Inc.
- Exposed to live event regulations and licensing compliance, with potential liabilities in sponsorship deals.
5. Supply Chain & Operations
Netflix, Inc.
- Relies on robust digital infrastructure but vulnerable to bandwidth and content delivery disruptions.
TKO Group Holdings, Inc.
- Dependent on live event logistics and merchandise supply chains, exposed to operational delays.
6. ESG & Climate Transition
Netflix, Inc.
- Faces pressure to reduce carbon footprint in data centers and production activities.
TKO Group Holdings, Inc.
- Must address sustainability in live events and merchandise production to meet rising ESG standards.
7. Geopolitical Exposure
Netflix, Inc.
- Operates in 190 countries, exposed to geopolitical risks, censorship, and trade restrictions.
TKO Group Holdings, Inc.
- Global footprint in 170 countries faces geopolitical event risks impacting live event scheduling.
Which company shows a better risk-adjusted profile?
Netflix’s strongest risk lies in fierce market competition and valuation challenges amid high volatility. TKO’s critical threat is weak financial health, especially debt servicing capacity. Netflix’s strong interest coverage and safer Altman Z-Score (9.7) reflect a more resilient balance sheet. Meanwhile, TKO’s Altman Z-Score in the grey zone (2.1) signals moderate distress risk. I see Netflix as better positioned for risk-adjusted returns despite market pressures, given its robust capital structure and financial strength.
Final Verdict: Which stock to choose?
Netflix, Inc. wields a strong competitive advantage through its highly efficient capital allocation and durable economic moat. Its ability to generate returns well above its cost of capital signals a robust value creator. A point of vigilance remains its premium valuation, which could limit near-term upside. It suits an aggressive growth portfolio focused on market leadership and innovation.
TKO Group Holdings, Inc. boasts rapid revenue expansion supported by a niche market presence, yet its financial metrics reveal challenges in profitability and capital efficiency. The company carries higher financial risk and a declining return on invested capital, suggesting caution. TKO fits portfolios seeking dynamic growth with a tolerance for volatility and operational turnaround.
If you prioritize sustainable profitability and proven capital efficiency, Netflix outshines with a durable moat and consistent value creation. However, if you seek high-reward scenarios with emerging market potential and accept elevated risk, TKO offers compelling growth albeit with financial caution. Each stock aligns with distinct investor profiles shaped by risk tolerance and strategic focus.
Disclaimer: Investment carries a risk of loss of initial capital. The past performance is not a reliable indicator of future results. Be sure to understand risks before making an investment decision.
Go Further
I encourage you to read the complete analyses of Netflix, Inc. and TKO Group Holdings, Inc. to enhance your investment decisions: