Home > Comparison > Communication Services > NFLX vs PSKY
The strategic rivalry between Netflix, Inc. and Paramount Skydance Corporation defines the current trajectory of the entertainment sector. Netflix operates as a global streaming pioneer with a direct-to-consumer model, while Paramount Skydance combines legacy media networks with diversified filmed content production. This analysis explores their contrasting approaches in a battle for market leadership, aiming to identify the superior risk-adjusted investment opportunity for a diversified portfolio in communication services.
Table of contents
Companies Overview
Netflix and Paramount Skydance stand as dominant forces reshaping entertainment consumption worldwide.
Netflix, Inc.: Streaming Pioneer and Content Powerhouse
Netflix, Inc. positions itself as a leading streaming entertainment provider with 222M paid members globally. Its core revenue stems from subscription fees for diverse TV series, films, documentaries, and mobile games delivered over internet-connected devices. In 2026, Netflix’s strategic focus remains on expanding content variety and international reach to sustain its dominant market position in streaming.
Paramount Skydance Corporation Class B Common Stock: Multimedia Conglomerate
Paramount Skydance operates as a multifaceted media and entertainment company with segments in TV media, direct-to-consumer streaming, and filmed entertainment. It generates revenue through broadcast networks, premium cable channels, and a portfolio of streaming services like Paramount+. In 2026, the company emphasizes integrated content production and distribution across platforms to maximize its global footprint.
Strategic Collision: Similarities & Divergences
Netflix pursues a pure-play streaming model emphasizing subscription growth and original content. Paramount Skydance adopts a diversified approach spanning broadcast, cable, and streaming, blending legacy media with digital expansion. Their primary battleground is the streaming wars, where content exclusivity and subscriber acquisition dictate success. Netflix offers a focused digital-first profile, while Paramount’s broader media mix provides varied revenue streams and risk exposure.
Income Statement Comparison
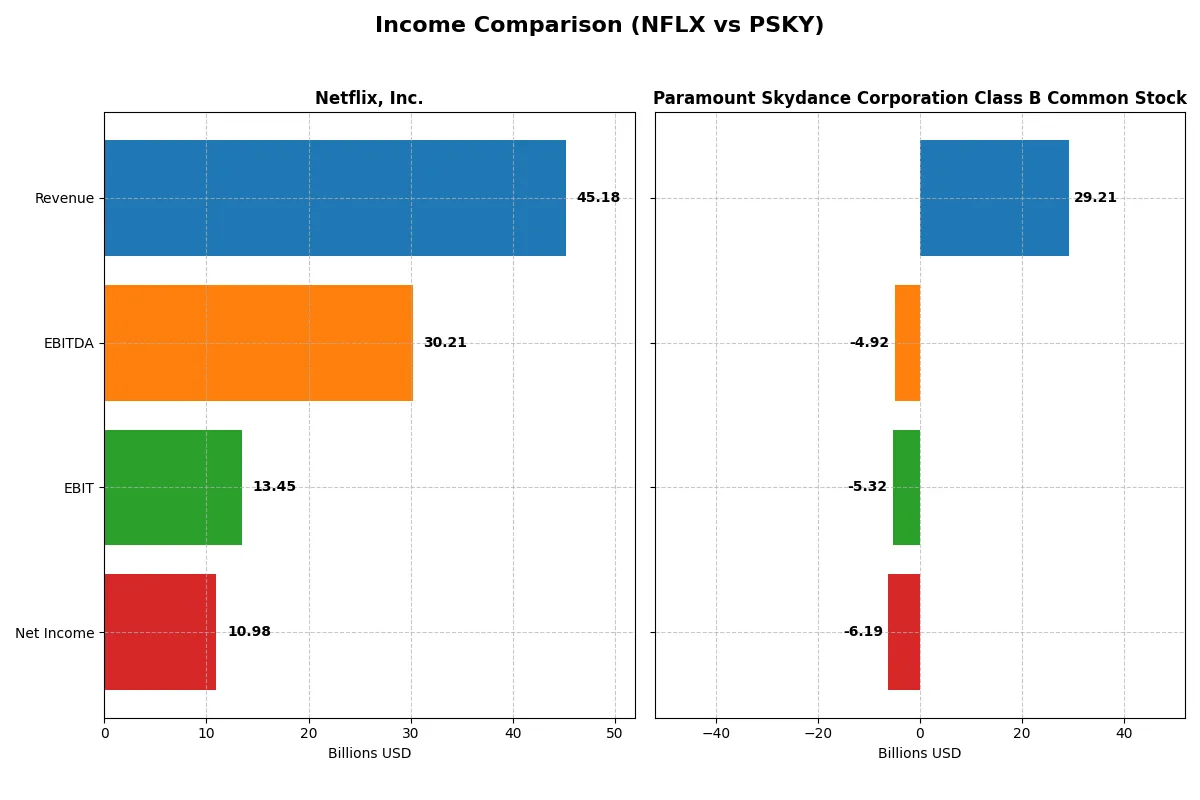
This data dissects the core profitability and scalability of both corporate engines to reveal who dominates the bottom line:
| Metric | Netflix, Inc. (NFLX) | Paramount Skydance Corporation Class B Common Stock (PSKY) |
|---|---|---|
| Revenue | 45.2B | 29.2B |
| Cost of Revenue | 23.3B | 20.9B |
| Operating Expenses | 8.6B | 6.7B |
| Gross Profit | 21.9B | 8.3B |
| EBITDA | 30.2B | -4.9B |
| EBIT | 13.5B | -5.3B |
| Interest Expense | 0.8B | 0.9B |
| Net Income | 11.0B | -6.2B |
| EPS | 2.58 | -9.34 |
| Fiscal Year | 2025 | 2024 |
Income Statement Analysis: The Bottom-Line Duel
This income statement comparison reveals which company operates its business more efficiently and generates superior profitability.
Netflix, Inc. Analysis
Netflix posted strong revenue growth, rising from $29.7B in 2021 to $45.2B in 2025, with net income more than doubling to $11B. It maintains robust gross and net margins of 48.5% and 24.3%, respectively, signaling excellent cost control. The 2025 year shows accelerating momentum with 16% revenue growth and 28% EBIT growth, reflecting operational leverage.
Paramount Skydance Corporation Class B Common Stock Analysis
Paramount Skydance’s revenue slightly declined by 1.5% to $29.2B in 2024, while net losses widened to $6.2B. Its gross margin of 28.3% remains modest, but significant operating losses result in a negative EBIT margin of -18.2%. The 2024 results underline weak profitability and deteriorating earnings momentum, despite a 13.8% gross profit growth.
Margin Strength vs. Revenue Scale
Netflix clearly outperforms Paramount Skydance across all profitability metrics, with consistent top-line growth and expanding margins. Paramount’s scale cannot offset its deep operating losses and negative net margin. For investors, Netflix’s profile offers a more compelling mix of revenue expansion and efficient profit generation.
Financial Ratios Comparison
These vital ratios act as a diagnostic tool to expose the underlying fiscal health, valuation premiums, and capital efficiency of these companies:
| Ratios | Netflix, Inc. (NFLX) | Paramount Skydance Corp. (PSKY) |
|---|---|---|
| ROE | 41.3% | -37.9% |
| ROIC | 25.2% | 4.2% |
| P/E | 36.1 | -1.1 |
| P/B | 14.9 | 0.42 |
| Current Ratio | 1.19 | 1.30 |
| Quick Ratio | 1.19 | 1.15 |
| D/E | 0.54 | 0.97 |
| Debt-to-Assets | 26.0% | 34.3% |
| Interest Coverage | 17.2 | 1.87 |
| Asset Turnover | 0.81 | 0.63 |
| Fixed Asset Turnover | 22.5 | 11.3 |
| Payout ratio | 0 | -2.7% |
| Dividend yield | 0% | 2.48% |
| Fiscal Year | 2025 | 2024 |
Efficiency & Valuation Duel: The Vital Signs
Financial ratios serve as a company’s DNA, exposing hidden risks and operational strengths crucial for informed investment decisions.
Netflix, Inc.
Netflix commands strong profitability with a 41.3% ROE and a robust 24.3% net margin, signaling operational excellence. Its valuation appears stretched, trading at a high 36.1 P/E and 14.9 P/B, reflecting growth expectations. The absence of dividends pushes capital into R&D, fueling future expansion and shareholder value.
Paramount Skydance Corporation Class B
Paramount Skydance struggles with a negative 37.9% ROE and a -21.2% net margin, indicating operational challenges. However, its valuation remains attractive, with a low 0.42 P/B and a negative P/E signaling market skepticism. It returns value via a modest 2.48% dividend yield, balancing risk with direct shareholder payouts.
Premium Valuation vs. Operational Safety
Netflix offers superior profitability but at a premium valuation, while Paramount Skydance trades cheaper yet faces significant losses. Investors prioritizing growth may lean toward Netflix, whereas income-seeking investors might find Paramount’s dividend profile more fitting despite operational risks.
Which one offers the Superior Shareholder Reward?
I see Netflix (NFLX) pays no dividends but generates strong free cash flow (2.2/share in 2025) and executes modest buybacks, supporting sustainable capital returns. Paramount Skydance (PSKY) yields 2.5%-4.5% but suffers losses and weak cash flow, relying on dividends despite negative earnings. NFLX’s reinvestment in growth and prudent buybacks outpace PSKY’s risky dividend policy. I judge Netflix offers a superior total return profile for 2026 investors.
Comparative Score Analysis: The Strategic Profile
The radar chart highlights the core strengths and strategic trade-offs shaping Netflix, Inc., and Paramount Skydance Corporation Class B Common Stock:
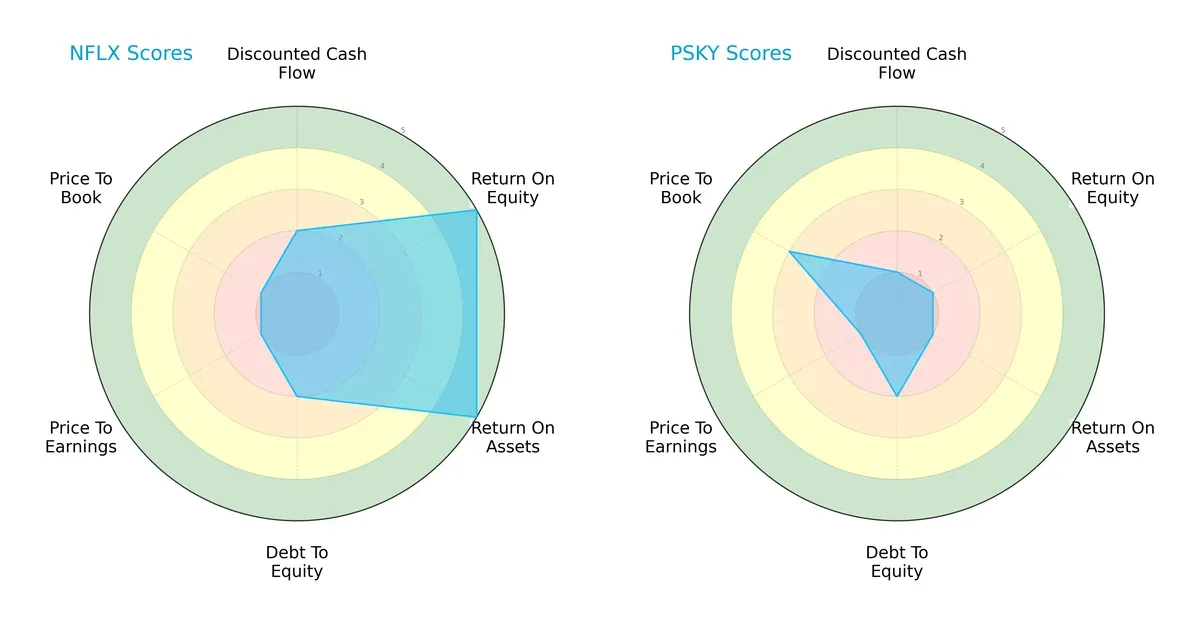
Netflix exhibits a more balanced profile with strong ROE and ROA scores (5 each), indicating efficient profit generation and asset use. Paramount Skydance lags significantly with scores of 1 in these areas, showing operational underperformance. Both share weak valuation metrics (PE and PB scores at 1), but Netflix’s moderate debt-to-equity score (2) still outperforms Paramount’s equal score (2). Netflix relies on operational efficiency, while Paramount shows no distinct edge.
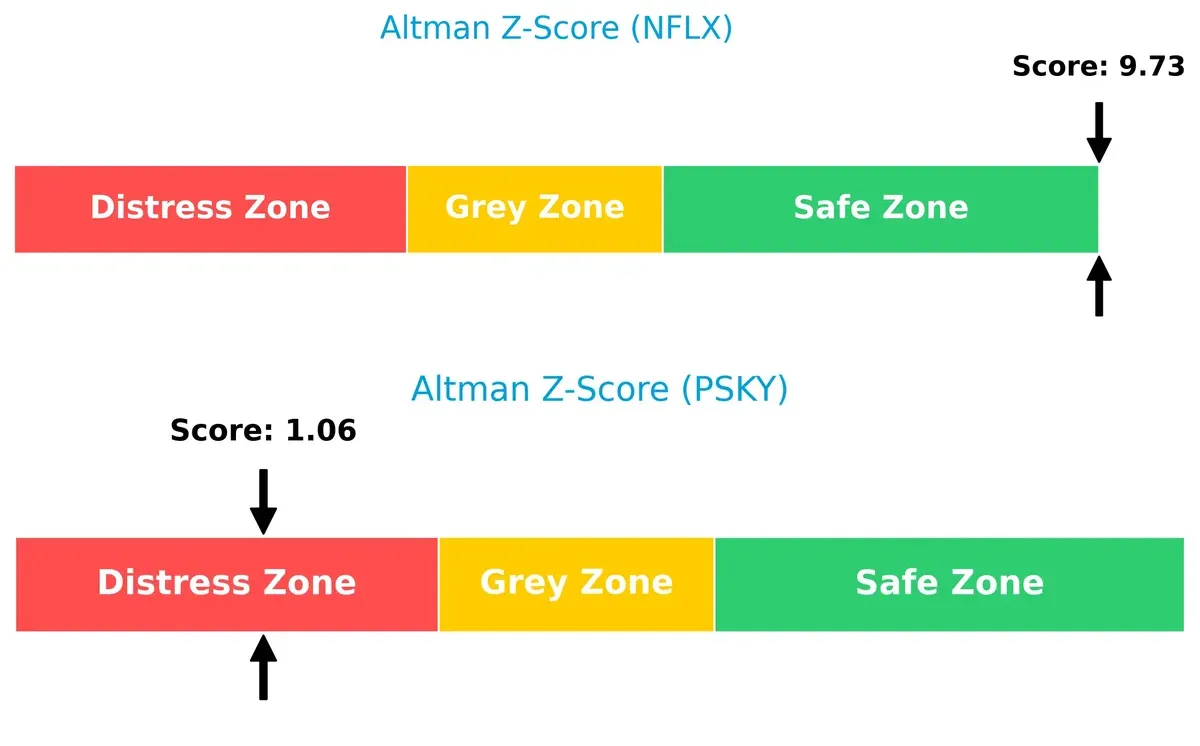
Bankruptcy Risk: Solvency Showdown
Netflix’s Altman Z-Score of 9.73 places it firmly in the safe zone, signaling robust long-term solvency. Paramount’s 1.06 score lies in the distress zone, implying elevated bankruptcy risk under current market pressures:
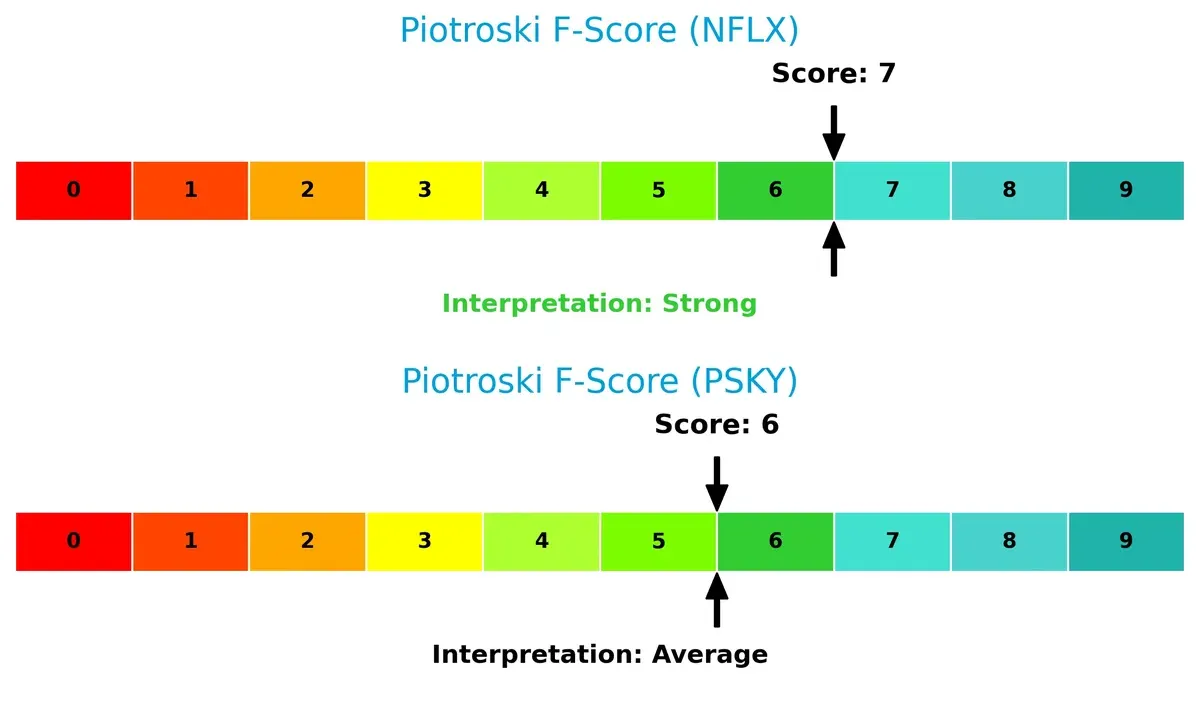
Financial Health: Quality of Operations
Netflix’s Piotroski F-Score of 7 demonstrates strong financial health, reflecting solid profitability and liquidity. Paramount’s score of 6, while decent, suggests caution as it indicates average financial strength with some internal red flags:
How are the two companies positioned?
This section dissects the operational DNA of Netflix and Paramount Skydance by comparing their revenue distribution and internal dynamics. The final objective is to confront their economic moats to determine which business model offers the most resilient competitive advantage in today’s market.
Revenue Segmentation: The Strategic Mix
This visual comparison dissects how Netflix and Paramount Skydance diversify income streams and reveals where their primary sector bets lie:
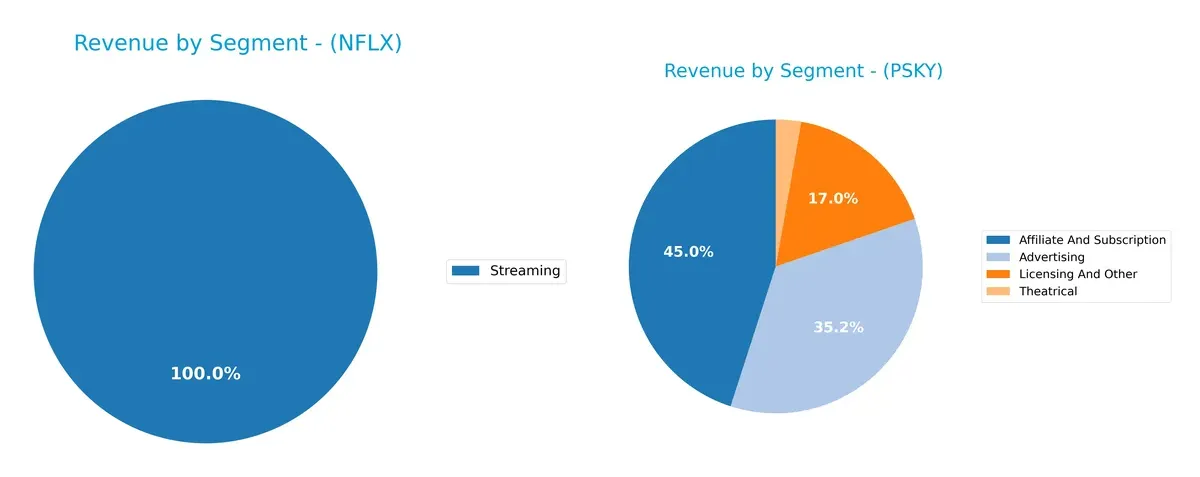
Netflix anchors its revenue almost entirely in Streaming, reaching $39B in 2024. Paramount Skydance shows a more diversified mix with $13.15B in Affiliate & Subscription, $10.3B Advertising, and $4.95B Licensing. Netflix’s heavy streaming reliance signals ecosystem lock-in but exposes concentration risk. Paramount’s multi-segment approach suggests infrastructure dominance and resilience against downturns in any single area.
Strengths and Weaknesses Comparison
This table compares the Strengths and Weaknesses of Netflix, Inc. and Paramount Skydance Corporation Class B Common Stock:
Netflix Strengths
- High profitability with net margin 24.3%
- Strong ROE at 41.26%
- Favorable ROIC at 25.22%
- Diverse global presence across US, EMEA, Latin America, Asia Pacific
- Leading market share in streaming with $39B revenue
- Strong asset efficiency with fixed asset turnover 22.54
Paramount Skydance Strengths
- Favorable WACC at 5.97% indicating low capital cost
- Positive valuation metrics with low P/E and P/B
- Diverse revenue streams including advertising, subscription, licensing, theatrical
- Solid domestic market presence with $23.7B revenue
- Favorable dividend yield at 2.48%
- Good quick ratio and fixed asset turnover 11.33
Netflix Weaknesses
- Unfavorable high P/E (36.11) and P/B (14.9) ratios
- Zero dividend yield
- WACC higher than ROIC indicating capital inefficiency
- Moderate current ratio at 1.19
- Limited product diversification focused mainly on streaming
Paramount Skydance Weaknesses
- Negative profitability with net margin -21.19% and ROE -37.93%
- Low ROIC at 4.16% below WACC
- Negative interest coverage ratio (-6.18) signals financial stress
- Smaller global footprint concentrated in the US
- Lower asset turnover at 0.63
Netflix’s strengths lie in its robust profitability and expansive international reach, while Paramount Skydance benefits from diverse revenue streams and lower capital costs. However, Netflix faces valuation and capital efficiency risks, whereas Paramount’s financial losses and concentrated market presence pose strategic challenges.
The Moat Duel: Analyzing Competitive Defensibility
A structural moat is the only reliable barrier protecting long-term profits from relentless competitive erosion. Let’s dissect the defenses of two entertainment giants:
Netflix, Inc.: Streaming Pioneer with a Scalable Content Moat
Netflix’s moat centers on intangible assets—its vast content library and global brand loyalty. This manifests in a high ROIC over WACC by 13.6%, showing strong value creation. Its 222M paid members fuel margin stability and revenue growth, with new gaming and international expansions deepening the moat in 2026.
Paramount Skydance Corporation Class B Common Stock: Diversified Media Conglomerate with Brand Portfolio
Paramount’s moat derives from a broad brand portfolio and multi-segment presence, contrasting Netflix’s digital-first model. Despite a slightly unfavorable ROIC versus WACC, its improving profitability hints at operational leverage. Opportunities in streaming and theatrical content could disrupt markets, but legacy media segments weigh on margins.
Streaming Scale vs. Brand Breadth: Who Holds the Moat Edge?
Netflix’s wider and deeper moat outpaces Paramount’s fragmented positioning, driven by superior capital efficiency and global subscriber scale. Netflix is better equipped to defend and grow its market share amid intensifying competition in 2026.
Which stock offers better returns?
The past year shows starkly different price dynamics for Netflix and Paramount Skydance, with Netflix gaining significant ground while Paramount Skydance declines steadily.
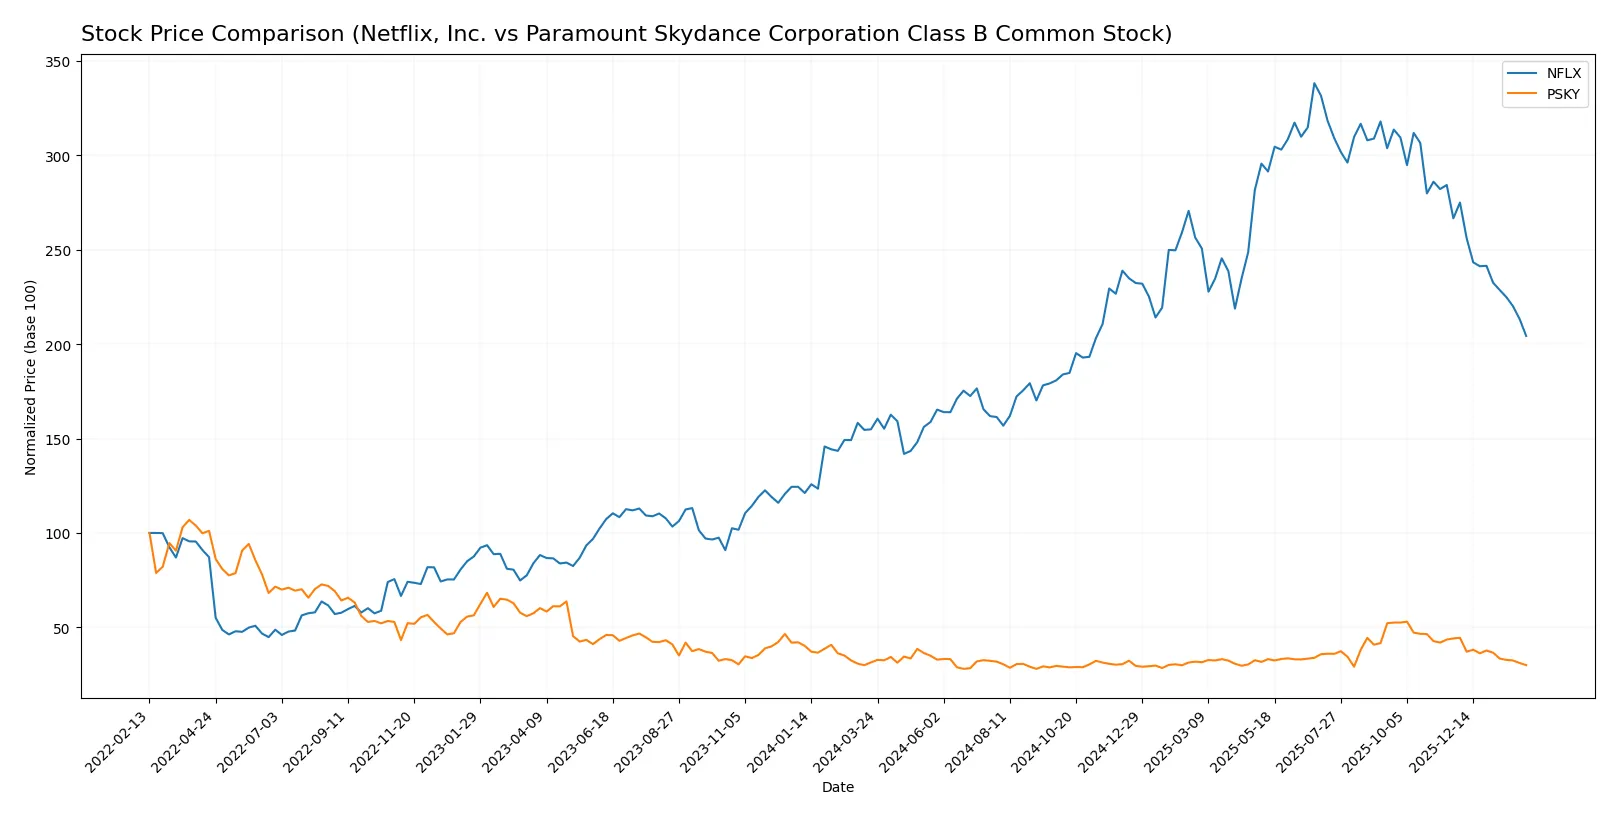
Trend Comparison
Netflix’s stock rose 31.94% over the past year, signaling a bullish trend despite recent deceleration and a 23.36% drop in the last quarter. Volatility remains high with a 22.19 std deviation.
Paramount Skydance’s stock fell 4.51% over the year, confirming a bearish trend with decelerating decline. Recent quarterly losses accelerated to 31.97%, and volatility stays low at 2.1 std deviation.
Netflix outperformed Paramount Skydance markedly, delivering stronger market gains despite short-term weakness, while Paramount Skydance showed consistent negative returns.
Target Prices
Analysts present a moderate upside potential for these entertainment giants based on current consensus targets.
| Company | Target Low | Target High | Consensus |
|---|---|---|---|
| Netflix, Inc. | 95 | 152 | 117.25 |
| Paramount Skydance Corporation Class B Common Stock | 12 | 16 | 13.5 |
Netflix’s consensus target of 117.25 suggests a roughly 47% upside from its 79.94 price, reflecting growth optimism. Paramount Skydance’s consensus at 13.5 implies about 25% upside versus its 10.81 price, signaling moderate confidence.

Don’t Let Luck Decide Your Entry Point
Optimize your entry points with our advanced ProRealTime indicators. You’ll get efficient buy signals with precise price targets for maximum performance. Start outperforming now!
How do institutions grade them?
The following tables summarize recent institutional grades for Netflix, Inc. and Paramount Skydance Corporation Class B Common Stock:
Netflix, Inc. Grades
Here are the latest grades assigned by reputable grading firms for Netflix:
| Grading Company | Action | New Grade | Date |
|---|---|---|---|
| Freedom Capital Markets | Upgrade | Buy | 2026-01-27 |
| Argus Research | Maintain | Buy | 2026-01-22 |
| Wedbush | Maintain | Outperform | 2026-01-21 |
| Deutsche Bank | Maintain | Hold | 2026-01-21 |
| Guggenheim | Maintain | Buy | 2026-01-21 |
| Wolfe Research | Maintain | Outperform | 2026-01-21 |
| Morgan Stanley | Maintain | Overweight | 2026-01-21 |
| Canaccord Genuity | Maintain | Buy | 2026-01-21 |
| Piper Sandler | Maintain | Overweight | 2026-01-21 |
| TD Cowen | Maintain | Buy | 2026-01-21 |
Paramount Skydance Corporation Class B Common Stock Grades
Here are the latest grades assigned by reputable grading firms for Paramount Skydance Corporation Class B Common Stock:
| Grading Company | Action | New Grade | Date |
|---|---|---|---|
| Morgan Stanley | Maintain | Underweight | 2025-12-09 |
| Guggenheim | Maintain | Neutral | 2025-11-12 |
| Bernstein | Maintain | Underperform | 2025-11-12 |
| Benchmark | Maintain | Buy | 2025-11-11 |
| Wells Fargo | Maintain | Equal Weight | 2025-11-11 |
| B of A Securities | Maintain | Underperform | 2025-11-11 |
| Evercore ISI Group | Maintain | In Line | 2025-11-11 |
| JP Morgan | Maintain | Underweight | 2025-11-04 |
| Wells Fargo | Maintain | Equal Weight | 2025-10-23 |
| UBS | Maintain | Sell | 2025-10-08 |
Which company has the best grades?
Netflix consistently earns Buy, Outperform, and Overweight grades from major firms, signaling broad institutional confidence. Paramount Skydance shows mixed to negative ratings, including Underweight and Sell grades. Investors may view Netflix’s stronger grades as a sign of better market sentiment and potential stability.
Risks specific to each company
The following categories identify the critical pressure points and systemic threats facing both firms in the 2026 market environment:
1. Market & Competition
Netflix, Inc.
- Faces intense competition from global streaming platforms and content providers, pressuring subscriber growth and pricing power.
Paramount Skydance Corporation Class B Common Stock
- Competes in diverse media segments but struggles with profitability and market share compared to larger peers.
2. Capital Structure & Debt
Netflix, Inc.
- Maintains moderate leverage (D/E 0.54) with strong interest coverage (17.33x), signaling manageable debt risks.
Paramount Skydance Corporation Class B Common Stock
- Higher leverage (D/E 0.97) and negative interest coverage (-6.18x) raise concerns about financial flexibility and solvency.
3. Stock Volatility
Netflix, Inc.
- Exhibits higher beta (1.71), indicating greater sensitivity to market swings typical for entertainment growth stocks.
Paramount Skydance Corporation Class B Common Stock
- Lower beta (1.21) reflects less volatility but still exposed to sector cyclicality and market sentiment shifts.
4. Regulatory & Legal
Netflix, Inc.
- Navigates content regulation and data privacy laws globally, with risks from potential stricter streaming regulations.
Paramount Skydance Corporation Class B Common Stock
- Faces multifaceted regulatory challenges across broadcasting, streaming, and content production sectors worldwide.
5. Supply Chain & Operations
Netflix, Inc.
- Relies heavily on digital infrastructure and licensing agreements; operational disruptions could impact content delivery.
Paramount Skydance Corporation Class B Common Stock
- Complex operations spanning studios, networks, and streaming platforms increase vulnerability to production delays and cost overruns.
6. ESG & Climate Transition
Netflix, Inc.
- Advances in sustainability initiatives but faces scrutiny on carbon footprint from global digital streaming.
Paramount Skydance Corporation Class B Common Stock
- Engaged in ESG efforts but must manage environmental impact across studios and broadcast operations amid rising investor expectations.
7. Geopolitical Exposure
Netflix, Inc.
- Global footprint subjects it to geopolitical risks including content censorship and foreign market restrictions.
Paramount Skydance Corporation Class B Common Stock
- Extensive international presence exposes it to geopolitical tensions affecting content distribution and advertising revenues.
Which company shows a better risk-adjusted profile?
Netflix’s strongest risk factor is intense market competition, but its solid capital structure and profitability provide resilience. Paramount’s critical risk lies in its precarious financial health, especially negative interest coverage and distress-level Altman Z-score, increasing bankruptcy risk. Netflix demonstrates a superior risk-adjusted profile, supported by a safe-zone Altman Z-score (9.73) and strong profitability metrics. Paramount’s distress-zone Z-score (1.06) and negative margins demand caution, reflecting its financial fragility amidst operational complexity.
Final Verdict: Which stock to choose?
Netflix, Inc. wields a formidable superpower in its durable competitive advantage, demonstrated by a high and growing ROIC well above its cost of capital. It consistently generates strong returns and free cash flow, positioning it as a cash machine. The main point of vigilance is its elevated valuation multiples, which could temper upside in volatile markets. Netflix suits investors with an appetite for aggressive growth anchored in quality and scale.
Paramount Skydance Corporation’s strategic moat lies in its deep asset base and potential for operational improvement, reflected by a modest but improving ROIC. Compared to Netflix, it offers a more attractive valuation and some dividend yield, suggesting a safer entry point for value-oriented investors. However, its current profitability challenges and distress-level financial scores warrant caution. Paramount Skydance fits portfolios focused on turnaround potential and GARP (growth at a reasonable price).
If you prioritize durable competitive advantages and strong profitability, Netflix outshines with superior capital efficiency and cash generation, albeit at a premium. However, if you seek value opportunities with potential upside from operational recovery, Paramount Skydance offers better stability in valuation and dividend income, though with higher execution risk. Each stock appeals to distinct investor profiles based on risk tolerance and investment horizon.
Disclaimer: Investment carries a risk of loss of initial capital. The past performance is not a reliable indicator of future results. Be sure to understand risks before making an investment decision.
Go Further
I encourage you to read the complete analyses of Netflix, Inc. and Paramount Skydance Corporation Class B Common Stock to enhance your investment decisions: