Home > Comparison > Communication Services > NFLX vs CMCSA
The strategic rivalry between Netflix, Inc. and Comcast Corporation shapes the Communication Services sector’s future. Netflix leads as a global streaming entertainment provider, focusing on digital subscription growth. Comcast operates a diversified media and telecommunications network, blending cable services, content studios, and theme parks. This analysis contrasts their operational models and growth strategies to reveal which company offers the superior risk-adjusted return for a diversified portfolio in today’s evolving media landscape.
Table of contents
Companies Overview
Netflix and Comcast dominate distinct niches within the vast communication services sector.
Netflix, Inc.: Global Streaming Pioneer
Netflix stands as a leading entertainment streaming service boasting 222M paid members worldwide. Its core revenue stems from subscription fees for TV series, films, and mobile games delivered over internet-connected devices. In 2026, Netflix sharpens its focus on expanding original content and enhancing user engagement to sustain growth amid intensifying competition.
Comcast Corporation: Diversified Media & Telecom Giant
Comcast operates as a media and technology powerhouse with multifaceted revenue streams including broadband, video, voice services, and theme parks. Its key brands include Xfinity and NBCUniversal. In 2026, Comcast prioritizes integrating its cable and streaming platforms while expanding its direct-to-consumer offerings like Peacock to capture evolving consumer preferences.
Strategic Collision: Similarities & Divergences
Netflix and Comcast diverge fundamentally in business philosophy; Netflix embraces a pure digital streaming model, while Comcast integrates traditional cable and broad entertainment assets. Their primary battleground is the streaming content and subscriber market, where both vie for consumer attention and loyalty. Investors face contrasting profiles: Netflix bets on content innovation and global scale, Comcast on diversified cash flows and infrastructure strength.
Income Statement Comparison
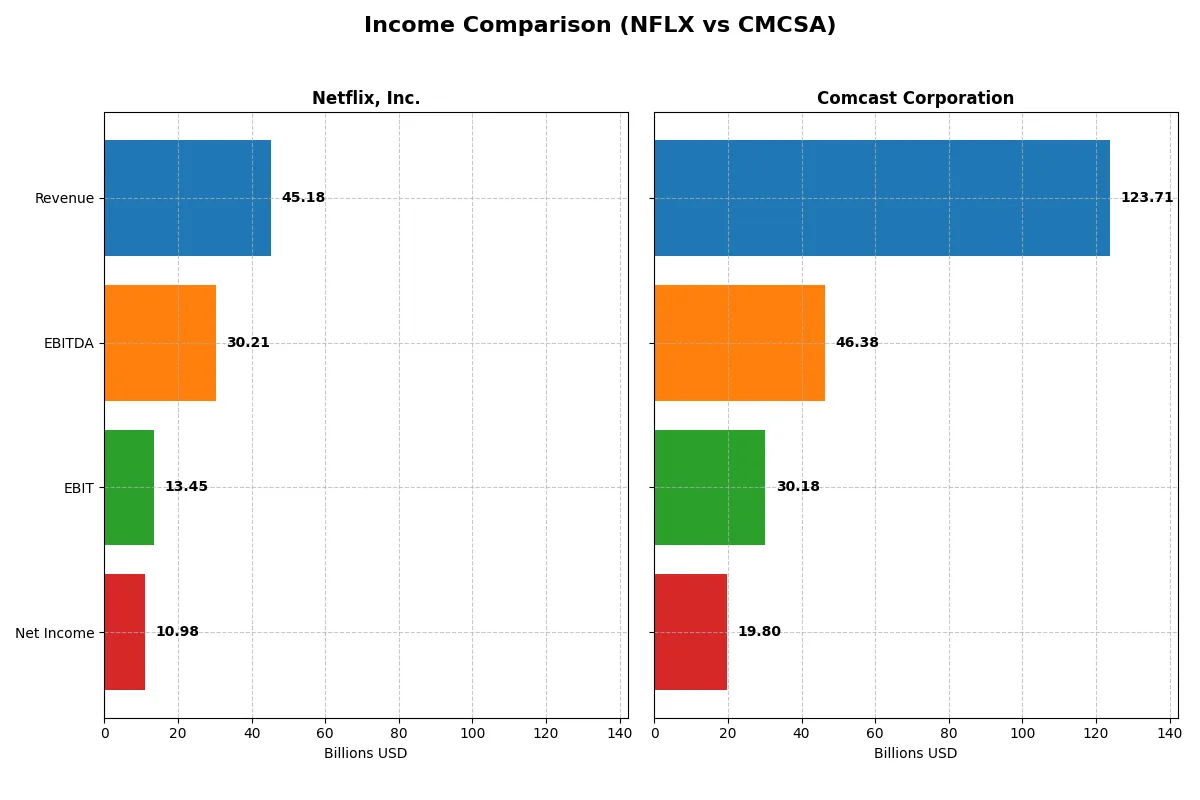
This data dissects the core profitability and scalability of both corporate engines to reveal who dominates the bottom line:
| Metric | Netflix, Inc. (NFLX) | Comcast Corporation (CMCSA) |
|---|---|---|
| Revenue | 45.2B | 123.7B |
| Cost of Revenue | 23.3B | 49.4B |
| Operating Expenses | 8.6B | 53.6B |
| Gross Profit | 21.9B | 74.3B |
| EBITDA | 30.2B | 46.4B |
| EBIT | 13.5B | 30.2B |
| Interest Expense | 0.8B | 4.4B |
| Net Income | 11.0B | 20.0B |
| EPS | 2.58 | 5.41 |
| Fiscal Year | 2025 | 2025 |
Income Statement Analysis: The Bottom-Line Duel
The income statement comparison reveals the true efficiency and profitability engines driving Netflix and Comcast’s business models in 2025.
Netflix, Inc. Analysis
Netflix’s revenue surged 15.9% in 2025 to $45.2B, with net income jumping 26% to $11B. Gross margin stands healthy at 48.5%, and net margin improved to 24.3%. Operating expenses grew proportionally, preserving margin strength. This momentum reflects efficient cost control and scaling profitability in a competitive streaming market.
Comcast Corporation Analysis
Comcast’s 2025 revenue slightly dipped by 0.02% to $123.7B, yet net income soared 22% to $20B. Its gross margin leads at 60.1%, though net margin trails Netflix at 16%. EBIT margin improved to 24.4%, fueled by disciplined expense management despite flat top-line growth. Comcast balances scale with solid profitability gains amid market pressures.
Margin Excellence vs. Revenue Scale
Netflix excels in margin expansion and rapid earnings growth, doubling net income over five years. Comcast’s scale delivers larger absolute profits but with lower net margins and stagnant revenue. For investors, Netflix’s profile suits those prioritizing margin efficiency and growth momentum, while Comcast appeals to those valuing stable scale and steady profit gains.
Financial Ratios Comparison
These vital ratios act as a diagnostic tool to expose the underlying fiscal health, valuation premiums, and capital efficiency of the companies compared:
| Ratios | Netflix, Inc. (NFLX) | Comcast Corporation (CMCSA) |
|---|---|---|
| ROE | 41.3% | 20.4% |
| ROIC | 25.2% | 9.9% |
| P/E | 36.1 | 5.1 |
| P/B | 14.9 | 1.1 |
| Current Ratio | 1.19 | 0.88 |
| Quick Ratio | 1.19 | 0.88 |
| D/E (Debt-to-Equity) | 0.54 | 0.06 |
| Debt-to-Assets | 26.0% | 3.2% |
| Interest Coverage | 17.2 | 4.7 |
| Asset Turnover | 0.81 | 0.66 |
| Fixed Asset Turnover | 22.5 | 1.88 |
| Payout Ratio | 0 | 24.7% |
| Dividend Yield | 0% | 4.8% |
| Fiscal Year | 2025 | 2025 |
Efficiency & Valuation Duel: The Vital Signs
Financial ratios act as a company’s DNA, exposing hidden risks and operational strengths that define investment potential.
Netflix, Inc.
Netflix boasts a stellar 41.3% ROE and a robust 24.3% net margin, signaling exceptional profitability. However, its P/E of 36.1 and P/B of 14.9 suggest an expensive, stretched valuation. The absence of dividends leans on aggressive reinvestment in R&D and growth, fueling its competitive edge despite moderate liquidity.
Comcast Corporation
Comcast delivers solid profitability with a 20.4% ROE and 16.0% net margin, paired with a low P/E of 5.1 and P/B near 1.0, marking it as undervalued and efficient. It balances shareholder returns with a 4.8% dividend yield and manageable debt levels, though its current ratio below 1 signals potential short-term liquidity risks.
Premium Valuation vs. Operational Safety
Netflix commands premium multiples justified by superior returns, but valuation remains stretched. Comcast offers a safer risk profile with undervalued shares and steady dividends. Investors seeking growth may favor Netflix’s reinvestment strategy, while income-focused investors may find Comcast’s balance of yield and value more fitting.
Which one offers the Superior Shareholder Reward?
Netflix (NFLX) pays no dividends but aggressively reinvests in content and technology, fueling strong free cash flow growth (2.24/share in 2025) with no payout strain. Comcast (CMCSA) provides a 4.8% dividend yield, supported by a moderate 25% payout ratio and steady buybacks, delivering 6.02/share free cash flow in 2025. Comcast’s mature cash return model suits income-focused investors, while Netflix’s reinvestment strategy fosters capital appreciation. I see Comcast offering a superior total return profile in 2026 due to its sustainable dividend plus buyback combination, balancing yield and growth prudently.
Comparative Score Analysis: The Strategic Profile
The radar chart reveals the fundamental DNA and trade-offs of Netflix, Inc. and Comcast Corporation, highlighting their financial strengths and vulnerabilities:
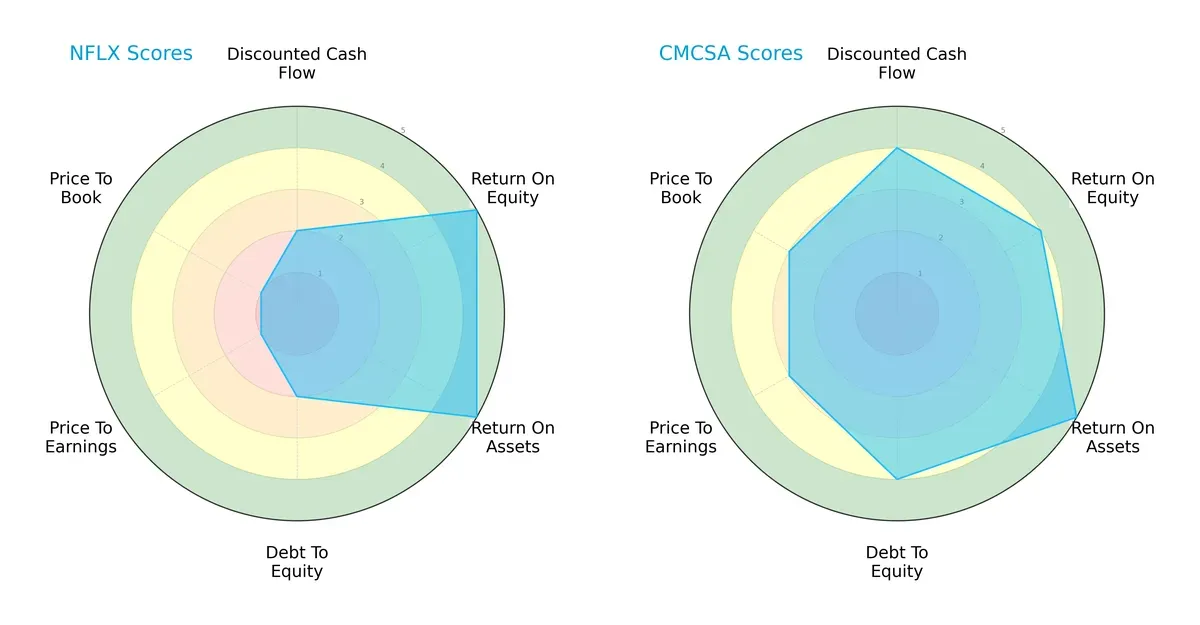
Netflix shows strong operational efficiency with top ROE and ROA scores (5 each), but it suffers from weak valuation and leverage metrics, scoring only 1 in P/E, P/B, and 2 in Debt/Equity. Comcast presents a more balanced profile, scoring favorably across DCF (4), ROE (4), Debt/Equity (4), and moderate valuation scores (3). Comcast’s stronger balance sheet and more reasonable valuation suggest less financial risk, while Netflix relies heavily on operational excellence despite valuation pressures.
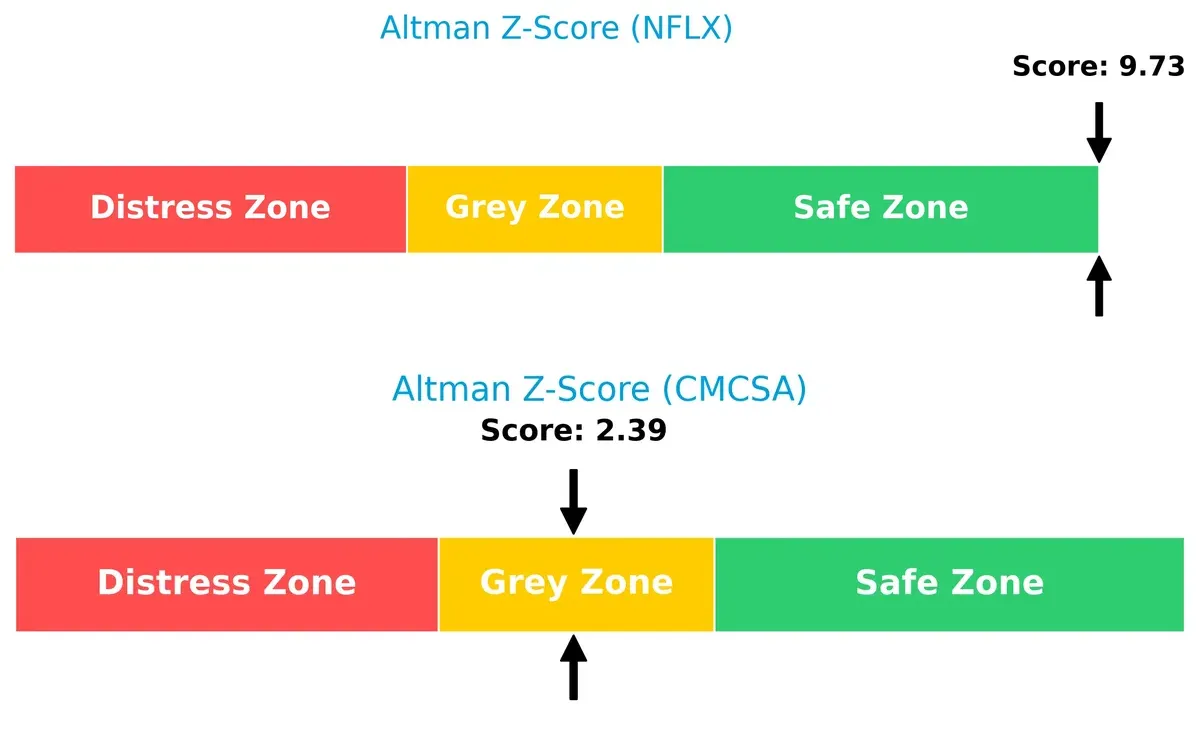
Bankruptcy Risk: Solvency Showdown
Netflix’s Altman Z-Score of 9.73 places it firmly in the safe zone, indicating a very low bankruptcy risk. Comcast’s score of 2.39 falls in the grey zone, signaling moderate risk and caution for long-term survival in this cycle:
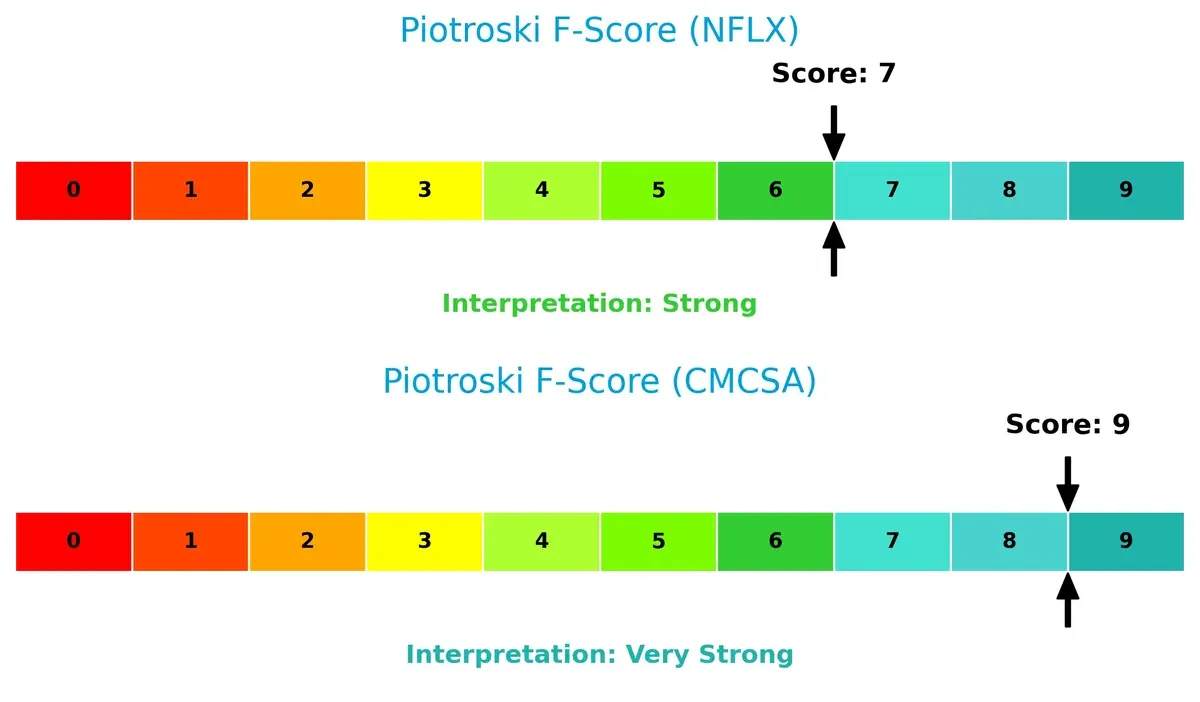
Financial Health: Quality of Operations
Comcast leads with a Piotroski F-Score of 9, reflecting very strong financial health and robust internal metrics. Netflix’s score of 7 is strong but suggests some red flags in operational efficiency or liquidity compared to Comcast:
How are the two companies positioned?
This section dissects Netflix and Comcast’s operational DNA by comparing their revenue distribution and internal dynamics. The goal is to confront their economic moats and identify which model offers the most resilient, sustainable competitive advantage.
Revenue Segmentation: The Strategic Mix
This visual comparison dissects how Netflix, Inc. and Comcast Corporation diversify their income streams and where their primary sector bets lie:
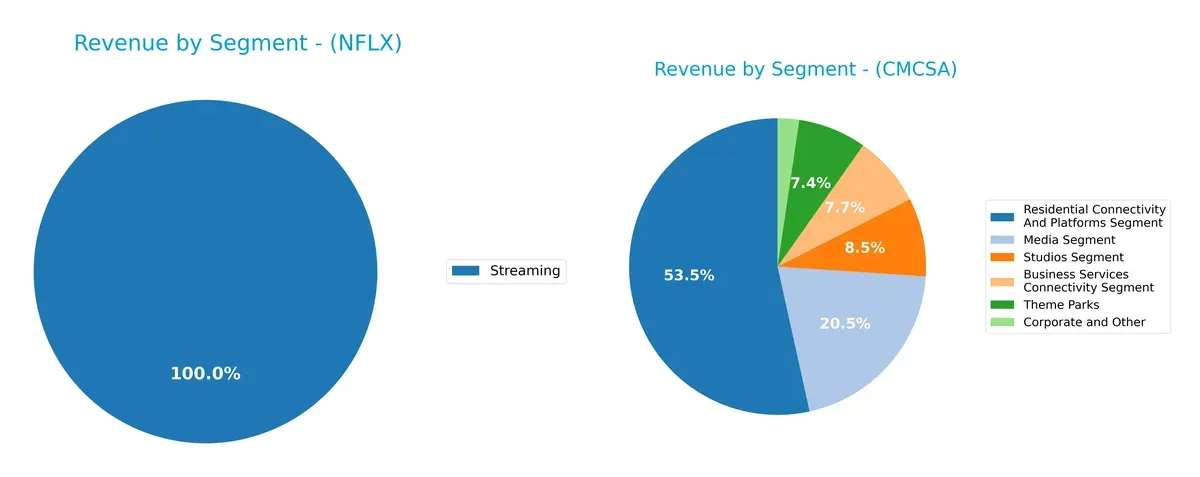
Netflix anchors nearly all revenue in streaming, with $39B in 2024 dominating its portfolio. Comcast, however, boasts a diverse mix: $71B from Residential Connectivity, $27B Media, $11B Studios, and $9.8B Theme Parks. Comcast’s broad exposure reduces concentration risk and leverages infrastructure dominance, while Netflix’s streaming focus drives ecosystem lock-in but faces vulnerability if trends shift.
Strengths and Weaknesses Comparison
This table compares the Strengths and Weaknesses of Netflix and Comcast:
Netflix Strengths
- High profitability with 24.3% net margin and 41.26% ROE
- Strong ROIC at 25.22% well above WACC
- Favorable quick ratio and low debt-to-assets ratio
- Growing global streaming revenues including US and EMEA markets
Comcast Strengths
- Diversified revenue across connectivity, media, studios, theme parks
- Favorable WACC and low debt-to-equity ratio
- Strong dividend yield at 4.81%
- Robust US geographic presence with $95B revenue
- Market valuation metrics (PE, PB) favorable
Netflix Weaknesses
- High valuation multiples with PE 36.11 and PB 14.9
- WACC of 11.56% exceeds ROIC, indicating capital cost concerns
- No dividend yield
- Current ratio only neutral at 1.19
- Limited product diversification, mainly streaming revenue
Comcast Weaknesses
- Current ratio below 1 at 0.88, indicating liquidity risk
- Moderate ROIC of 9.88% only neutral versus WACC
- Lower profitability with 16.01% net margin and 20.44% ROE
- Less asset turnover efficiency at 0.66
Overall, Netflix excels in profitability and innovation within streaming but faces valuation and capital cost challenges. Comcast benefits from broad diversification and financial stability but contends with liquidity constraints and moderate returns. Both companies’ strengths and weaknesses shape their strategic priorities in the evolving media landscape.
The Moat Duel: Analyzing Competitive Defensibility
A structural moat shields long-term profits from relentless competition and market shifts. Without it, margins erode and growth stalls:
Netflix, Inc.: Content Ecosystem and Scale Moat
Netflix’s primary moat stems from its vast content library and global subscriber base, creating strong switching costs. This drives high ROIC at 13.7%, with stable margins near 30%. Expanding original content and gaming in 2026 could deepen this moat.
Comcast Corporation: Diversified Infrastructure and Brand Moat
Comcast relies on its extensive cable infrastructure and multi-segment media presence, contrasting Netflix’s pure streaming focus. With a ROIC advantage over WACC of 4.6%, Comcast delivers steady profitability and leverages theme parks and NBCUniversal for growth opportunities in 2026.
Streaming Scale vs. Infrastructure Depth: Netflix vs. Comcast
Netflix’s wider moat arises from superior capital efficiency and global digital scale. Comcast’s moat is deep but more capital-intensive and less agile. Netflix is better positioned to defend market share through innovation and subscriber loyalty.
Which stock offers better returns?
Over the past 12 months, Netflix surged 35.7% but with decelerating momentum, while Comcast fell 26.7% despite recent accelerating gains and notable price recovery.
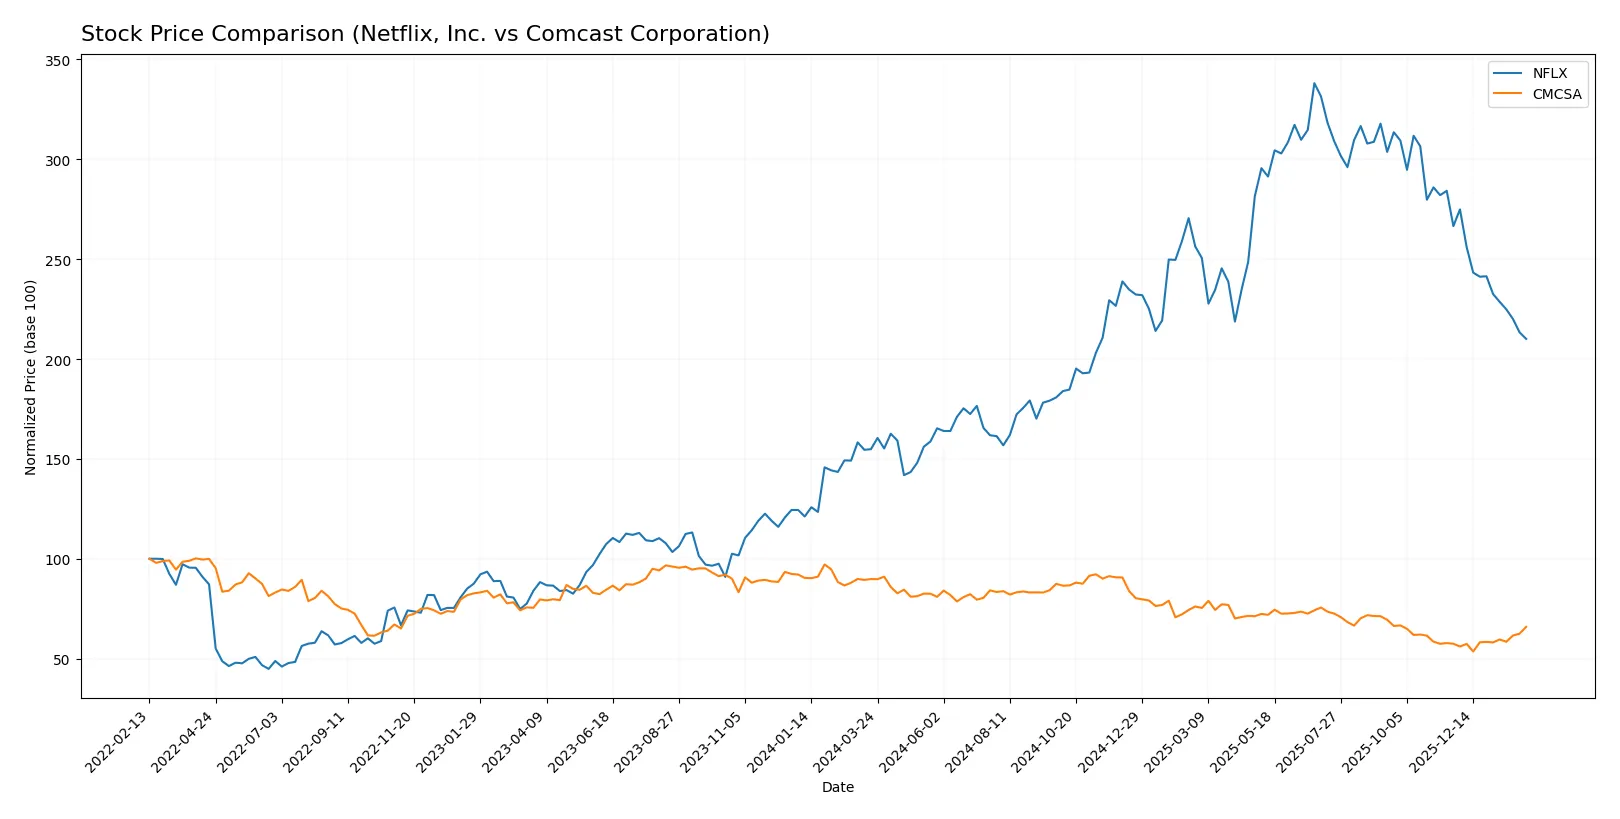
Trend Comparison
Netflix’s stock rose 35.7% over the past year, marking a bullish trend with high volatility and decelerating price gains from a 132.31 high to a 55.5 low.
Comcast’s stock declined 26.7%, indicating a bearish trend with low volatility but accelerating downward momentum; recent months show a 14.7% recovery.
Netflix outperformed Comcast overall, delivering the highest market return despite recent short-term weakness in its share price.
Target Prices
Analysts present a broad consensus on target prices for Netflix, Inc. and Comcast Corporation, reflecting varied growth expectations.
| Company | Target Low | Target High | Consensus |
|---|---|---|---|
| Netflix, Inc. | 95 | 152 | 117.25 |
| Comcast Corporation | 23 | 40 | 32.71 |
Netflix’s target consensus at 117.25 implies a significant upside from the current 82.2 price, indicating optimism on growth. Comcast’s consensus near 32.71 closely aligns with its current 31.37 price, suggesting moderate growth expectations.

Don’t Let Luck Decide Your Entry Point
Optimize your entry points with our advanced ProRealTime indicators. You’ll get efficient buy signals with precise price targets for maximum performance. Start outperforming now!
How do institutions grade them?
Netflix, Inc. Grades
The table below shows recent grades for Netflix from various reputable firms.
| Grading Company | Action | New Grade | Date |
|---|---|---|---|
| Freedom Capital Markets | Upgrade | Buy | 2026-01-27 |
| Argus Research | Maintain | Buy | 2026-01-22 |
| Guggenheim | Maintain | Buy | 2026-01-21 |
| Wolfe Research | Maintain | Outperform | 2026-01-21 |
| Deutsche Bank | Maintain | Hold | 2026-01-21 |
| BMO Capital | Maintain | Outperform | 2026-01-21 |
| Rosenblatt | Maintain | Neutral | 2026-01-21 |
| Oppenheimer | Maintain | Outperform | 2026-01-21 |
| Keybanc | Maintain | Overweight | 2026-01-21 |
| Needham | Maintain | Buy | 2026-01-21 |
Comcast Corporation Grades
Below is a summary of Comcast’s recent grades from established grading institutions.
| Grading Company | Action | New Grade | Date |
|---|---|---|---|
| Rosenblatt | Maintain | Neutral | 2026-01-30 |
| TD Cowen | Maintain | Buy | 2026-01-30 |
| Citigroup | Maintain | Buy | 2026-01-30 |
| Scotiabank | Maintain | Sector Perform | 2026-01-30 |
| Bernstein | Maintain | Market Perform | 2026-01-16 |
| Barclays | Maintain | Equal Weight | 2026-01-13 |
| B of A Securities | Upgrade | Buy | 2026-01-12 |
| Benchmark | Maintain | Buy | 2026-01-06 |
| Morgan Stanley | Maintain | Equal Weight | 2025-12-10 |
| Rosenblatt | Maintain | Neutral | 2025-12-01 |
Which company has the best grades?
Netflix has a stronger consensus, with multiple “Buy” and “Outperform” ratings. Comcast shows more mixed grades centered on “Buy” and “Neutral.” Investors might see Netflix’s grades as signaling higher growth expectations.
Risks specific to each company
The following categories identify critical pressure points and systemic threats facing Netflix, Inc. and Comcast Corporation in the 2026 market environment:
1. Market & Competition
Netflix, Inc.
- Faces intense streaming competition with high content costs and subscriber churn risks.
Comcast Corporation
- Diversified media and telecom operations reduce dependency on any single segment, but face cord-cutting trends.
2. Capital Structure & Debt
Netflix, Inc.
- Moderate leverage with debt/equity of 0.54; interest coverage strong at 17.3x.
Comcast Corporation
- Very low leverage (debt/equity 0.06); interest coverage solid at 6.8x, signaling conservative balance sheet.
3. Stock Volatility
Netflix, Inc.
- High beta at 1.71 indicates significant price swings and market sensitivity.
Comcast Corporation
- Lower beta at 0.79 implies more stable stock price behavior amid market fluctuations.
4. Regulatory & Legal
Netflix, Inc.
- Subject to content regulation and data privacy scrutiny globally, adding cost and compliance risk.
Comcast Corporation
- Faces broad regulatory oversight across telecom, media, and theme parks, increasing legal exposure.
5. Supply Chain & Operations
Netflix, Inc.
- Relies on internet infrastructure and content delivery networks; vulnerable to tech disruptions.
Comcast Corporation
- Complex supply chain for hardware, media production, and theme parks; operational complexity risk.
6. ESG & Climate Transition
Netflix, Inc.
- Increasing pressure to reduce carbon footprint of data centers and streaming operations.
Comcast Corporation
- Greater exposure due to theme parks and infrastructure; faces higher transition risks.
7. Geopolitical Exposure
Netflix, Inc.
- Global streaming footprint exposes it to geopolitical tensions and censorship in key markets.
Comcast Corporation
- International operations including Sky and theme parks face regulatory and political risks abroad.
Which company shows a better risk-adjusted profile?
Netflix’s most impactful risk is intense market competition and high stock volatility, challenging its pricing power and growth. Comcast’s primary risk lies in operational complexity and regulatory breadth due to its diversified segments. Comcast’s lower leverage and stable stock price provide a better risk-adjusted profile. Netflix’s high beta (1.71) versus Comcast’s stable beta (0.79) justifies my concern over Netflix’s volatility in turbulent markets.
Final Verdict: Which stock to choose?
Netflix’s superpower lies in its exceptional capital efficiency and rapidly growing profitability, driven by a powerful content ecosystem and global subscriber base. Its high valuation multiples warn of stretched expectations—a point of vigilance. It suits investors seeking aggressive growth with tolerance for premium pricing and market swings.
Comcast’s strategic moat is its diversified media and broadband infrastructure, generating steady recurring cash flows and attractive free cash flow yields. It offers a more conservative risk profile than Netflix, supported by a favorable valuation and robust balance sheet. It fits well in GARP portfolios balancing income and moderate growth.
If you prioritize high-growth potential and are comfortable with valuation risks, Netflix outshines with superior ROIC and earnings momentum. However, if you seek better stability and income with a margin of safety, Comcast offers a compelling mix of cash flow strength and valuation discipline. Both demonstrate sustainable moats but cater to distinct investor avatars.
Disclaimer: Investment carries a risk of loss of initial capital. The past performance is not a reliable indicator of future results. Be sure to understand risks before making an investment decision.
Go Further
I encourage you to read the complete analyses of Netflix, Inc. and Comcast Corporation to enhance your investment decisions: