Home > Comparison > Communication Services > NFLX vs CHTR
The strategic rivalry between Netflix, Inc. and Charter Communications, Inc. shapes the communication services sector’s evolution. Netflix operates as a content-driven entertainment powerhouse, while Charter focuses on broadband connectivity and cable operations. This analysis contrasts their growth dynamics and capital intensity. I will determine which company’s strategy offers superior risk-adjusted returns for a diversified portfolio amid ongoing industry disruption and evolving consumer demands.
Table of contents
Companies Overview
Netflix and Charter Communications each shape the U.S. entertainment and broadband landscapes significantly.
Netflix, Inc.: Streaming Pioneer and Content Powerhouse
Netflix dominates the entertainment sector with its streaming service, delivering TV series, films, and mobile games to 222M paid members worldwide. Its core revenue engine relies on subscription fees from a vast global audience. In 2026, Netflix focuses on expanding content variety and enhancing its personalized streaming experience to maintain market leadership.
Charter Communications, Inc.: Broadband and Cable Giant
Charter Communications leads in broadband connectivity and cable services across 41 U.S. states, serving roughly 32M customers. It generates revenue through subscription-based video, internet, and voice services, supplemented by advertising sales. The company’s 2026 strategy centers on upgrading network infrastructure and expanding its managed services to boost customer retention and attract business clients.
Strategic Collision: Similarities & Divergences
Both companies compete fiercely in delivering digital content and connectivity, yet Netflix embraces a global streaming model while Charter operates a U.S.-centric broadband ecosystem. Netflix invests heavily in original content to drive subscriber growth. Charter leverages physical network assets to offer bundled services. Their distinct investment profiles reflect Netflix’s growth-driven digital platform versus Charter’s infrastructure-heavy service model.
Income Statement Comparison
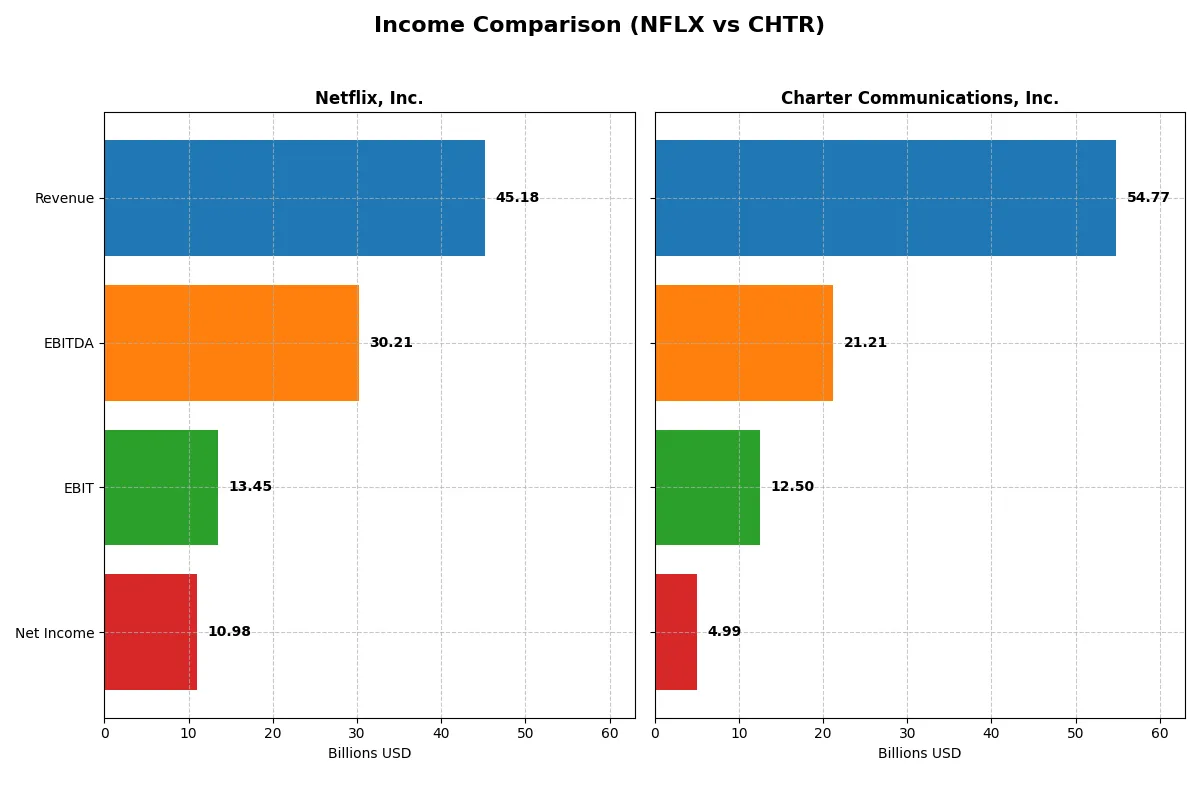
This data dissects the core profitability and scalability of both corporate engines to reveal who dominates the bottom line:
| Metric | Netflix, Inc. (NFLX) | Charter Communications, Inc. (CHTR) |
|---|---|---|
| Revenue | 45.2B | 54.8B |
| Cost of Revenue | 23.3B | 29.4B |
| Operating Expenses | 8.6B | 12.0B |
| Gross Profit | 21.9B | 25.4B |
| EBITDA | 30.2B | 21.2B |
| EBIT | 13.5B | 12.5B |
| Interest Expense | 0.78B | 5.0B |
| Net Income | 11.0B | 5.0B |
| EPS | 2.58 | 36.9 |
| Fiscal Year | 2025 | 2025 |
Income Statement Analysis: The Bottom-Line Duel
This income statement comparison reveals which company operates its business with greater efficiency and stronger profitability trends.
Netflix, Inc. Analysis
Netflix’s revenue surged 15.9% to $45.2B in 2025, while net income jumped 26% to $11B. The company sustains a robust gross margin near 48.5% and an impressive net margin of 24.3%, signaling excellent cost control and scalability. Momentum is strong with consistent expansion in earnings per share and operating income.
Charter Communications, Inc. Analysis
Charter’s revenue declined slightly by 0.6% to $54.8B in 2025, with net income slipping to $5B. Its gross margin at 46.3% remains healthy but below Netflix’s, while net margin is modest at 9.1%. Despite stable EBITDA, operating income and margins show slight pressure, reflecting challenges in revenue growth and higher interest expenses.
Margin Leadership vs. Scale Resilience
Netflix demonstrates superior margin expansion and faster profit growth, doubling net income over five years. Charter offers scale and steady cash flow but faces revenue stagnation and margin compression. For investors prioritizing high profitability and growth momentum, Netflix’s profile stands out as more compelling.
Financial Ratios Comparison
These vital ratios act as a diagnostic tool to expose the underlying fiscal health, valuation premiums, and capital efficiency of the companies compared below:
| Ratios | Netflix, Inc. (NFLX) | Charter Communications, Inc. (CHTR) |
|---|---|---|
| ROE | 41.3% | 31.1% |
| ROIC | 25.2% | 7.3% |
| P/E | 36.1 | 5.7 |
| P/B | 14.9 | 1.8 |
| Current Ratio | 1.19 | 0.39 |
| Quick Ratio | 1.19 | 0.39 |
| D/E (Debt-to-Equity) | 0.54 | 5.90 |
| Debt-to-Assets | 26.0% | 61.4% |
| Interest Coverage | 17.2 | 2.64 |
| Asset Turnover | 0.81 | 0.36 |
| Fixed Asset Turnover | 22.5 | 1.18 |
| Payout Ratio | 0 | 0 |
| Dividend Yield | 0 | 0 |
| Fiscal Year | 2025 | 2025 |
Efficiency & Valuation Duel: The Vital Signs
Financial ratios act as a company’s DNA, uncovering hidden risks and operational strengths that raw numbers alone cannot reveal.
Netflix, Inc.
Netflix demonstrates robust profitability with a 41.3% ROE and strong 24.3% net margin, signaling excellent operational efficiency. However, its valuation appears stretched with a P/E of 36.1 and a high P/B of 14.9, indicating premium pricing. Netflix returns value through reinvestment in R&D, fueling growth instead of dividends.
Charter Communications, Inc.
Charter shows decent profitability with a 31.1% ROE but a modest 9.1% net margin, reflecting moderate operational efficiency. Its valuation is attractive with a low P/E of 5.7 and reasonable P/B of 1.76, suggesting undervaluation. Charter lacks dividends and carries high debt, indicating risks in liquidity and leverage despite potential growth.
Premium Valuation vs. Operational Safety
Netflix offers superior profitability and solid reinvestment but at a premium valuation, increasing risk. Charter’s valuation is compelling but is weighed down by leverage and weaker margins. Investors seeking growth with operational excellence may prefer Netflix; those prioritizing value and yield might consider Charter’s profile.
Which one offers the Superior Shareholder Reward?
Netflix and Charter Communications both eschew dividends, focusing on reinvestment and buyback strategies. Netflix’s free cash flow per share stands at $2.24 in 2025, with no dividends but modest buybacks supporting growth. Charter’s free cash flow per share is $32.7, with stronger buybacks evident despite heavy leverage (debt-to-equity 5.9x). Netflix’s payout model is sustainable given its high EBIT margin (29.5%) and solid cash coverage, whereas Charter’s elevated debt and thin net margin (9.1%) raise risk. I see Netflix offering superior long-term shareholder reward through prudent capital allocation and growth reinvestment. Charter’s higher buyback intensity is riskier amid its leverage and weaker profitability in 2026. Netflix wins for risk-adjusted total return.
Comparative Score Analysis: The Strategic Profile
The radar chart reveals the fundamental DNA and trade-offs of both firms, highlighting their core financial strengths and vulnerabilities:
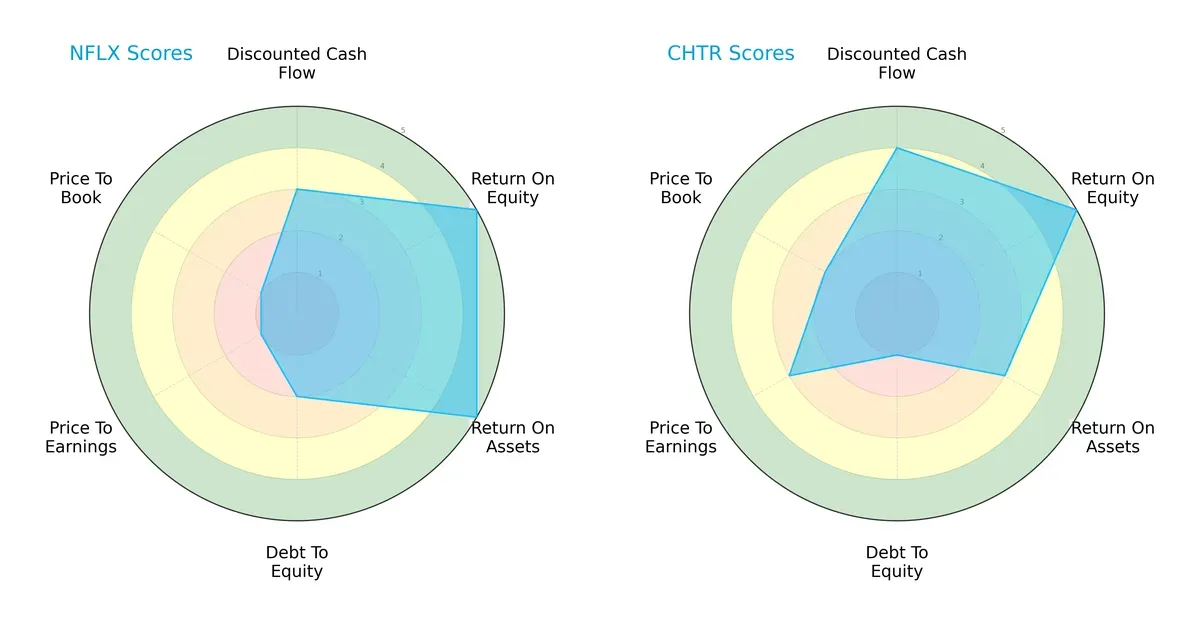
Netflix, Inc. excels in return metrics with top ROE and ROA scores of 5, signaling efficient profit generation and asset use. However, its valuation scores (PE and PB at 1) reflect significant overvaluation risks. Charter Communications, Inc. shows a more balanced financial profile, boasting a stronger discounted cash flow score (4) and better valuation metrics, though it suffers from a weak debt-to-equity score (1), indicating higher leverage risk. Netflix relies heavily on operational efficiency, while Charter balances growth prospects against financial risk.
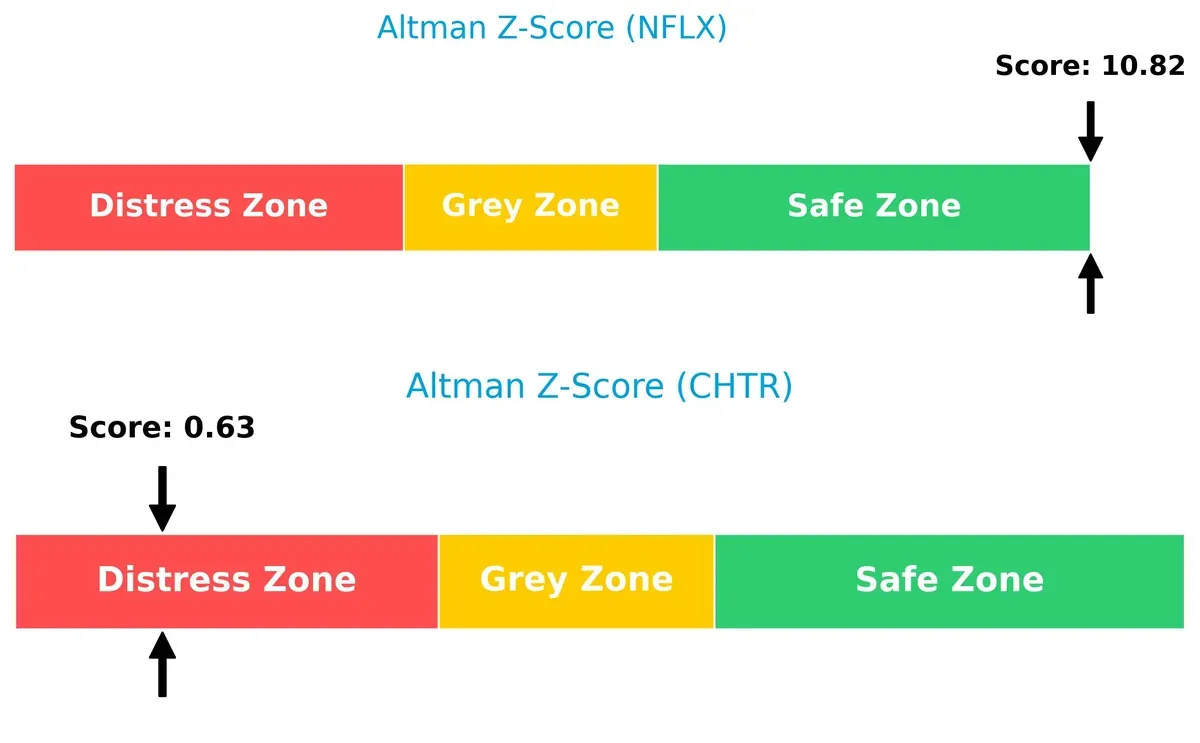
Bankruptcy Risk: Solvency Showdown
Netflix’s Altman Z-Score of 10.8 firmly places it in the safe zone, signaling robust long-term solvency. Charter’s score of 0.6 in the distress zone raises red flags about its bankruptcy risk, especially under current market pressures:
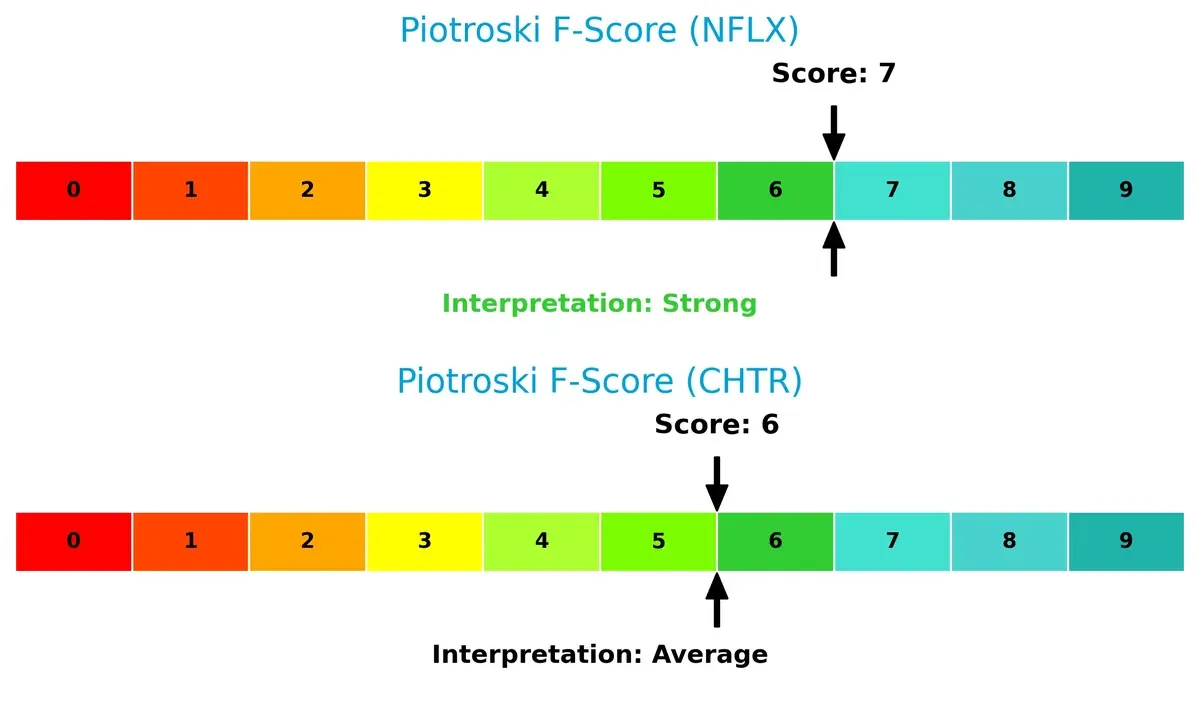
Financial Health: Quality of Operations
Netflix’s Piotroski F-Score of 7 denotes strong financial health, reflecting sound profitability and operational efficiency. Charter’s score of 6, while decent, signals moderate caution with potential internal weaknesses compared to Netflix:
How are the two companies positioned?
This section dissects Netflix and Charter Communications’ operational DNA by comparing revenue distribution and internal strengths and weaknesses. The goal is to confront their economic moats and identify which model delivers a more resilient, sustainable competitive advantage today.
Revenue Segmentation: The Strategic Mix
This comparison dissects how Netflix and Charter Communications diversify income and where their core sector bets concentrate:
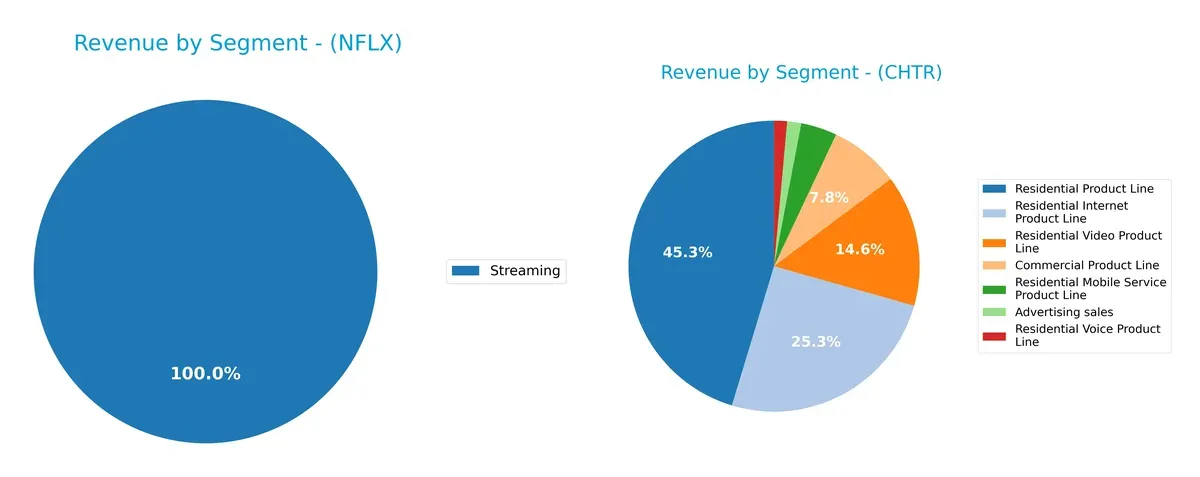
Netflix anchors nearly all revenue in its Streaming segment, generating $39B in 2024. Domestic DVD revenues have become negligible. Charter displays a far more diversified portfolio, with Residential Product Line dominating at $43B but supported by Commercial ($7.25B), Advertising ($1.78B), Mobile ($3.08B), Video ($15.1B), and Voice ($1.44B). Charter’s spread reduces concentration risk, while Netflix’s focus on streaming shows ecosystem lock-in but exposes it to single-segment volatility.
Strengths and Weaknesses Comparison
This table compares the strengths and weaknesses of Netflix, Inc. and Charter Communications, Inc.:
Netflix Strengths
- High net margin at 24.3%
- ROE of 41.26% outperforms sector averages
- Strong ROIC of 25.22% well above WACC
- Favorable quick ratio at 1.19
- Low debt-to-assets ratio at 26.01%
- Significant global presence with revenues across US, EMEA, Asia, Latin America
Charter Strengths
- Favorable ROE of 31.06%
- Low WACC at 4.82% supports capital efficiency
- Attractive PE ratio at 5.66
- Large diversified product line including internet, video, mobile
- Strong residential segment revenues above 42B USD
- Established commercial and advertising sales lines
Netflix Weaknesses
- High PE of 36.11 signals expensive valuation
- High PB ratio at 14.9 indicates overvaluation
- WACC of 11.59% exceeds ROIC, impacting value creation
- Neutral current ratio at 1.19 suggests tight liquidity
- No dividend yield limits income generation
Charter Weaknesses
- Low current and quick ratios at 0.39 indicate liquidity risk
- High debt-to-equity of 5.9 and debt-to-assets at 61.44% increase financial leverage
- Unfavorable asset turnover at 0.36 signals inefficiency
- Interest coverage only 2.48 times raises solvency concerns
- No dividend yield despite heavy leverage
Netflix exhibits strong profitability and global diversification but faces valuation and capital cost challenges. Charter shows solid capital efficiency and product diversification but struggles with liquidity and high leverage. Each company’s strategic priorities likely reflect addressing these core financial strengths and weaknesses.
The Moat Duel: Analyzing Competitive Defensibility
A structural moat shields long-term profits from relentless competitive pressure. It ensures sustainable value creation through unique advantages:
Netflix, Inc.: Intangible Assets and Network Effects Powerhouse
Netflix leverages a vast content library and global subscriber base, driving strong 29.8% EBIT margins and a 13.6% ROIC premium over WACC. Expansion into mobile games and new markets in 2026 could deepen its moat.
Charter Communications, Inc.: Cost Advantage with Scale and Infrastructure
Charter’s extensive broadband network creates high switching costs, though its 22.8% EBIT margin and 2.45% ROIC premium over WACC trail Netflix. Its scale in 41 states offers room for growth but faces pressure from evolving telecom tech.
Content Dominance vs. Infrastructure Scale: Netflix’s Intangible Edge Outpaces Charter’s Physical Network
Netflix’s wider moat emerges from superior ROIC and margin stability driven by intangible assets and network effects. Charter’s cost advantage is solid but narrower, making Netflix better positioned to defend market share in 2026.
Which stock offers better returns?
The past year shows Netflix surging 38%, despite recent pullbacks, while Charter Communications fell 27% amid volatile trading and accelerating declines.
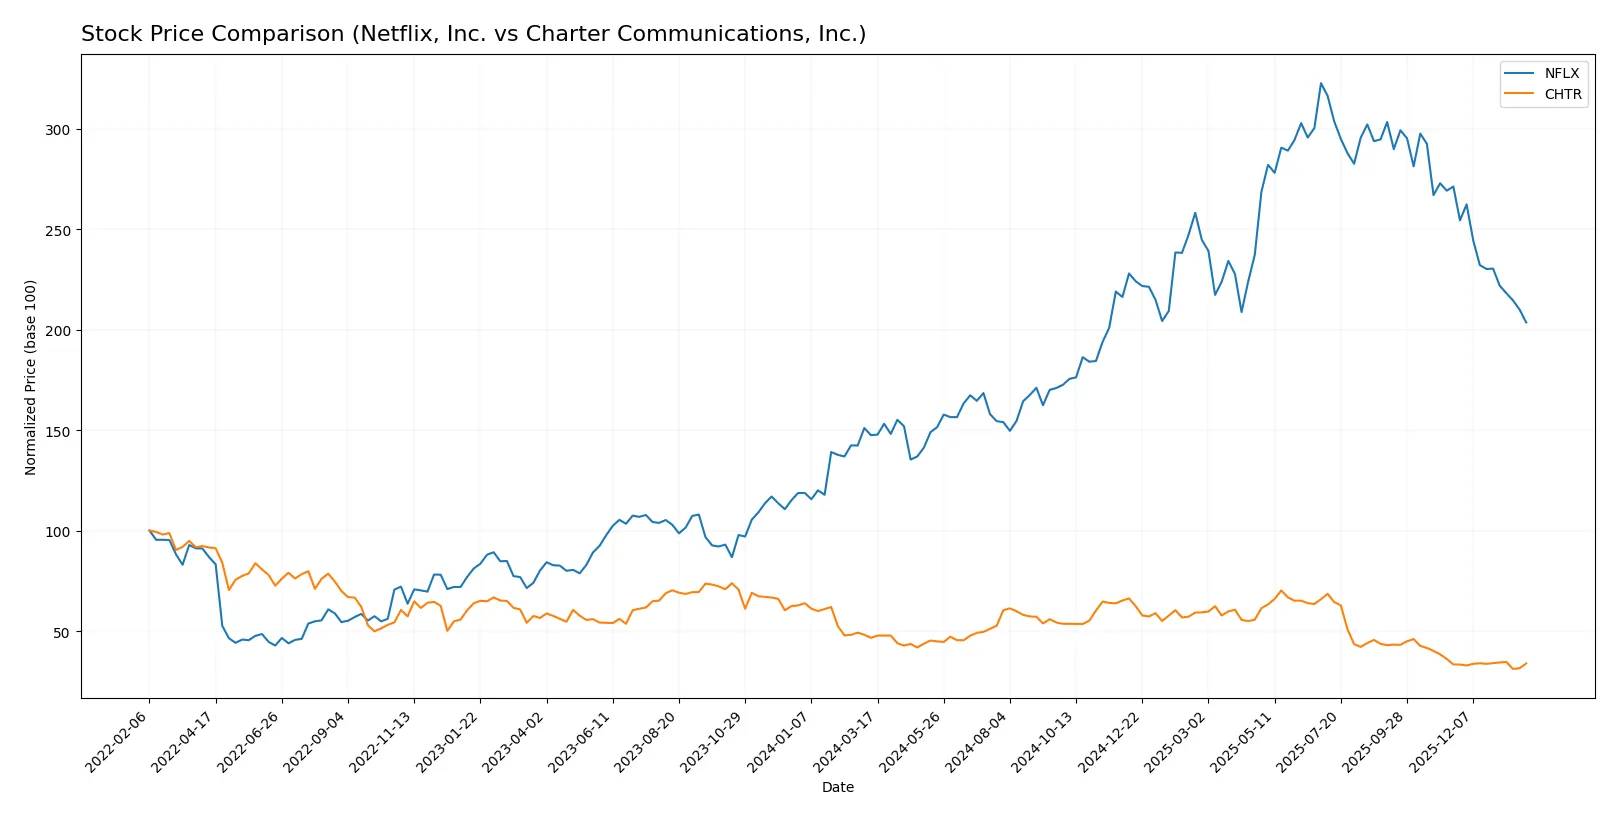
Trend Comparison
Netflix’s stock rose 38.05% over the last 12 months, marking a bullish trend with decelerating momentum. The price ranged between 55.5 and 132.31, with high volatility (22.37 SD).
Charter Communications declined 27.37%, confirming a bearish trend with accelerating losses. Volatility was much higher at 63.15 SD, with prices fluctuating between 189.76 and 427.25.
Netflix outperformed Charter Communications by a wide margin over the year, delivering significantly stronger market returns despite recent short-term weakness.
Target Prices
Analysts present a wide-ranging target consensus reflecting diverse outlooks for Netflix, Inc. and Charter Communications, Inc.
| Company | Target Low | Target High | Consensus |
|---|---|---|---|
| Netflix, Inc. | 95 | 152 | 117.25 |
| Charter Communications, Inc. | 160 | 500 | 287.5 |
Netflix’s consensus target of 117.25 suggests a 40% upside from the current 83.49 price, indicating growth expectations. Charter’s 287.5 consensus exceeds the current 206.12 price by nearly 40%, reflecting optimism despite its broad target range.

Don’t Let Luck Decide Your Entry Point
Optimize your entry points with our advanced ProRealTime indicators. You’ll get efficient buy signals with precise price targets for maximum performance. Start outperforming now!
How do institutions grade them?
Netflix, Inc. Grades
The table below summarizes recent grades from key financial institutions for Netflix, Inc.:
| Grading Company | Action | New Grade | Date |
|---|---|---|---|
| Freedom Capital Markets | Buy | Buy | 2026-01-27 |
| Argus Research | Maintain | Buy | 2026-01-22 |
| Wolfe Research | Maintain | Outperform | 2026-01-21 |
| Needham | Maintain | Buy | 2026-01-21 |
| Pivotal Research | Maintain | Hold | 2026-01-21 |
| Goldman Sachs | Maintain | Neutral | 2026-01-21 |
| BMO Capital | Maintain | Outperform | 2026-01-21 |
| Deutsche Bank | Maintain | Hold | 2026-01-21 |
| Canaccord Genuity | Maintain | Buy | 2026-01-21 |
| Oppenheimer | Maintain | Outperform | 2026-01-21 |
Charter Communications, Inc. Grades
The table below summarizes recent grades from key financial institutions for Charter Communications, Inc.:
| Grading Company | Action | New Grade | Date |
|---|---|---|---|
| Bernstein | Maintain | Market Perform | 2026-01-16 |
| Wells Fargo | Downgrade | Underweight | 2026-01-13 |
| UBS | Maintain | Neutral | 2025-12-22 |
| Wells Fargo | Maintain | Equal Weight | 2025-11-03 |
| Bernstein | Downgrade | Market Perform | 2025-11-03 |
| RBC Capital | Maintain | Sector Perform | 2025-11-03 |
| Keybanc | Downgrade | Sector Weight | 2025-11-03 |
| Benchmark | Maintain | Buy | 2025-11-03 |
| Citigroup | Maintain | Buy | 2025-11-03 |
| Barclays | Maintain | Underweight | 2025-11-03 |
Which company has the best grades?
Netflix, Inc. holds consistently higher grades, with multiple Buy and Outperform assessments. Charter Communications shows mixed and often downgraded ratings, including several Underweight and Market Perform grades. This divergence signals stronger institutional confidence in Netflix’s prospects compared to Charter, which may influence investor sentiment and portfolio positioning.
Risks specific to each company
The following categories identify critical pressure points and systemic threats facing Netflix, Inc. and Charter Communications, Inc. in the 2026 market environment:
1. Market & Competition
Netflix, Inc.
- Faces intense streaming competition from global and niche players, challenging subscriber growth and pricing power.
Charter Communications, Inc.
- Competes in a saturated broadband market with pressure from fiber providers and wireless alternatives limiting growth.
2. Capital Structure & Debt
Netflix, Inc.
- Maintains moderate leverage (D/E 0.54) with strong interest coverage (17.33x), balancing growth investment and financial risk.
Charter Communications, Inc.
- Exhibits high leverage (D/E 5.9) and weak liquidity (current ratio 0.39), increasing refinancing and solvency risks amid economic uncertainty.
3. Stock Volatility
Netflix, Inc.
- High beta (1.71) indicates significant price swings, reflecting market sensitivity to subscriber and content risks.
Charter Communications, Inc.
- Lower beta (1.06) suggests comparatively stable stock price, but recent high volatility due to earnings and regulatory concerns.
4. Regulatory & Legal
Netflix, Inc.
- Subject to content regulation and data privacy laws globally, requiring constant compliance adaptation.
Charter Communications, Inc.
- Faces regulatory scrutiny on broadband pricing, net neutrality, and media ownership, creating potential legal challenges.
5. Supply Chain & Operations
Netflix, Inc.
- Relies on internet infrastructure and content delivery networks, vulnerable to bandwidth costs and outages.
Charter Communications, Inc.
- Dependent on physical network maintenance and hardware supply, exposed to labor and raw material cost pressures.
6. ESG & Climate Transition
Netflix, Inc.
- Increasing pressure to reduce carbon footprint in data centers and enhance content diversity and social governance.
Charter Communications, Inc.
- Faces challenges in energy consumption of network operations and demands for transparent environmental reporting.
7. Geopolitical Exposure
Netflix, Inc.
- Global streaming footprint exposes it to geopolitical tensions, censorship, and foreign regulation risks.
Charter Communications, Inc.
- Primarily US-focused, limiting international geopolitical risks but vulnerable to domestic policy shifts.
Which company shows a better risk-adjusted profile?
Netflix’s manageable leverage and strong financial metrics offset high market competition and volatility risks. Charter’s heavy debt burden and liquidity weaknesses raise significant caution despite stable market positioning. Netflix’s Altman Z-score (10.8) firmly places it in the safe zone, while Charter’s distress zone score (0.63) signals elevated bankruptcy risk. I see Netflix as having a better risk-adjusted profile. The stark contrast in debt-to-equity ratios and liquidity metrics justifies this concern, especially given Charter’s financial distress indicators.
Final Verdict: Which stock to choose?
Netflix’s superpower lies in its unmatched ability to generate high returns on invested capital with a durable competitive moat. It consistently creates value and drives growth, though its premium valuation and moderate liquidity ratios warrant vigilance. This stock suits an aggressive growth portfolio seeking market-leading innovation.
Charter Communications boasts a strategic moat through its asset-heavy infrastructure and steady earnings, supported by a favorable cost of capital. It offers more price stability than Netflix but carries higher financial leverage risks. Charter fits investors targeting GARP—growth at a reasonable price—with a tolerance for capital structure risks.
If you prioritize dynamic growth and scalable profitability, Netflix outshines due to its superior ROIC and robust income growth. However, if you seek relative safety with value-oriented exposure and can withstand leverage concerns, Charter offers better stability and an attractive valuation premium. Each appeals to distinct investor profiles balancing growth and risk tolerance.
Disclaimer: Investment carries a risk of loss of initial capital. The past performance is not a reliable indicator of future results. Be sure to understand risks before making an investment decision.
Go Further
I encourage you to read the complete analyses of Netflix, Inc. and Charter Communications, Inc. to enhance your investment decisions: