Home > Comparison > Technology > WDC vs NTAP
The strategic rivalry between Western Digital Corporation and NetApp, Inc. defines the current trajectory of the computer hardware sector. Western Digital operates as a capital-intensive manufacturer of data storage devices, while NetApp focuses on high-margin, cloud-led data management services. This head-to-head highlights a clash between traditional hardware production and innovative cloud infrastructure solutions. This analysis aims to identify which corporate strategy delivers the superior risk-adjusted returns for a diversified portfolio.
Table of contents
Companies Overview
Western Digital Corporation and NetApp, Inc. both command critical roles in the computer hardware sector, shaping data storage and management technologies worldwide.
Western Digital Corporation: Data Storage Pioneer
Western Digital Corporation leads in data storage devices and solutions globally. Its revenue stems from manufacturing HDDs, SSDs, and flash-based products for client and enterprise markets. In 2026, it strategically focuses on expanding enterprise storage platforms and flash-based innovations to capture growing data center demands.
NetApp, Inc.: Cloud-Led Data Management Specialist
NetApp, Inc. excels in cloud-led and data-centric services for managing data across on-premises and public clouds. It generates revenue from intelligent data management software and infrastructure solutions. In 2026, NetApp prioritizes hybrid cloud integration and enhancing cloud operations services to solidify its position in multi-cloud environments.
Strategic Collision: Similarities & Divergences
Western Digital emphasizes hardware-centric storage solutions, while NetApp invests heavily in software-driven cloud data management. Their competition centers on enterprise data infrastructure and cloud adoption. Western Digital offers tangible storage products, whereas NetApp’s value lies in cloud software ecosystems—each appealing to distinct investment profiles in a transforming technology landscape.
Income Statement Comparison
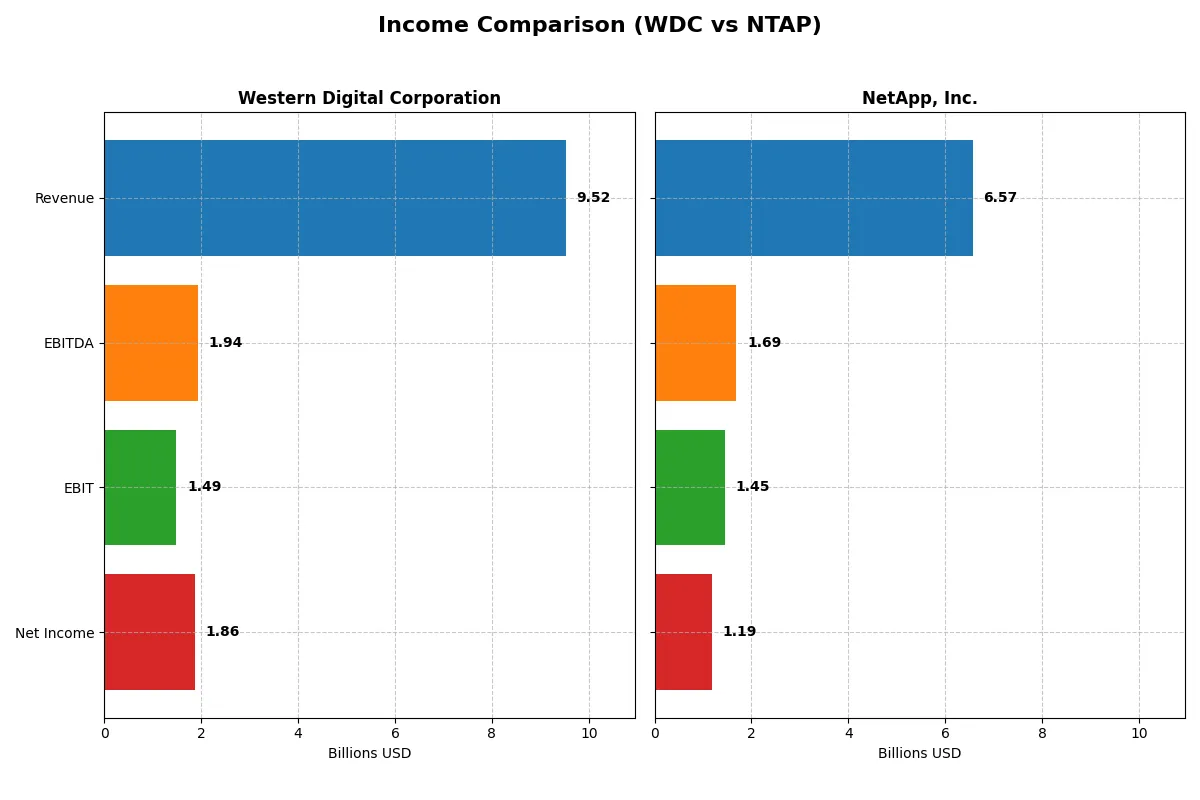
This data dissects the core profitability and scalability of both corporate engines to reveal who dominates the bottom line:
| Metric | Western Digital Corporation (WDC) | NetApp, Inc. (NTAP) |
|---|---|---|
| Revenue | 9.52B | 6.57B |
| Cost of Revenue | 5.83B | 1.96B |
| Operating Expenses | 1.36B | 3.28B |
| Gross Profit | 3.69B | 4.61B |
| EBITDA | 1.94B | 1.69B |
| EBIT | 1.49B | 1.45B |
| Interest Expense | 357M | 64M |
| Net Income | 1.86B | 1.19B |
| EPS | 5.31 | 5.81 |
| Fiscal Year | 2025 | 2025 |
Income Statement Analysis: The Bottom-Line Duel
This income statement comparison reveals which company operates with superior efficiency and financial momentum over recent years.
Western Digital Corporation Analysis
Western Digital’s revenue shows volatility, dropping from 18.8B in 2022 to 6.3B in 2024 before rebounding to 9.5B in 2025. Net income recovered spectacularly from -852M in 2024 to 1.86B in 2025, reflecting a sharp margin improvement. Its 2025 net margin of 19.55% and gross margin of 38.78% demonstrate a return to profitability and efficiency after a turbulent period.
NetApp, Inc. Analysis
NetApp’s revenue steadily grows from 5.74B in 2021 to 6.57B in 2025, a moderate 14% rise over five years. The company sustains robust gross margins above 70%, with net income climbing from 730M in 2021 to 1.19B in 2025. NetApp’s net margin of 18.05% and EBIT margin of 22.02% in 2025 reveal consistent operational strength and controlled costs.
Margin Resilience vs. Revenue Recovery
NetApp delivers steady revenue growth paired with strong, stable margins, reflecting a consistent business model. Western Digital exhibits wild swings in revenue but achieved a remarkable turnaround in net income and margins in 2025. For investors, NetApp’s steady, margin-rich profile offers reliability, while Western Digital’s volatile path signals higher risk but potential for rapid profit rebounds.
Financial Ratios Comparison
These vital ratios act as a diagnostic tool to expose the underlying fiscal health, valuation premiums, and capital efficiency of the companies analyzed:
| Ratios | Western Digital Corporation (WDC) | NetApp, Inc. (NTAP) |
|---|---|---|
| ROE | 35.0% | 114.0% |
| ROIC | 21.5% | 16.5% |
| P/E | 11.8 | 15.4 |
| P/B | 4.14 | 17.6 |
| Current Ratio | 1.08 | 1.26 |
| Quick Ratio | 0.84 | 1.22 |
| D/E (Debt-to-Equity) | 0.96 | 3.36 |
| Debt-to-Assets | 36.3% | 32.3% |
| Interest Coverage | 6.54 | 20.89 |
| Asset Turnover | 0.68 | 0.61 |
| Fixed Asset Turnover | 4.06 | 8.17 |
| Payout Ratio | 2.36% | 35.8% |
| Dividend Yield | 0.20% | 2.32% |
| Fiscal Year | 2025 | 2025 |
Efficiency & Valuation Duel: The Vital Signs
Financial ratios serve as a company’s DNA, uncovering hidden risks and operational strengths that raw numbers alone cannot reveal.
Western Digital Corporation
Western Digital posts a robust 35% ROE and solid 19.6% net margin, signaling strong profitability. Its P/E of 11.8 suggests the stock trades at a reasonable valuation, while a P/B of 4.14 raises some valuation concerns. Dividend yield is minimal at 0.2%, indicating a preference for reinvesting in R&D to fuel future growth.
NetApp, Inc.
NetApp delivers an extraordinary 114% ROE and a healthy 18.1% net margin, reflecting exceptional shareholder value creation. Its P/E at 15.4 is fair, albeit higher than Western Digital’s, while a steep P/B of 17.6 flags possible overvaluation. The 2.32% dividend yield demonstrates strong shareholder returns alongside efficient capital deployment.
Valuation Discipline vs. High ROE Excellence
Western Digital offers a more balanced valuation with solid profitability, while NetApp impresses with superior ROE and dividends but at a premium price. Investors prioritizing operational efficiency may favor Western Digital’s valuation discipline; those seeking outsized returns might lean toward NetApp’s high ROE profile.
Which one offers the Superior Shareholder Reward?
I compare Western Digital Corporation (WDC) and NetApp, Inc. (NTAP) on dividends, payout ratios, and buybacks. WDC pays a negligible dividend yield (0.2%) with a minimal 2.4% payout ratio and modest buybacks, reflecting conservative distributions amid recent profit volatility. NTAP offers a healthy 2.3% dividend yield with a 36% payout ratio, backed by consistent free cash flow (FCF) coverage above 80%. NTAP’s aggressive buyback program complements its yield, enhancing total shareholder return. I observe NTAP’s distribution model as more sustainable and rewarding for 2026 investors, given its stable profitability and capital allocation efficiency.
Comparative Score Analysis: The Strategic Profile
The radar chart reveals the fundamental DNA and strategic trade-offs of Western Digital Corporation and NetApp, Inc.:
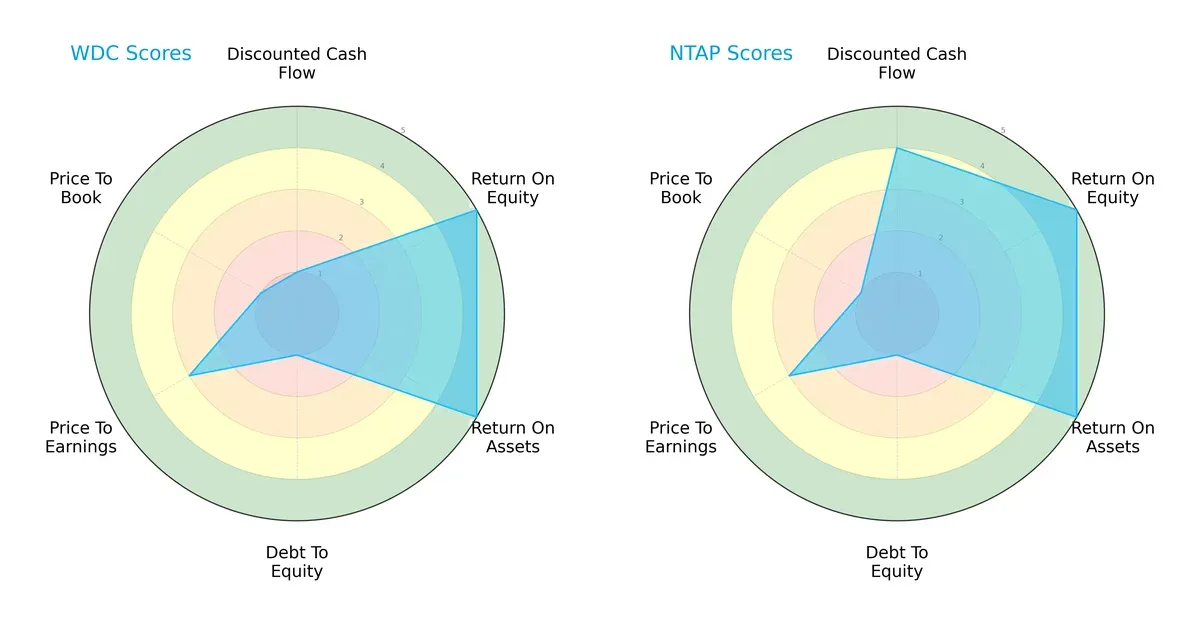
Western Digital shows strength in return on equity and assets but suffers in discounted cash flow, debt-to-equity, and price-to-book metrics. NetApp delivers a more balanced profile, excelling in discounted cash flow while sharing similar weaknesses in leverage and valuation. NetApp’s DCF advantage suggests better cash flow prospects, whereas Western Digital relies heavily on operational returns despite financial risks.
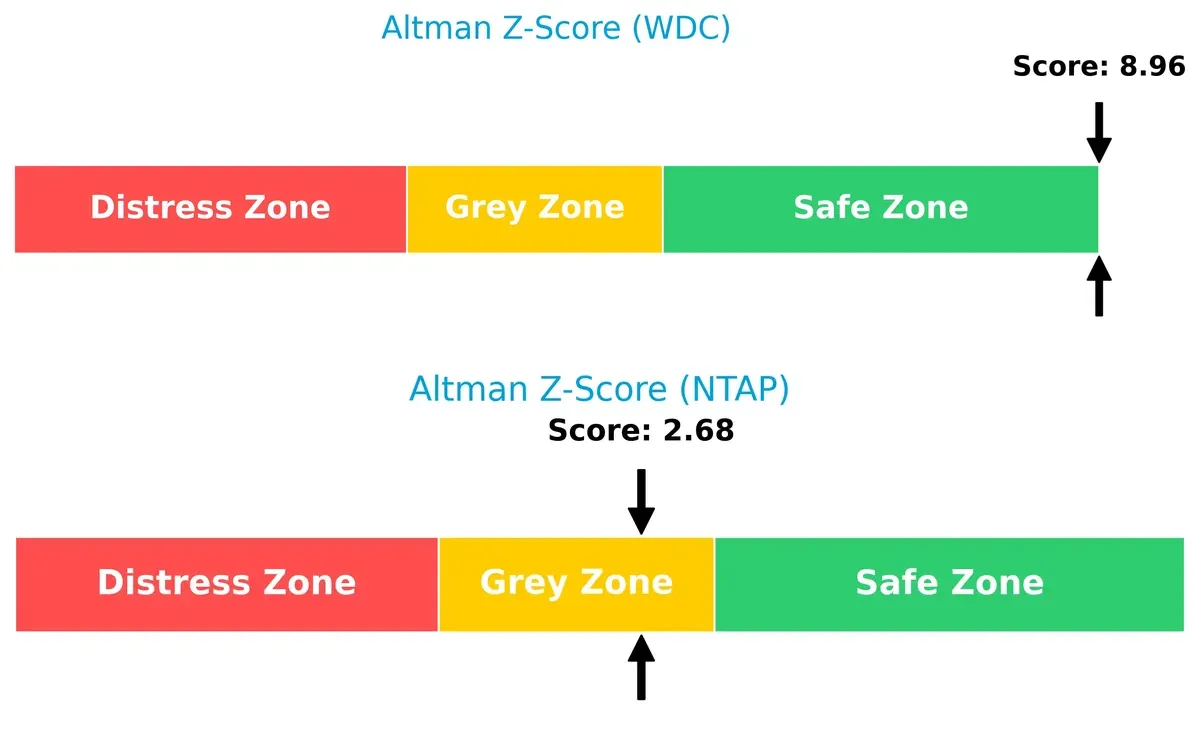
Bankruptcy Risk: Solvency Showdown
Western Digital’s Altman Z-Score of 8.96 places it firmly in the safe zone, indicating robust financial stability. NetApp’s 2.68 sits in the grey zone, signaling moderate bankruptcy risk and caution in this cycle:
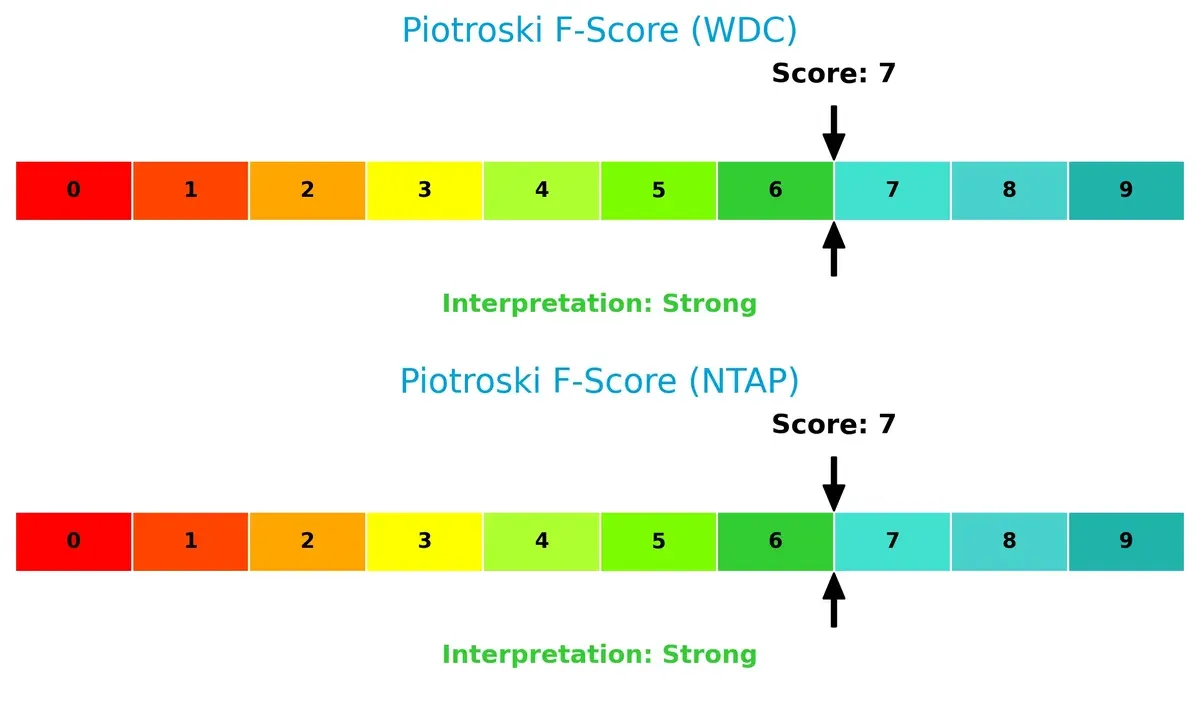
Financial Health: Quality of Operations
Both companies score 7 on the Piotroski F-Score, indicating strong financial health. Neither shows immediate red flags in profitability, leverage, or liquidity metrics, supporting operational resilience:
How are the two companies positioned?
This section dissects the operational DNA of Western Digital and NetApp by comparing their revenue distribution by segment and internal dynamics. The objective is to confront their economic moats to identify which model offers the most resilient and sustainable competitive advantage today.
Revenue Segmentation: The Strategic Mix
This visual comparison dissects how Western Digital Corporation and NetApp, Inc. diversify their income streams and where their primary sector bets lie:
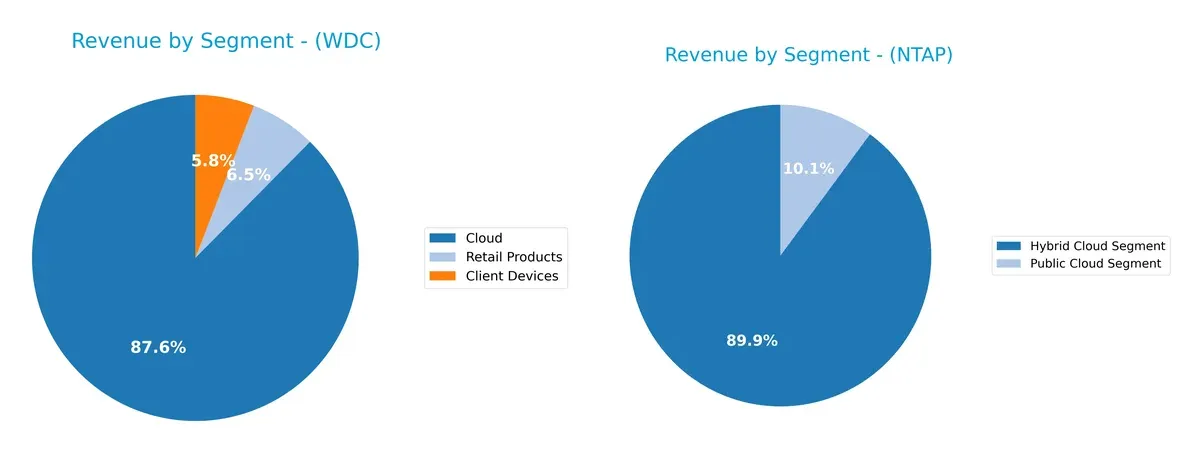
Western Digital leans heavily on its Cloud segment, generating $8.34B in 2025, dwarfing Client Devices at $556M and Retail Products at $623M. This concentration signals a pivot toward infrastructure dominance. NetApp’s revenue splits between Hybrid Cloud ($5.91B) and Public Cloud ($665M) segments, showing a more balanced approach. NetApp’s diversification reduces concentration risk, while Western Digital’s reliance on cloud infrastructure carries higher stakes but potential ecosystem lock-in.
Strengths and Weaknesses Comparison
This table compares the Strengths and Weaknesses of Western Digital Corporation and NetApp, Inc.:
Western Digital Corporation Strengths
- Diverse revenue from Client Devices, Cloud, and Retail Products
- Favorable net margin at 19.55%
- Strong ROE at 35.04%
- ROIC at 21.53% above WACC
- Global presence with significant Americas and Asia sales
NetApp, Inc. Strengths
- Focused Hybrid and Public Cloud segments with consistent revenue
- Very high ROE at 114.04%
- Favorable quick ratio and interest coverage
- Fixed asset turnover strong at 8.17
- Higher dividend yield at 2.32%
Western Digital Corporation Weaknesses
- WACC higher than ROIC, indicating capital cost concerns
- PB ratio elevated at 4.14
- Dividend yield very low at 0.2%
- Moderate liquidity ratios (current and quick)
- Debt to equity near 1.0, indicating leverage
NetApp, Inc. Weaknesses
- Elevated debt to equity at 3.36, increasing financial risk
- High PB ratio at 17.6, suggesting overvaluation
- P/E neutral at 15.44
- Asset turnover below 1.0, indicating asset use efficiency limits
Both companies exhibit slightly favorable overall financial profiles but face distinct challenges. Western Digital’s capital cost and valuation metrics warrant caution. NetApp’s high leverage and valuation multiples may pressure its risk profile. Their strategic focus on different cloud segments and geographic markets reveals differentiated paths to sustaining competitive advantages.
The Moat Duel: Analyzing Competitive Defensibility
A structural moat shields long-term profits from relentless competition and market pressures. Here’s how Western Digital and NetApp stack up:
Western Digital Corporation: Cost Advantage and Scale Power
Western Digital leverages a cost advantage through manufacturing scale and diversified storage solutions. Its strong ROIC above WACC (9.3%) and rising profitability reflect this moat. Expansion into enterprise SSDs and data center platforms could deepen its edge in 2026.
NetApp, Inc.: Intangible Assets and Software Ecosystem
NetApp’s moat centers on its intangible assets—intelligent data management software—and integrated cloud solutions. Though its ROIC spread (7.2%) is smaller, its robust software ecosystem strengthens customer lock-in. Growth in hybrid and public cloud services offers upside in 2026.
Manufacturing Scale vs. Software Ecosystem: Who Holds the Stronger Moat?
Western Digital’s wider moat stems from a larger ROIC gap and scale-driven cost leadership. NetApp’s software ecosystem provides a narrower, but durable advantage. I see Western Digital better positioned to defend market share amid hardware commoditization.
Which stock offers better returns?
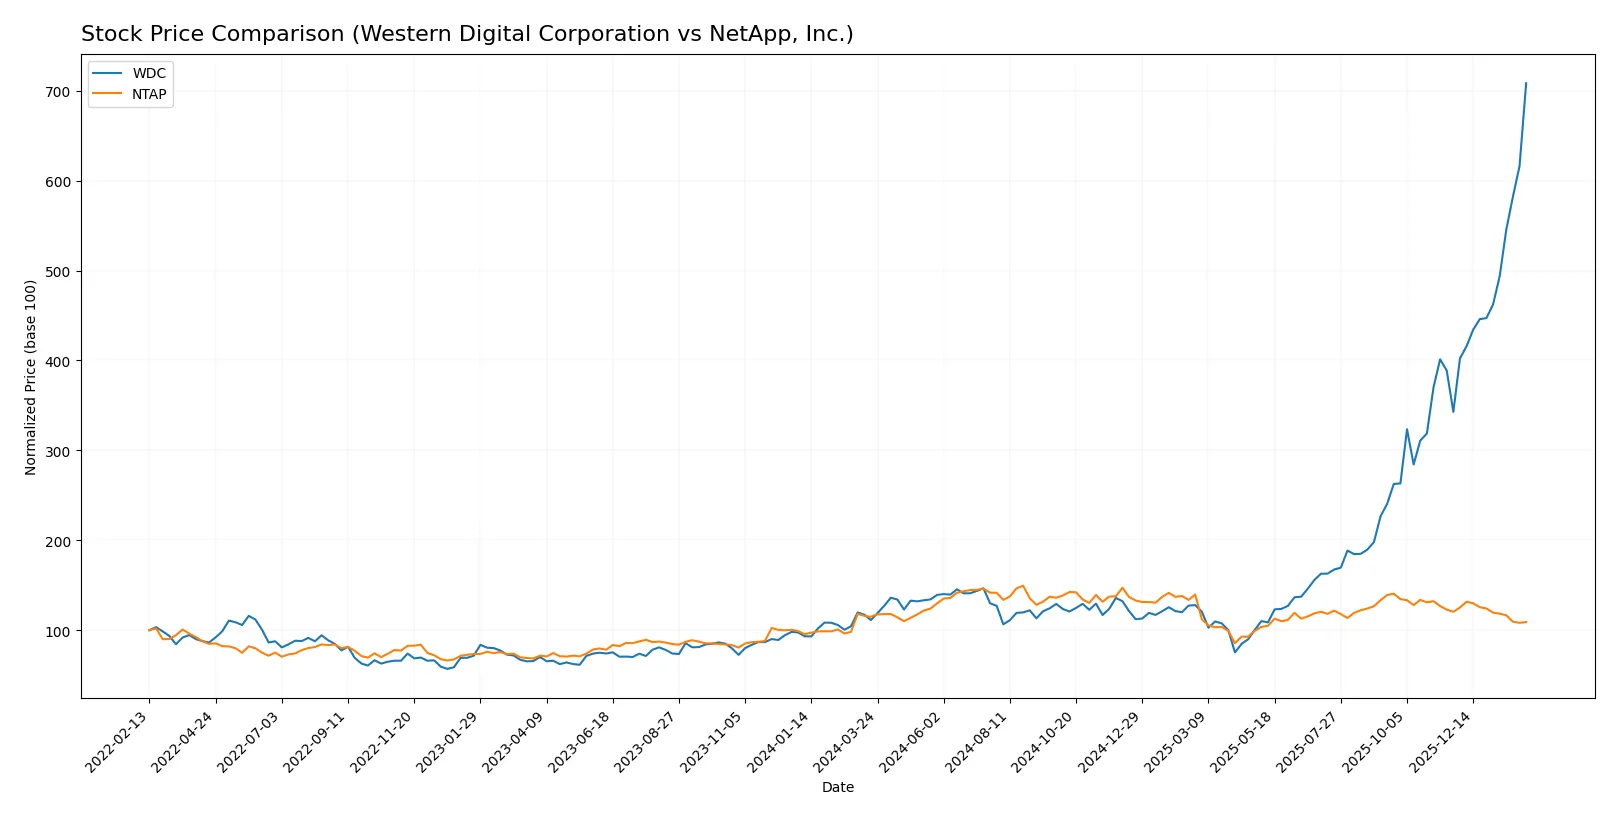
The past year shows starkly divergent price movements: Western Digital surges with strong buyer dominance, while NetApp faces steady declines amid seller pressure.
Trend Comparison
Western Digital’s stock surged 537% over the past year, marking a bullish trend with accelerating gains and a high 54 volatility level. The price peaked at 288 and bottomed at 31.
NetApp’s stock fell 5.2% over the same period, reflecting a bearish trend with decelerating losses and lower volatility near 12. The price ranged between 76 and 133.
Western Digital outperformed NetApp decisively, delivering the highest market returns and stronger buyer momentum throughout the year.
Target Prices
Analysts present a clear target price consensus for Western Digital Corporation and NetApp, Inc.
| Company | Target Low | Target High | Consensus |
|---|---|---|---|
| Western Digital Corporation | 205 | 340 | 285.92 |
| NetApp, Inc. | 89 | 137 | 120.5 |
Western Digital’s consensus target of 285.92 is near its current price of 291.16, suggesting limited upside. NetApp’s target of 120.5 indicates roughly 24% potential gain versus its 96.81 price, reflecting stronger analyst optimism.

Don’t Let Luck Decide Your Entry Point
Optimize your entry points with our advanced ProRealTime indicators. You’ll get efficient buy signals with precise price targets for maximum performance. Start outperforming now!
How do institutions grade them?
Western Digital Corporation Grades
The following table summarizes recent grades assigned to Western Digital Corporation by reputable institutions:
| Grading Company | Action | New Grade | Date |
|---|---|---|---|
| Citigroup | Maintain | Buy | 2026-02-02 |
| Barclays | Maintain | Overweight | 2026-02-02 |
| Cantor Fitzgerald | Maintain | Overweight | 2026-01-30 |
| Wells Fargo | Maintain | Overweight | 2026-01-30 |
| Goldman Sachs | Maintain | Neutral | 2026-01-30 |
| Morgan Stanley | Maintain | Overweight | 2026-01-30 |
| TD Cowen | Maintain | Buy | 2026-01-30 |
| Wedbush | Maintain | Outperform | 2026-01-30 |
| Mizuho | Maintain | Outperform | 2026-01-27 |
| Morgan Stanley | Maintain | Overweight | 2026-01-22 |
NetApp, Inc. Grades
Below is a summary of recent grades awarded to NetApp, Inc. by recognized grading firms:
| Grading Company | Action | New Grade | Date |
|---|---|---|---|
| Morgan Stanley | Downgrade | Underweight | 2026-01-20 |
| Northland Capital Markets | Upgrade | Outperform | 2025-11-26 |
| UBS | Maintain | Neutral | 2025-11-26 |
| Barclays | Maintain | Overweight | 2025-11-26 |
| Wells Fargo | Maintain | Equal Weight | 2025-11-26 |
| B of A Securities | Maintain | Neutral | 2025-11-26 |
| Citigroup | Maintain | Neutral | 2025-11-12 |
| Citigroup | Maintain | Neutral | 2025-10-16 |
| Argus Research | Maintain | Buy | 2025-08-29 |
| Barclays | Maintain | Overweight | 2025-08-28 |
Which company has the best grades?
Western Digital holds consistently positive grades, mostly “Overweight,” “Buy,” and “Outperform,” signaling strong institutional confidence. NetApp’s grades are more mixed, including a recent downgrade to “Underweight” by Morgan Stanley. This contrast may influence investors toward Western Digital for perceived stability in analyst sentiment.
Risks specific to each company
The following categories identify the critical pressure points and systemic threats facing both firms in the 2026 market environment:
1. Market & Competition
Western Digital Corporation (WDC)
- Faces intense competition in storage hardware with pressure from SSD and cloud alternatives.
NetApp, Inc. (NTAP)
- Competes in cloud-led data management; faces rapid innovation and competitive cloud service providers.
2. Capital Structure & Debt
Western Digital Corporation (WDC)
- Moderate leverage with D/E near 1.0; interest coverage ratio is neutral at 4.17.
NetApp, Inc. (NTAP)
- Higher leverage (D/E 3.36) but strong interest coverage of 22.61, indicating manageable debt service.
3. Stock Volatility
Western Digital Corporation (WDC)
- Beta of 1.84 signals high volatility relative to the market.
NetApp, Inc. (NTAP)
- Lower beta at 1.39 suggests relatively less stock price volatility.
4. Regulatory & Legal
Western Digital Corporation (WDC)
- Exposed to data privacy and trade regulations across multiple international markets.
NetApp, Inc. (NTAP)
- Faces regulatory scrutiny in cloud services and data security compliance globally.
5. Supply Chain & Operations
Western Digital Corporation (WDC)
- Supply chain risks from manufacturing hardware components globally, including geopolitical tensions.
NetApp, Inc. (NTAP)
- Relies on cloud infrastructure partners; operational risks linked to service availability and integration.
6. ESG & Climate Transition
Western Digital Corporation (WDC)
- Needs to manage environmental impact of manufacturing and energy consumption.
NetApp, Inc. (NTAP)
- Focuses on sustainable cloud solutions but must address data center energy efficiency.
7. Geopolitical Exposure
Western Digital Corporation (WDC)
- Significant exposure to US-China trade tensions affecting supply and sales.
NetApp, Inc. (NTAP)
- Moderate geopolitical risk due to global cloud service footprint but less manufacturing exposure.
Which company shows a better risk-adjusted profile?
Western Digital’s largest risk is its high stock volatility and sensitive exposure to geopolitical tensions, notably US-China trade issues. NetApp’s principal risk lies in its elevated debt levels despite strong interest coverage. Overall, NetApp presents a better risk-adjusted profile, supported by its favorable debt servicing and lower beta. Notably, Western Digital’s beta near 1.84 signals amplified market swings, a red flag for risk-averse investors.
Final Verdict: Which stock to choose?
Western Digital’s superpower lies in its ability to generate exceptional returns on invested capital well above its cost of capital, signaling a robust and expanding moat. Its rapid earnings growth suggests a cash machine dynamic, but the modest liquidity ratios warrant vigilance. It suits aggressive growth portfolios seeking upside in a cyclical industry.
NetApp’s strategic moat centers on its strong recurring revenue from cloud-focused storage solutions and consistent profitability with a conservative capital structure. It offers better liquidity and interest coverage than Western Digital, making it a safer harbor. This stock fits well in GARP portfolios balancing growth with reasonable financial stability.
If you prioritize high-return, high-growth investments with cyclical exposure, Western Digital outshines due to its accelerating profitability and market momentum. However, if you seek steady growth with stronger liquidity and a strategic software moat, NetApp offers better stability despite recent price softness. Each scenario aligns with distinct risk tolerances and investment horizons.
Disclaimer: Investment carries a risk of loss of initial capital. The past performance is not a reliable indicator of future results. Be sure to understand risks before making an investment decision.
Go Further
I encourage you to read the complete analyses of Western Digital Corporation and NetApp, Inc. to enhance your investment decisions: