Home > Comparison > Technology > NTAP vs SMCI
The strategic rivalry between NetApp, Inc. and Super Micro Computer, Inc. shapes the Technology sector’s hardware landscape. NetApp leads with cloud-focused data management solutions, while Super Micro delivers modular, high-performance server and storage systems. This head-to-head contrasts a software-driven hybrid cloud model against a hardware-centric, scalable architecture. This analysis will reveal which company’s trajectory offers a superior risk-adjusted return for diversified portfolios navigating technological evolution.
Table of contents
Companies Overview
NetApp and Super Micro Computer dominate the computer hardware sector with distinct approaches to data infrastructure.
NetApp, Inc.: Cloud-Led Data Management Leader
NetApp serves as a cloud-led and data-centric service provider. Its core revenue stems from intelligent data management software and storage infrastructure solutions across hybrid and public cloud environments. In 2026, NetApp prioritizes expanding cloud storage and operations services, enhancing software like ONTAP and Cloud Volumes to cement its competitive advantage in hybrid cloud integration.
Super Micro Computer, Inc.: Modular Server Innovator
Super Micro Computer excels in high-performance server and storage solutions built on modular, open architecture. It generates revenue by selling application-optimized servers, storage systems, and software management tools globally. The company’s 2026 strategy focuses on broadening its footprint in enterprise data centers and emerging markets like AI, 5G, and edge computing, driving growth through flexible, scalable hardware solutions.
Strategic Collision: Similarities & Divergences
Both firms target enterprise data infrastructure but diverge sharply: NetApp emphasizes a software-driven, cloud-centric model, while Super Micro champions open, modular hardware systems. Their primary battleground lies in serving cloud and data center clients requiring scalable solutions. NetApp offers a software moat with steady cloud service growth, contrasting with Super Micro’s hardware agility and exposure to emerging tech markets.
Income Statement Comparison
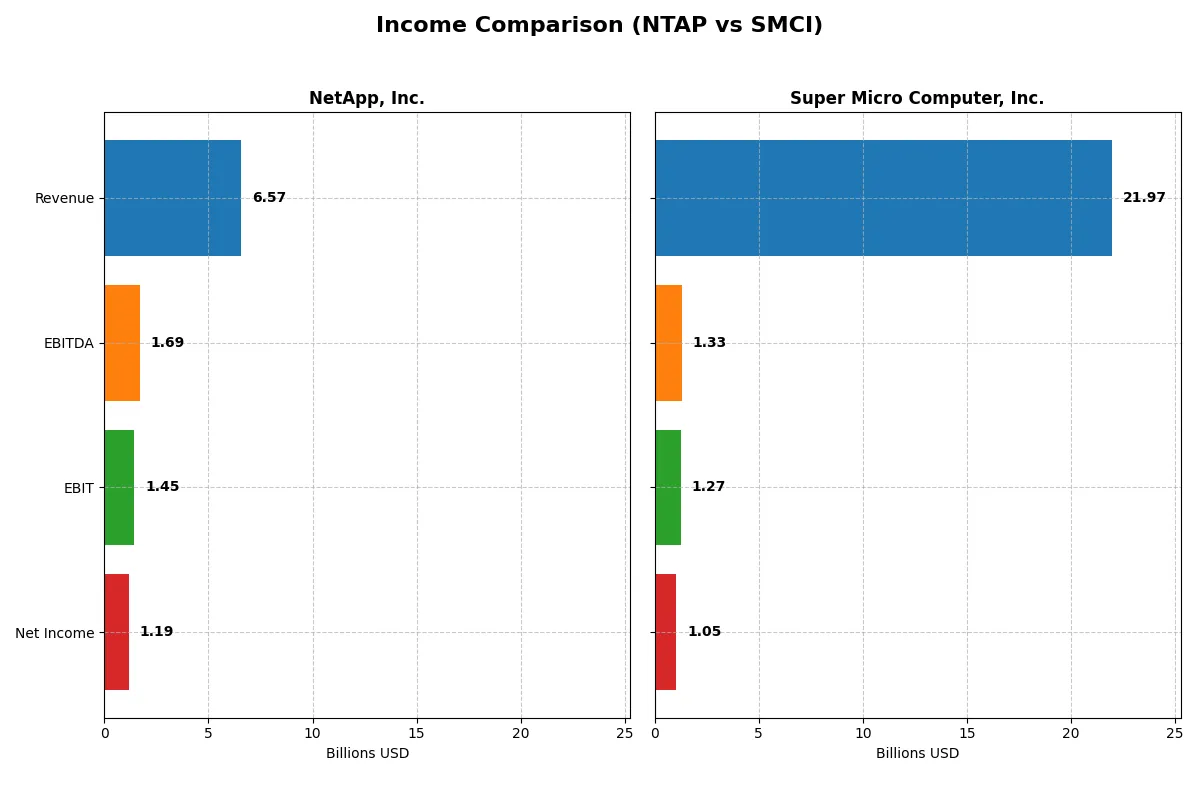
This data dissects the core profitability and scalability of both corporate engines to reveal who dominates the bottom line:
| Metric | NetApp, Inc. (NTAP) | Super Micro Computer, Inc. (SMCI) |
|---|---|---|
| Revenue | 6.57B | 21.97B |
| Cost of Revenue | 1.96B | 19.54B |
| Operating Expenses | 3.28B | 1.18B |
| Gross Profit | 4.61B | 2.43B |
| EBITDA | 1.69B | 1.33B |
| EBIT | 1.45B | 1.27B |
| Interest Expense | 64M | 60M |
| Net Income | 1.19B | 1.05B |
| EPS | 5.81 | 1.77 |
| Fiscal Year | 2025 | 2025 |
Income Statement Analysis: The Bottom-Line Duel
This income statement comparison reveals which company converts revenue into profit most efficiently, exposing the strength of each corporate engine.
NetApp, Inc. Analysis
NetApp’s revenue grew steadily from $5.7B in 2021 to $6.6B in 2025, with net income surging 62% over five years. The company sustains a high gross margin of 70% and a strong net margin near 18%, indicating robust profitability. In 2025, NetApp’s operational efficiency and margin expansion reflect disciplined cost control and solid earnings momentum.
Super Micro Computer, Inc. Analysis
Super Micro’s revenue skyrocketed from $3.6B in 2021 to $22B in 2025, a remarkable growth trajectory. However, its gross margin hovers around 11%, with a net margin just under 5%, showcasing tight profitability. Despite rapid expansion, Super Micro’s 2025 net income growth slowed, and margin pressure signals ongoing challenges in converting scale into sustained profit efficiency.
Margin Strength vs. Explosive Growth
NetApp leads with superior margins and consistent profit expansion, while Super Micro impresses with rapid top-line growth but weaker profitability. The fundamental winner on earnings quality is NetApp, whose efficient margin profile makes it more attractive for investors prioritizing stable returns over sheer scale.
Financial Ratios Comparison
These vital ratios act as a diagnostic tool to expose the underlying fiscal health, valuation premiums, and capital efficiency of the companies compared below:
| Ratios | NetApp, Inc. (NTAP) | Super Micro Computer, Inc. (SMCI) |
|---|---|---|
| ROE | 114% | 16.6% |
| ROIC | 16.5% | 9.3% |
| P/E | 15.4 | 27.7 |
| P/B | 17.6 | 4.62 |
| Current Ratio | 1.26 | 5.25 |
| Quick Ratio | 1.22 | 3.25 |
| D/E | 3.36 | 0.76 |
| Debt-to-Assets | 32.3% | 34.1% |
| Interest Coverage | 20.9 | 21.0 |
| Asset Turnover | 0.61 | 1.57 |
| Fixed Asset Turnover | 8.17 | 27.5 |
| Payout ratio | 35.8% | 0% |
| Dividend yield | 2.32% | 0% |
| Fiscal Year | 2025 | 2025 |
Efficiency & Valuation Duel: The Vital Signs
Financial ratios serve as a company’s DNA, unveiling underlying risks and operational strengths that raw numbers alone cannot show.
NetApp, Inc.
NetApp demonstrates robust profitability with an ROE of 114% and a solid 18% net margin, signaling operational excellence. Its P/E of 15.4 suggests a fairly valued stock, though a high P/B at 17.6 flags potential overvaluation. The company rewards shareholders with a 2.32% dividend yield, balancing cash returns and reinvestment in R&D.
Super Micro Computer, Inc.
Super Micro posts a moderate 16.6% ROE but suffers from a weak net margin of 4.77%, indicating margin pressure. The stock trades at an elevated P/E of 27.7, reflecting stretched valuation. It offers no dividend, instead focusing on growth through reinvestment. Its high current ratio of 5.25 raises questions on capital efficiency.
Valuation Discipline vs. Growth Ambition
NetApp offers a stronger profitability profile with balanced valuation and shareholder returns, presenting a more measured risk-reward tradeoff. Super Micro’s premium multiples and low margins imply higher risk, suited for investors favoring growth over immediate income. The choice hinges on tolerance for valuation risk versus operational stability.
Which one offers the Superior Shareholder Reward?
I see NetApp, Inc. (NTAP) delivers steady dividends with a 2.3% yield and a prudent 36% payout ratio in 2025. Its free cash flow comfortably covers dividends, supporting sustainability. NTAP also executes moderate buybacks, enhancing total shareholder return. In contrast, Super Micro Computer, Inc. (SMCI) pays no dividends, instead reinvesting heavily in growth, reflected in its volatile operating cash flow and no buyback activity. While SMCI’s reinvestment aims for expansion, it lacks immediate shareholder rewards. Historically, NTAP’s balanced distribution and buybacks offer a more reliable and attractive total return profile in 2026.
Comparative Score Analysis: The Strategic Profile
The radar chart reveals the core DNA and trade-offs of NetApp, Inc. and Super Micro Computer, Inc., highlighting their financial strengths and valuation differences:
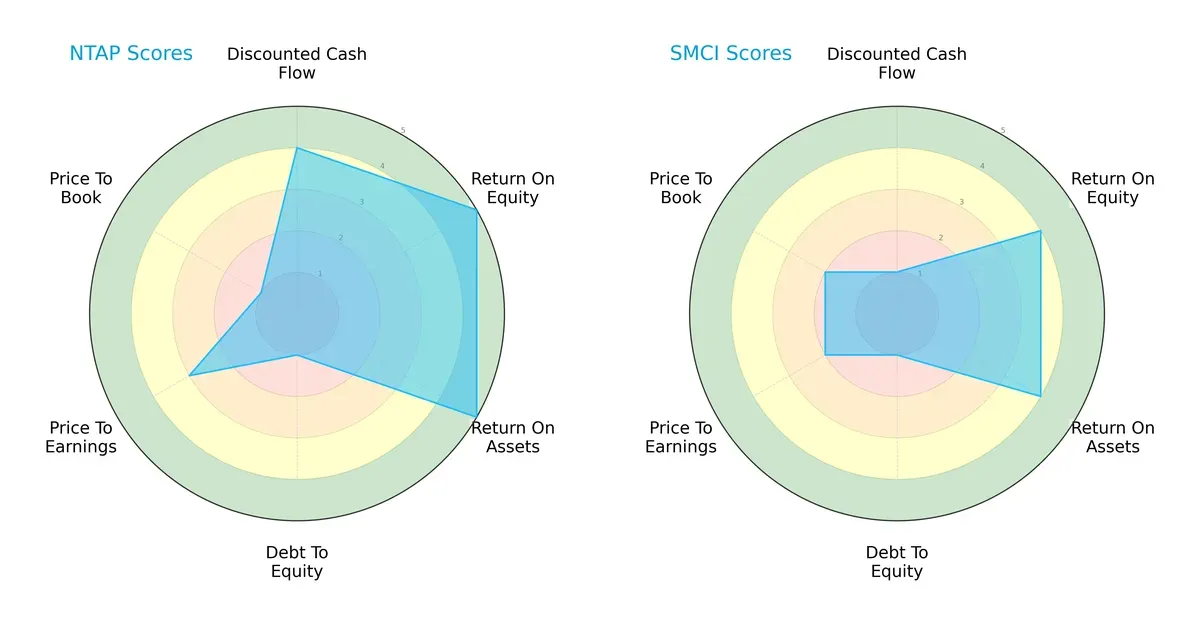
NetApp shows a more balanced profile with strong ROE and ROA scores (both 5), indicating efficient profit generation and asset use. It also scores higher on DCF (4) versus Super Micro’s weak 1, signaling better cash flow prospects. Both have poor debt-to-equity scores (1), exposing leverage risks. Valuation scores favor Super Micro slightly on price-to-book (2 vs. 1), but NetApp maintains a moderate edge on price-to-earnings (3 vs. 2). Overall, NetApp leverages operational efficiency, while Super Micro relies more on valuation appeal.
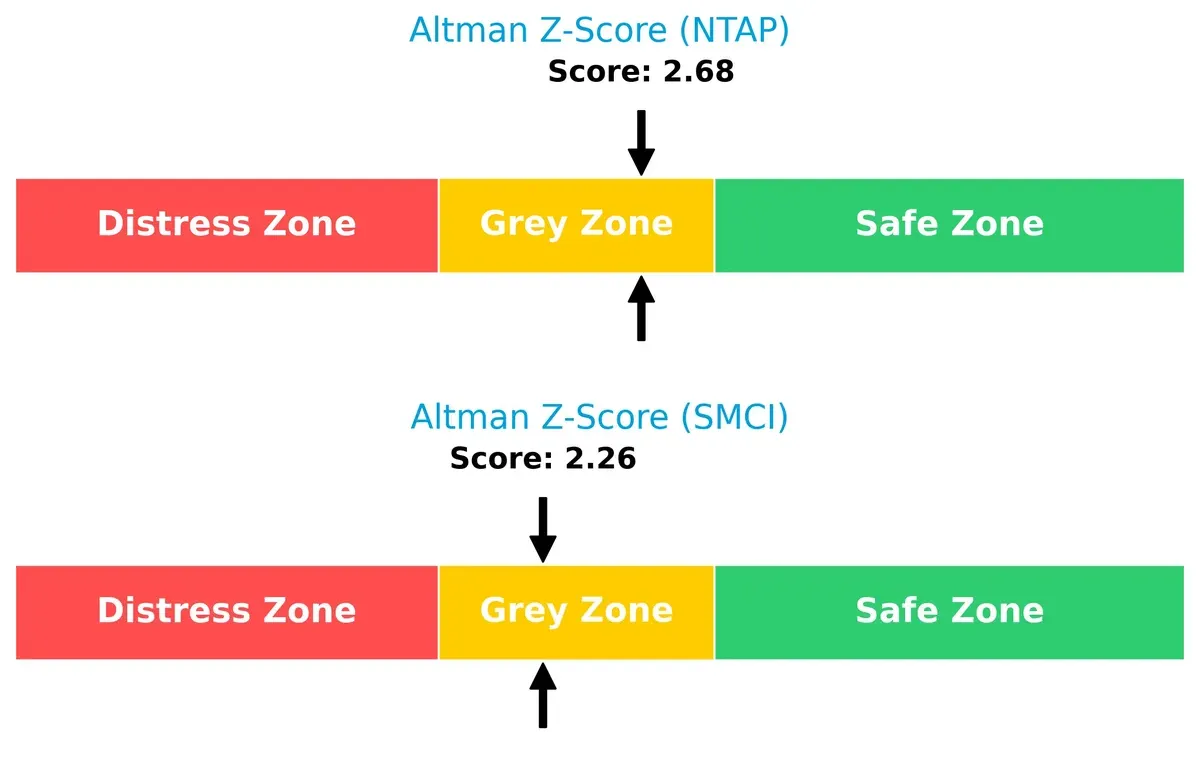
Bankruptcy Risk: Solvency Showdown
NetApp’s Altman Z-Score of 2.68 versus Super Micro’s 2.26 places both firms in the grey zone, implying moderate bankruptcy risk amid current market cycles:
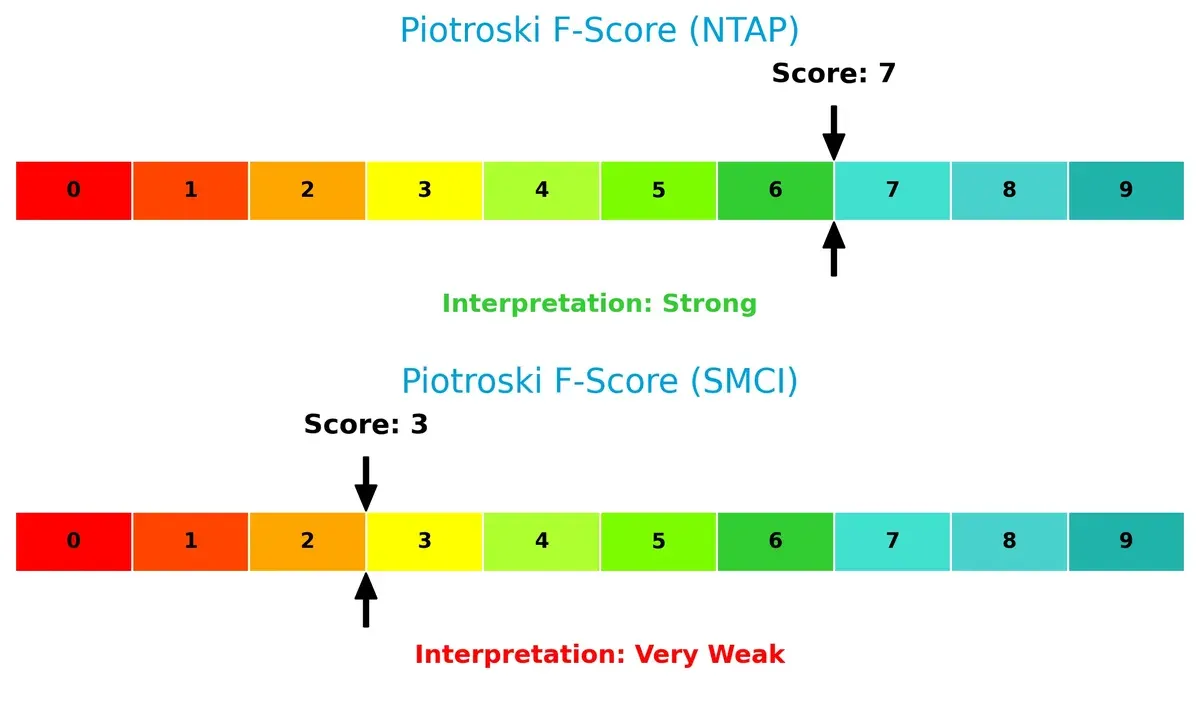
Financial Health: Quality of Operations
NetApp’s Piotroski F-Score of 7 signals strong financial health, contrasting sharply with Super Micro’s weak score of 3, which raises red flags on operational quality and internal metrics:
How are the two companies positioned?
This section dissects the operational DNA of NetApp and Super Micro by comparing their revenue distribution and internal dynamics. The goal is to confront their economic moats and identify which offers the most resilient, sustainable competitive advantage today.
Revenue Segmentation: The Strategic Mix
This visual comparison dissects how NetApp, Inc. and Super Micro Computer, Inc. diversify their income streams and where their primary sector bets lie:
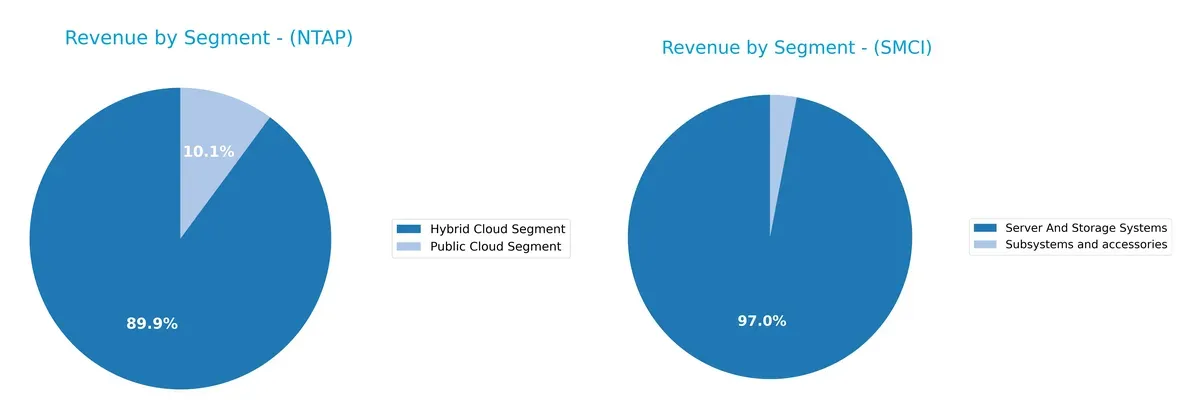
NetApp anchors revenue in its Hybrid Cloud Segment with $5.9B in 2025, complemented by a smaller $665M Public Cloud Segment. This mix shows moderate diversification with a strong cloud infrastructure focus. Super Micro Computer dwarfs this with $21.3B from Server And Storage Systems alone, relying heavily on this dominant segment alongside $660M in Subsystems. SMCI’s concentration implies higher risk but also signals infrastructure dominance in server hardware.
Strengths and Weaknesses Comparison
This table compares the strengths and weaknesses of NetApp and Super Micro based on diversification, profitability, financials, innovation, global presence, and market share:
NetApp Strengths
- Strong profitability with 18% net margin and 114% ROE
- Favorable liquidity with quick ratio 1.22
- Dividend yield of 2.32% supports shareholder returns
- Balanced global presence across Americas, EMEA, Asia Pacific
- Consistent revenue from hybrid and public cloud segments
Super Micro Strengths
- High asset turnover at 1.57 and fixed asset turnover 27.53
- Favorable ROE of 16.64% and interest coverage of 21.34
- Diversified revenue in server systems and accessories
- Large US market share with $13B revenue
- Strong quick ratio of 3.25 indicates good liquidity
NetApp Weaknesses
- High price-to-book ratio at 17.6 signals overvaluation risk
- Elevated debt-to-equity ratio of 3.36 indicates leverage concerns
- Moderate current ratio of 1.26 may limit short-term flexibility
- Neutral asset turnover at 0.61 suggests room for efficiency gains
- Slightly unfavorable mix with lower public cloud revenue
Super Micro Weaknesses
- Low net margin at 4.77% reflects profitability challenges
- High PE ratio of 27.74 raises valuation questions
- Unfavorable current ratio at 5.25 may indicate working capital imbalance
- No dividend yield limits income for investors
- Neutral ROIC at 9.26% may constrain capital returns
NetApp’s financial strength and balanced global footprint underpin its stable profitability, albeit with leverage risks. Super Micro excels operationally with efficient asset use and US market dominance but faces margin pressures and valuation concerns. Both companies show distinct strategic profiles with trade-offs in financial structure and market positioning.
The Moat Duel: Analyzing Competitive Defensibility
A structural moat is the only true shield protecting long-term profits from relentless competition erosion. Let’s dissect the moats of two tech hardware players:
NetApp, Inc.: Data Management Moat Anchored in Intangible Assets
NetApp’s moat stems from its portfolio of proprietary software and integrated cloud services, delivering high ROIC of 7.16% above WACC. Margin stability and 25.6% ROIC growth confirm durable value creation. The push into hybrid and public cloud markets should deepen this moat in 2026.
Super Micro Computer, Inc.: Modular Architecture Moat via Cost Advantage
Super Micro’s strength lies in its open, modular server designs, enabling rapid customization and cost efficiency. However, its ROIC lags WACC, signaling value erosion despite growing profitability. Expanding AI and 5G markets offer growth prospects, but margin pressure remains a risk.
Proprietary Software vs. Modular Cost Leadership: Which Moat Runs Deeper?
NetApp’s intangible asset-driven moat is wider and more sustainable, backed by superior ROIC and margin resilience. Super Micro’s cost advantage is narrower and less defensible long term. NetApp stands better poised to protect and grow its market share in 2026.
Which stock offers better returns?
The past year shows contrasting dynamics: NetApp’s stock declined modestly with slowing negative momentum, while Super Micro Computer plunged sharply overall but gained slightly in the recent quarter.
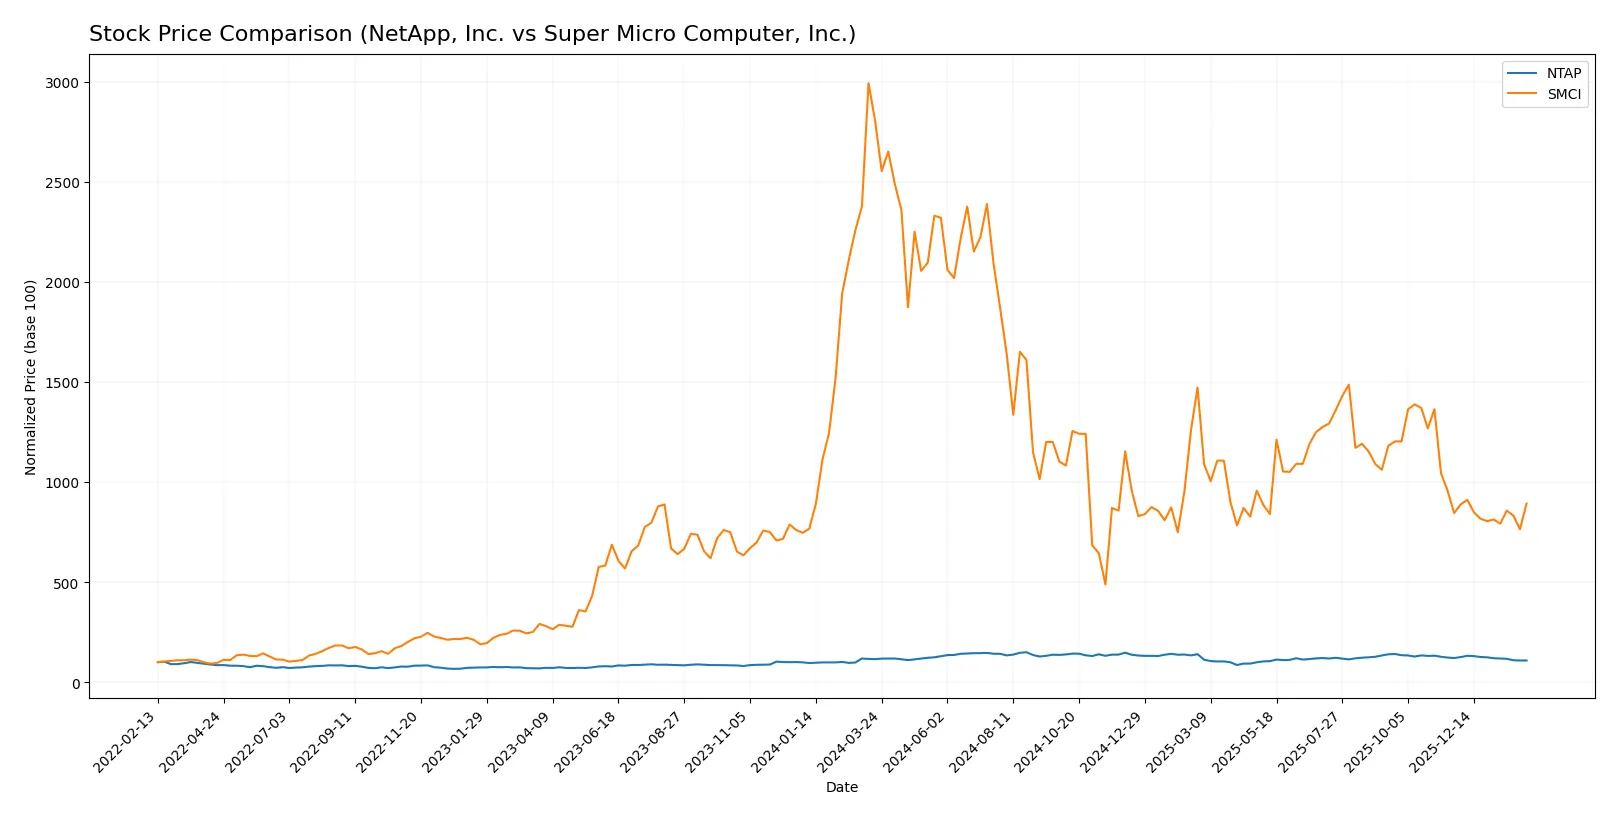
Trend Comparison
NetApp, Inc. recorded a 6.03% price decline over the past 12 months, indicating a bearish trend with deceleration. It hit a high of 133.12 and a low of 76.1, showing moderate volatility (std dev 12.22).
Super Micro Computer, Inc. suffered a severe 68.19% drop over 12 months, marking a bearish trend with accelerating decline. It ranged between 106.88 and 18.58, with high volatility (std dev 20.36).
Overall, NetApp’s stock outperformed Super Micro Computer’s, delivering a significantly smaller loss and showing less volatility in 2025–2026.
Target Prices
Analysts present a cautiously optimistic consensus for NetApp, Inc. and Super Micro Computer, Inc.
| Company | Target Low | Target High | Consensus |
|---|---|---|---|
| NetApp, Inc. | 89 | 137 | 120.5 |
| Super Micro Computer, Inc. | 26 | 64 | 47.13 |
NetApp’s target consensus of 120.5 suggests a 25% upside from the current 96.57 price. Super Micro’s 47.13 consensus implies a 36% potential gain over the 34.74 price.

Don’t Let Luck Decide Your Entry Point
Optimize your entry points with our advanced ProRealTime indicators. You’ll get efficient buy signals with precise price targets for maximum performance. Start outperforming now!
How do institutions grade them?
Here is a comparison of recent institutional grades for NetApp, Inc. and Super Micro Computer, Inc.:
NetApp, Inc. Grades
The following table summarizes recent grades issued by reputable financial firms for NetApp, Inc.:
| Grading Company | Action | New Grade | Date |
|---|---|---|---|
| Morgan Stanley | Downgrade | Underweight | 2026-01-20 |
| Northland Capital Markets | Upgrade | Outperform | 2025-11-26 |
| UBS | Maintain | Neutral | 2025-11-26 |
| Barclays | Maintain | Overweight | 2025-11-26 |
| Wells Fargo | Maintain | Equal Weight | 2025-11-26 |
| B of A Securities | Maintain | Neutral | 2025-11-26 |
| Citigroup | Maintain | Neutral | 2025-11-12 |
| Citigroup | Maintain | Neutral | 2025-10-16 |
| Argus Research | Maintain | Buy | 2025-08-29 |
| Barclays | Maintain | Overweight | 2025-08-28 |
Super Micro Computer, Inc. Grades
Below is a summary of recent institutional grades for Super Micro Computer, Inc.:
| Grading Company | Action | New Grade | Date |
|---|---|---|---|
| Barclays | Maintain | Equal Weight | 2024-10-02 |
| Loop Capital | Maintain | Buy | 2024-09-23 |
| JP Morgan | Downgrade | Neutral | 2024-09-06 |
| Barclays | Downgrade | Equal Weight | 2024-09-04 |
| Barclays | Maintain | Overweight | 2024-08-28 |
| Wells Fargo | Maintain | Equal Weight | 2024-08-28 |
| CFRA | Downgrade | Hold | 2024-08-28 |
| Goldman Sachs | Maintain | Neutral | 2024-08-08 |
| Wells Fargo | Maintain | Equal Weight | 2024-08-07 |
| Rosenblatt | Maintain | Buy | 2024-08-07 |
Which company has the best grades?
NetApp, Inc. shows a broader range of grades with recent upgrades to Outperform and stable Overweight ratings. Super Micro Computer, Inc. has mostly Equal Weight or Neutral grades with some downgrades, indicating NetApp currently holds more favorable institutional sentiment. Investors may interpret this as NetApp having a stronger consensus outlook.
Risks specific to each company
The following categories identify critical pressure points and systemic threats facing NetApp, Inc. and Super Micro Computer, Inc. in the 2026 market environment:
1. Market & Competition
NetApp, Inc.
- Strong hybrid cloud focus supports resilience amid tech shifts
- MarketCap of $19.3B reflects solid presence but faces fierce competition
Super Micro Computer, Inc.
- Faces intense price pressure with lower net margin and high stock volatility
- MarketCap of $20.7B shows scale but margin compression signals competitive stress
2. Capital Structure & Debt
NetApp, Inc.
- High debt-to-equity ratio (3.36) is a red flag despite strong interest coverage
- Interest coverage of 22.6x indicates solid ability to service debt
Super Micro Computer, Inc.
- Moderate debt-to-equity (0.76) keeps leverage manageable
- Interest coverage at 21.3x remains healthy
3. Stock Volatility
NetApp, Inc.
- Beta of 1.39 suggests moderately higher sensitivity to market swings
- Trading range is narrower, indicating more stable price action
Super Micro Computer, Inc.
- Higher beta at 1.52 points to elevated stock price volatility
- Broader price range and recent 17% jump signal speculative trading
4. Regulatory & Legal
NetApp, Inc.
- Operating globally with data management exposes it to data privacy regulations
- Compliance with cloud and data laws is critical but manageable
Super Micro Computer, Inc.
- Faces similar global regulatory risks in server manufacturing and exports
- Potential export restrictions could disrupt supply and sales
5. Supply Chain & Operations
NetApp, Inc.
- Relies on complex global supply chains for hardware components
- Hybrid cloud model diversifies operational risk across software and hardware
Super Micro Computer, Inc.
- Also dependent on global suppliers but smaller scale may offer flexibility
- Heavy hardware focus creates vulnerability to component shortages
6. ESG & Climate Transition
NetApp, Inc.
- Strong ESG integration needed to meet increasing investor and customer demands
- Opportunities in energy-efficient data solutions align with climate goals
Super Micro Computer, Inc.
- ESG efforts less disclosed, posing reputational and compliance risks
- Faces pressure to improve sustainability in manufacturing and logistics
7. Geopolitical Exposure
NetApp, Inc.
- Global operations expose it to US-China tensions and trade barriers
- Diversified customer base mitigates some geopolitical risks
Super Micro Computer, Inc.
- Similar exposure but higher sensitivity due to manufacturing footprint in Asia
- Concentrated supplier base in sensitive regions raises concerns
Which company shows a better risk-adjusted profile?
NetApp’s greatest risk lies in capital structure with its high leverage, despite strong profitability and stable business model. Super Micro’s core risk is market and competition pressure, reflected in weak margins and volatile stock price. I see NetApp offering a better risk-adjusted profile due to stronger financial metrics and more diversified operations. Notably, NetApp’s robust interest coverage contrasts sharply with Super Micro’s heightened stock volatility and margin compression, justifying caution for SMCI investors.
Final Verdict: Which stock to choose?
NetApp, Inc. excels as a disciplined cash generator with a very favorable moat, driven by a steadily growing ROIC well above its cost of capital. Its key point of vigilance lies in a moderately leveraged balance sheet that could pressure financial flexibility. This stock fits well in portfolios seeking stable, value-driven growth.
Super Micro Computer, Inc. holds a strategic edge through robust operational efficiency and strong asset turnover, reflecting nimble capital use in a competitive industry. While it carries a slightly unfavorable moat and a more volatile recent price trend, its high current liquidity offers a cushion. SMCI suits investors inclined toward growth with a tolerance for higher risk and market swings.
If you prioritize durable value creation and financial resilience, NetApp is the compelling choice due to its proven economic moat and consistent profitability. However, if you seek aggressive growth with operational agility and can withstand earnings volatility, Super Micro Computer offers a dynamic, though riskier, profile. Both present distinct analytical scenarios tailored to different investor strategies.
Disclaimer: Investment carries a risk of loss of initial capital. The past performance is not a reliable indicator of future results. Be sure to understand risks before making an investment decision.
Go Further
I encourage you to read the complete analyses of NetApp, Inc. and Super Micro Computer, Inc. to enhance your investment decisions: