Home > Comparison > Technology > STX vs NTAP
The strategic rivalry between Seagate Technology Holdings plc and NetApp, Inc. shapes the future of the computer hardware sector. Seagate operates as a capital-intensive manufacturer specializing in mass capacity data storage devices. NetApp positions itself as a cloud-led data management innovator with software-driven solutions. This analysis explores their contrasting models to determine which offers superior risk-adjusted returns for diversified portfolios amid evolving technology demands.
Table of contents
Companies Overview
Seagate Technology Holdings plc and NetApp, Inc. both command significant stakes in the computer hardware sector, shaping global data infrastructure.
Seagate Technology Holdings plc: Data Storage Pioneer
Seagate leads as a mass capacity storage product provider, specializing in HDDs and SSDs for enterprise nearline and consumer markets. Its revenue stems largely from hardware sales to OEMs and retailers. In 2026, Seagate strategically focuses on expanding its Lyve edge-to-cloud platform, leveraging its core strength in scalable data storage solutions.
NetApp, Inc.: Cloud-Led Data Management Innovator
NetApp drives growth through cloud-led and data-centric services, combining software and storage infrastructure for hybrid and public clouds. Its revenue mainly arises from intelligent data management software and cloud storage solutions. In 2026, NetApp emphasizes hybrid cloud integration and expands its ecosystem of professional and support services to enhance customer data agility.
Strategic Collision: Similarities & Divergences
Both firms operate in data storage and management but diverge sharply: Seagate centers on physical storage hardware, while NetApp builds on software-driven cloud services. Their primary battleground is enterprise data solutions, where hardware meets cloud management. Seagate embodies a traditional product-heavy model, whereas NetApp represents a software-plus-service investment profile with higher recurring revenue potential.
Income Statement Comparison
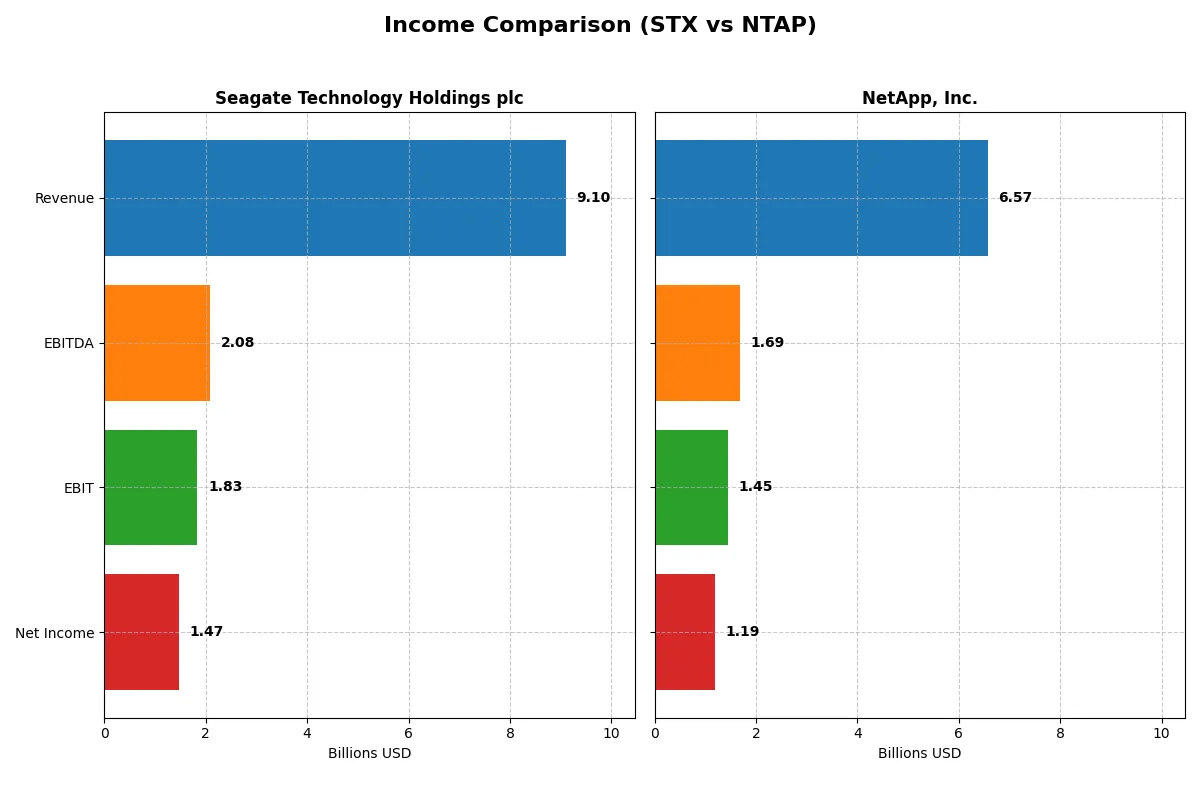
The following data dissects the core profitability and scalability of both corporate engines to reveal who dominates the bottom line:
| Metric | Seagate Technology Holdings plc (STX) | NetApp, Inc. (NTAP) |
|---|---|---|
| Revenue | 9.1B | 6.6B |
| Cost of Revenue | 5.9B | 2.0B |
| Operating Expenses | 1.3B | 3.3B |
| Gross Profit | 3.2B | 4.6B |
| EBITDA | 2.1B | 1.7B |
| EBIT | 1.8B | 1.4B |
| Interest Expense | 321M | 64M |
| Net Income | 1.5B | 1.2B |
| EPS | 6.93 | 5.81 |
| Fiscal Year | 2025 | 2025 |
Income Statement Analysis: The Bottom-Line Duel
This income statement comparison reveals which company operates with superior efficiency and profit momentum in their respective markets.
Seagate Technology Holdings plc Analysis
Seagate’s revenue dipped overall but surged 39% in the latest year to $9.1B, while net income soared over 300% to $1.47B. Its gross margin stands at a healthy 35%, reflecting solid cost control despite sector challenges. The 2025 fiscal year shows sharp profit and EPS acceleration, signaling a strong operational rebound.
NetApp, Inc. Analysis
NetApp’s revenue steadily grew 14% over five years, reaching $6.57B in 2025, with net income climbing 62% to $1.19B. The company boasts a robust 70% gross margin and a 22% EBIT margin, underscoring high profitability and operational leverage. Recent growth is moderate but consistent, highlighting stable margin expansion and disciplined expense management.
Margin Strength vs. Growth Trajectory
Seagate impresses with explosive recent profit growth and improving margins after a volatile period, while NetApp delivers steady, high-margin profitability with moderate top-line gains. Seagate leads in momentum and margin recovery, but NetApp offers durable earnings quality and margin dominance. Investors seeking dynamic turnaround potential may prefer Seagate; those favoring consistent margin excellence might lean toward NetApp.
Financial Ratios Comparison
These vital ratios act as a diagnostic tool to expose the underlying fiscal health, valuation premiums, and capital efficiency of the companies compared below:
| Ratios | Seagate Technology Holdings plc (STX) | NetApp, Inc. (NTAP) |
|---|---|---|
| ROE | -3.24% (2025) | 1.14% (2025) |
| ROIC | 33.76% (2025) | 16.49% (2025) |
| P/E | 20.41 (2025) | 15.44 (2025) |
| P/B | -66.19 (2025) | 17.60 (2025) |
| Current Ratio | 1.38 (2025) | 1.26 (2025) |
| Quick Ratio | 0.84 (2025) | 1.22 (2025) |
| D/E | -11.86 (2025) | 3.36 (2025) |
| Debt-to-Assets | 67.0% (2025) | 32.3% (2025) |
| Interest Coverage | 5.89 (2025) | 20.89 (2025) |
| Asset Turnover | 1.13 (2025) | 0.61 (2025) |
| Fixed Asset Turnover | 5.49 (2025) | 8.17 (2025) |
| Payout ratio | 40.8% (2025) | 35.8% (2025) |
| Dividend yield | 2.00% (2025) | 2.32% (2025) |
| Fiscal Year | 2025 | 2025 |
Efficiency & Valuation Duel: The Vital Signs
Ratios act as a company’s DNA, exposing hidden risks and operational excellence that shape long-term investor outcomes.
Seagate Technology Holdings plc
Seagate shows strong operational efficiency with a favorable 16.15% net margin and an impressive 33.76% ROIC well above its 11.23% WACC. Despite a negative ROE, the stock trades at a neutral 20.41 P/E, reflecting balanced valuation. A 2.0% dividend yield supports shareholder returns amid strategic reinvestments in R&D.
NetApp, Inc.
NetApp posts a higher net margin of 18.05% and a robust 114.04% ROE, signaling excellent profitability. Its 16.49% ROIC exceeds the 9.33% WACC, showing capital efficiency. Valuation appears reasonable with a 15.44 P/E. The 2.32% dividend yield complements stable cash flow, underpinned by focused R&D spending and operational discipline.
Valuation Balance vs. Profitability Strength
Seagate delivers superior capital returns and operational efficiency but faces challenges with negative ROE and higher debt. NetApp offers stronger profitability metrics and a healthier balance sheet at a slightly lower valuation. Investors prioritizing capital returns may prefer Seagate; those favoring profitability and financial stability might lean toward NetApp.
Which one offers the Superior Shareholder Reward?
I observe that Seagate (STX) delivers a higher dividend yield near 2.7% in 2025 with a payout ratio around 41%, backed by reasonable free cash flow coverage. NetApp (NTAP) offers a slightly lower yield around 2.3%, with a similar payout ratio but stronger free cash flow conversion near 89%. Both companies run active buyback programs, yet STX’s buyback intensity appears more volatile historically. NTAP’s reinvestment focuses heavily on R&D, supporting sustained operating margins above 20%, while STX shows margin recovery but with greater debt leverage. Given NTAP’s superior cash flow sustainability, modest leverage, and consistent operational profitability, I find NetApp’s distribution approach more durable. For 2026 total return, I favor NTAP for blending steady dividends with robust growth reinvestment and disciplined buybacks.
Comparative Score Analysis: The Strategic Profile
The radar chart reveals the fundamental DNA and trade-offs of Seagate Technology and NetApp, illustrating their core financial strengths and vulnerabilities:
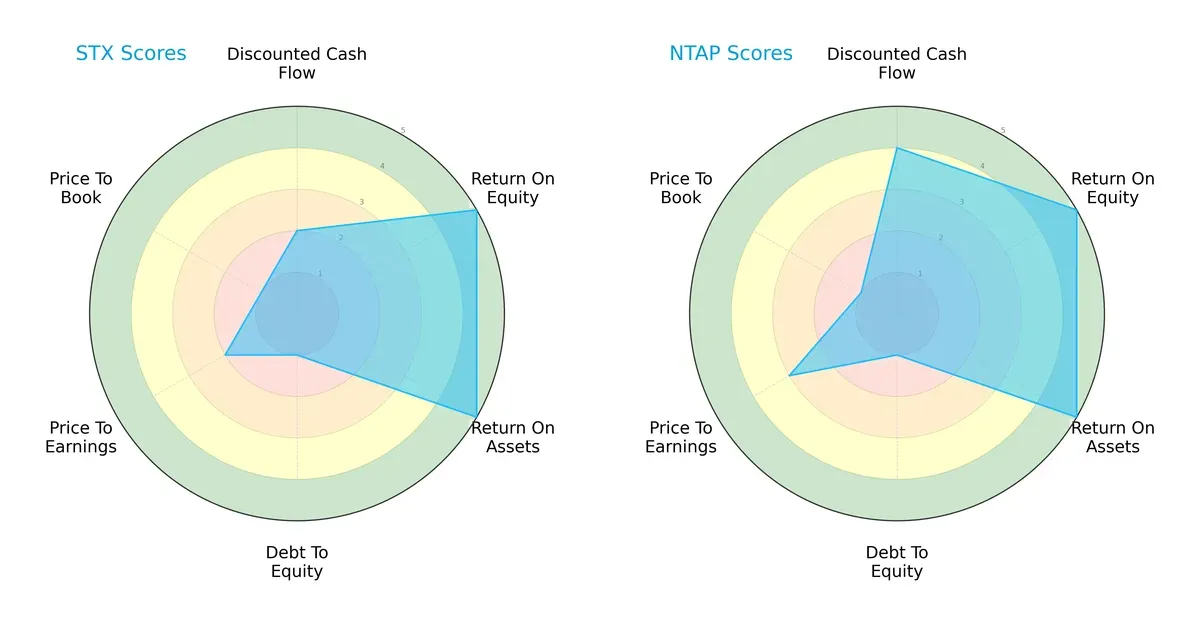
Seagate and NetApp both excel in return on equity and assets with top scores of 5, signaling efficient profitability and asset use. NetApp edges Seagate in discounted cash flow (4 vs. 2), indicating a more favorable valuation based on future cash flows. Both struggle with debt-to-equity and price-to-book ratios, scoring very low at 1, highlighting balance sheet leverage risks and possible overvaluation concerns. Overall, NetApp presents a more balanced profile with a stronger cash flow outlook, while Seagate relies heavily on operational efficiency despite financial leverage weaknesses.
Bankruptcy Risk: Solvency Showdown
Seagate’s Altman Z-Score of 7.29 places it firmly in the safe zone, while NetApp’s 2.68 falls into the grey zone, implying increased bankruptcy risk:
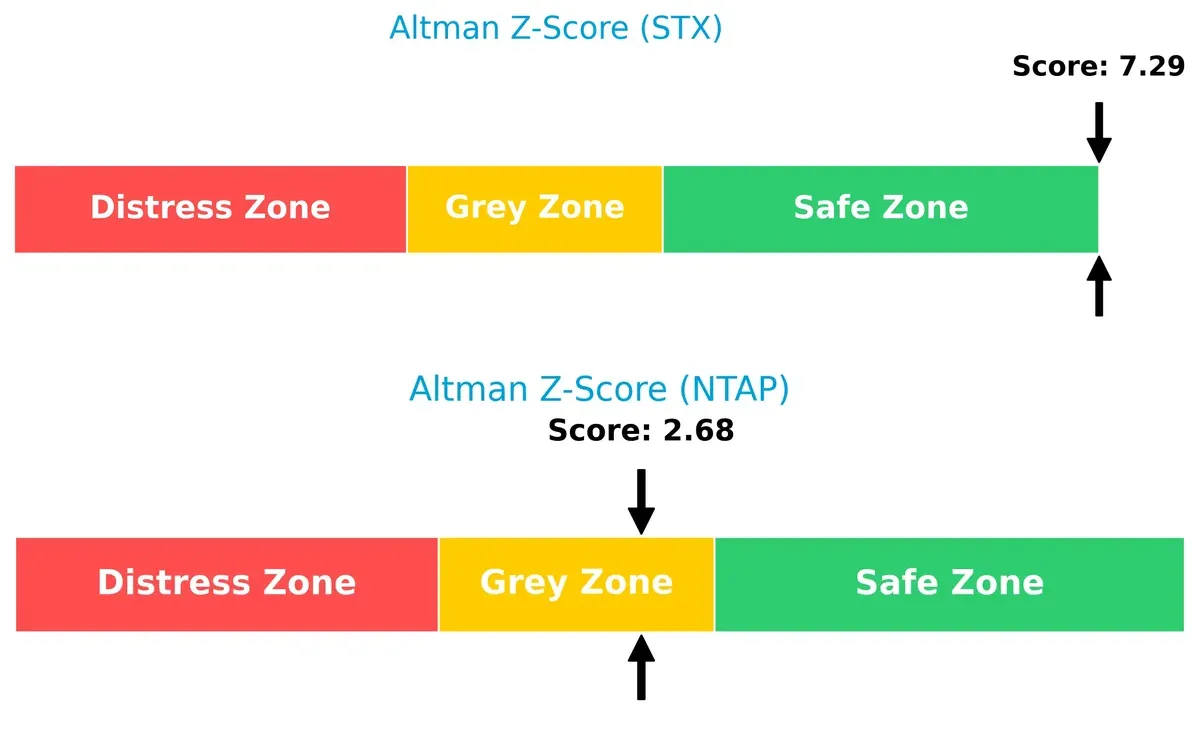
Seagate’s robust solvency signals strong long-term survival prospects amid market volatility. NetApp’s score near the distress threshold demands cautious monitoring due to elevated financial risk in this cycle.
Financial Health: Quality of Operations
Both companies share a Piotroski F-Score of 7, indicating strong internal financial health and operational quality:
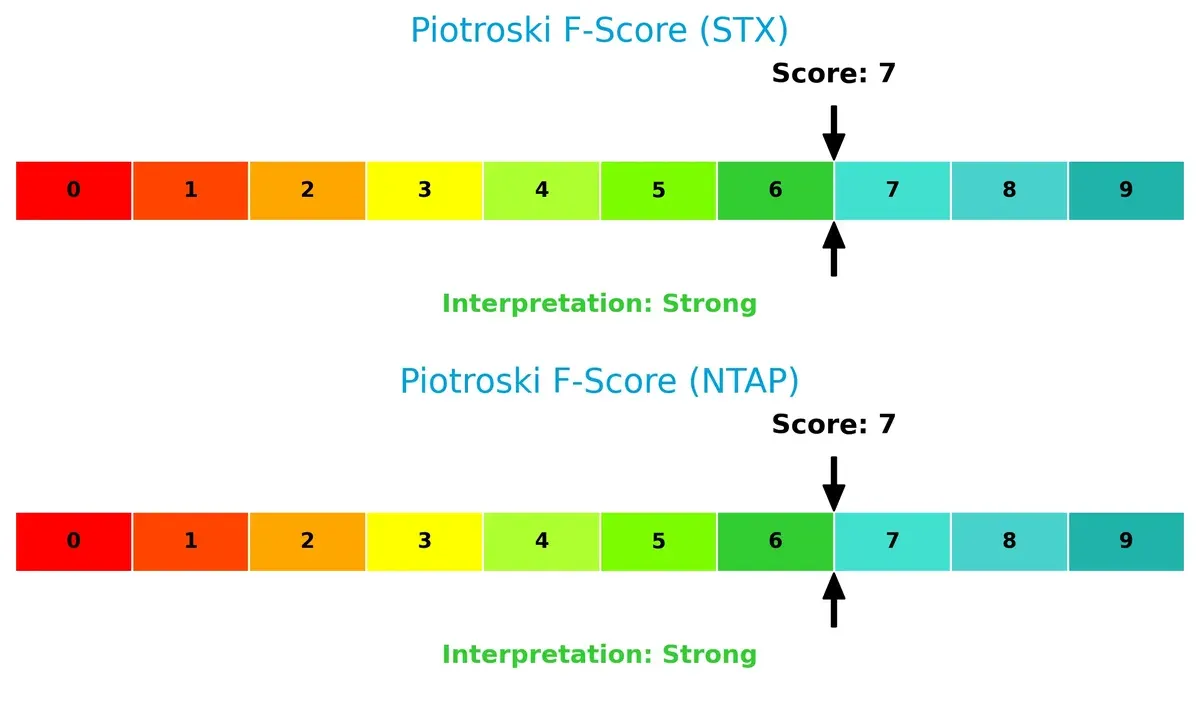
Scores in this range reflect solid profitability, liquidity, and efficiency metrics for both firms. Neither shows immediate red flags, but ongoing vigilance remains essential to sustain these standards.
How are the two companies positioned?
This section dissects the operational DNA of STX and NTAP by comparing their revenue distribution and internal dynamics. The goal: confront their economic moats to identify which model offers the most resilient competitive advantage today.
Revenue Segmentation: The Strategic Mix
This visual comparison dissects how Seagate Technology Holdings plc and NetApp, Inc. diversify their income streams and where their primary sector bets lie:
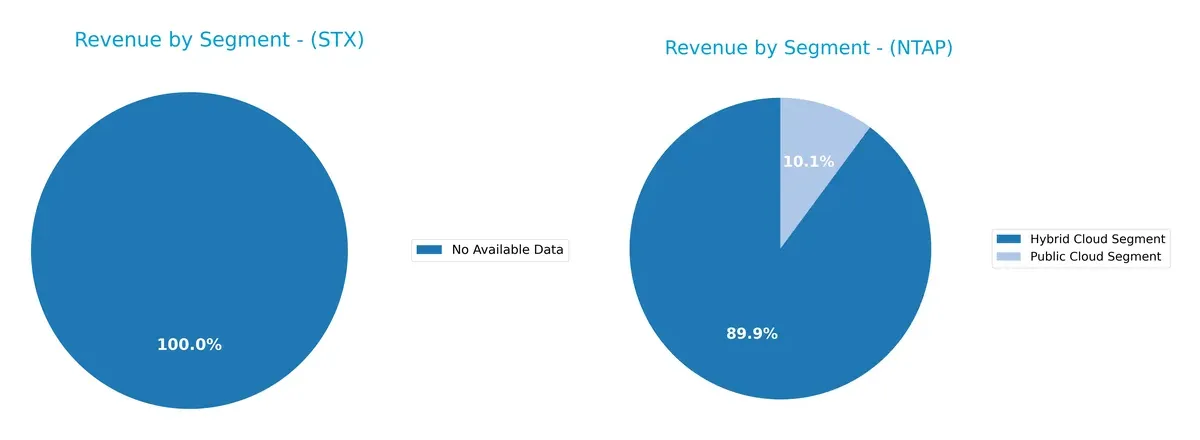
Seagate Technology lacks segment data, preventing segmentation insight. NetApp pivots heavily on its Hybrid Cloud Segment, generating $5.9B in 2025, dwarfing its $665M Public Cloud revenue. This concentration signals strong ecosystem lock-in in cloud services but poses concentration risk. NetApp’s focus contrasts with Seagate’s unknown mix, highlighting NetApp’s strategic bet on hybrid infrastructure dominance.
Strengths and Weaknesses Comparison
This table compares the strengths and weaknesses of Seagate Technology Holdings plc (STX) and NetApp, Inc. (NTAP):
STX Strengths
- Strong net margin at 16.15%
- High ROIC at 33.76%, well above WACC
- Favorable interest coverage at 5.71x
- Efficient asset and fixed asset turnover
- Favorable dividend yield at 2.0%
- Broad global presence including US, Singapore, Netherlands
NTAP Strengths
- Higher net margin at 18.05%
- Strong ROE at 114.04%, positive capital returns
- Favorable quick ratio at 1.22
- High interest coverage at 22.61x
- Strong fixed asset turnover at 8.17x
- Diversified revenues from Hybrid and Public Cloud segments
STX Weaknesses
- Negative ROE at -324.28%, signaling equity losses
- High debt-to-assets ratio at 66.97%
- Unfavorable WACC at 11.23%
- Negative price-to-book ratio (-66.19)
- Neutral liquidity ratios, quick ratio below 1
NTAP Weaknesses
- Unfavorable price-to-book ratio at 17.6
- Moderate debt-to-equity at 3.36
- Neutral WACC at 9.33%
- Asset turnover relatively low at 0.61
- Neutral current ratio at 1.26
Both companies show strong profitability but diverge on capital structure and liquidity. STX has higher capital efficiency but carries more leverage risk. NTAP benefits from diversified cloud revenues and stronger equity returns, though with some valuation concerns. These contrasts influence each company’s strategic priorities in balancing growth and financial stability.
The Moat Duel: Analyzing Competitive Defensibility
A structural moat is the only reliable shield protecting long-term profits from relentless competition erosion. Let’s dissect how these two tech firms defend their turf:
Seagate Technology Holdings plc: Cost Advantage and Scale Efficiency
Seagate’s moat centers on cost advantage driven by scale in mass capacity storage. Its 22.5% ROIC exceeds WACC by a wide margin, reflecting efficient capital use and margin stability. New Lyve edge-to-cloud platforms could deepen this moat in 2026, but rapid tech shifts remain a risk.
NetApp, Inc.: Intangible Assets and Software Ecosystem
NetApp leverages strong intangible assets through its data management software ecosystem, contrasting Seagate’s hardware focus. Its 7.2% ROIC above WACC shows solid value creation, supported by high gross margins (70%). Continued cloud services expansion offers growth but faces stiff cloud-native competition.
Cost Leadership vs. Software Ecosystem: The Moat Face-Off
Seagate’s deeper moat stems from a stronger ROIC premium and scale-driven cost leadership. NetApp’s intangible asset moat is durable but narrower. I see Seagate better positioned to defend market share amid evolving storage demands.
Which stock offers better returns?
The past year featured stark contrasts in price movement and trading behavior between Seagate Technology Holdings plc and NetApp, Inc., highlighting divergent investor sentiment and momentum.
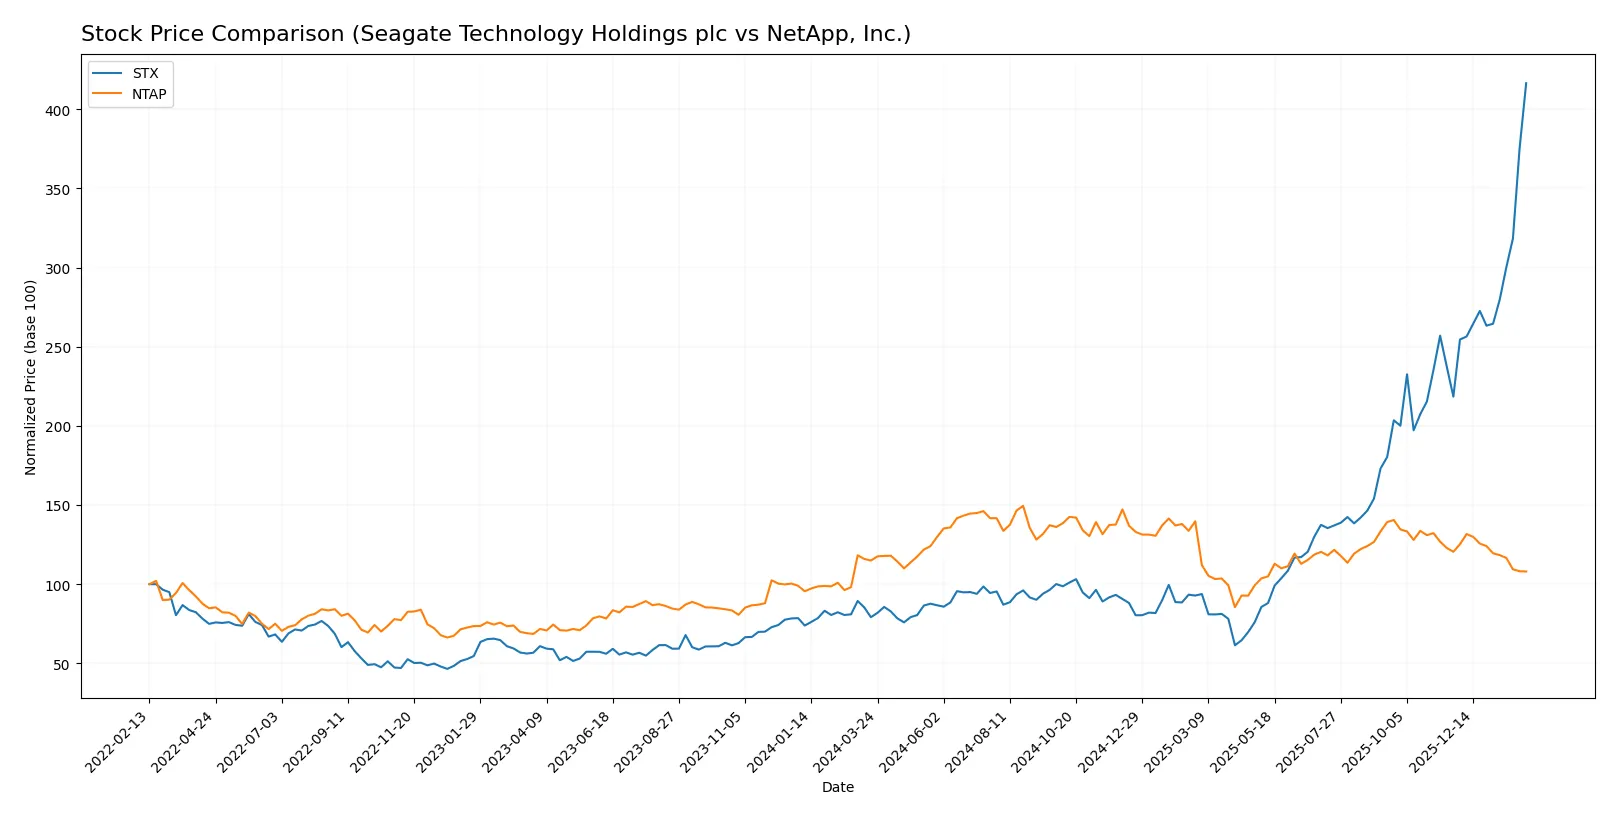
Trend Comparison
Seagate Technology Holdings plc shows a strong bullish trend over the past 12 months with a 426.39% price increase, accelerating momentum, and a high volatility level (std dev 79.92). The stock reached a peak of 452.75.
NetApp, Inc. displays a bearish trend over the same period with a 6.03% price decline, decelerating momentum, and much lower volatility (std dev 12.22). The price fell from a high of 133.12 to a low of 76.1.
Seagate outperformed NetApp significantly, delivering the highest market returns and stronger recent buyer dominance, reflecting superior momentum and investor confidence.
Target Prices
Analysts present a moderately bullish consensus for both Seagate Technology Holdings plc and NetApp, Inc.
| Company | Target Low | Target High | Consensus |
|---|---|---|---|
| Seagate Technology Holdings plc | 270 | 505 | 407.2 |
| NetApp, Inc. | 89 | 137 | 120.5 |
Seagate’s consensus target of 407.2 sits below its current price of 448.55, suggesting limited upside or potential downside risk. NetApp’s consensus target of 120.5 implies a roughly 25% upside from its current 96.74, indicating stronger analyst confidence.

Don’t Let Luck Decide Your Entry Point
Optimize your entry points with our advanced ProRealTime indicators. You’ll get efficient buy signals with precise price targets for maximum performance. Start outperforming now!
How do institutions grade them?
This section compares the recent institutional grades for Seagate Technology Holdings plc and NetApp, Inc.:
Seagate Technology Holdings plc Grades
The following table summarizes recent grades from major financial institutions for Seagate Technology:
| Grading Company | Action | New Grade | Date |
|---|---|---|---|
| Baird | Maintain | Outperform | 2026-01-29 |
| Citigroup | Maintain | Buy | 2026-01-29 |
| Cantor Fitzgerald | Maintain | Overweight | 2026-01-28 |
| Mizuho | Maintain | Outperform | 2026-01-28 |
| Goldman Sachs | Maintain | Buy | 2026-01-28 |
| Barclays | Maintain | Equal Weight | 2026-01-28 |
| Wells Fargo | Maintain | Equal Weight | 2026-01-28 |
| UBS | Maintain | Neutral | 2026-01-28 |
| Rosenblatt | Maintain | Buy | 2026-01-28 |
| Mizuho | Maintain | Outperform | 2026-01-27 |
NetApp, Inc. Grades
This table presents recent grades from recognized financial institutions for NetApp:
| Grading Company | Action | New Grade | Date |
|---|---|---|---|
| Morgan Stanley | Downgrade | Underweight | 2026-01-20 |
| Northland Capital Markets | Upgrade | Outperform | 2025-11-26 |
| UBS | Maintain | Neutral | 2025-11-26 |
| Barclays | Maintain | Overweight | 2025-11-26 |
| Wells Fargo | Maintain | Equal Weight | 2025-11-26 |
| B of A Securities | Maintain | Neutral | 2025-11-26 |
| Citigroup | Maintain | Neutral | 2025-11-12 |
| Citigroup | Maintain | Neutral | 2025-10-16 |
| Argus Research | Maintain | Buy | 2025-08-29 |
| Barclays | Maintain | Overweight | 2025-08-28 |
Which company has the best grades?
Seagate Technology consistently receives higher grades including multiple “Outperform” and “Buy” ratings from top-tier firms. NetApp shows a mixed picture with recent downgrades and mostly neutral or overweight ratings. Investors might perceive Seagate as having stronger institutional support, potentially influencing confidence and stock demand.
Risks specific to each company
The following categories identify the critical pressure points and systemic threats facing both firms in the 2026 market environment:
1. Market & Competition
Seagate Technology Holdings plc
- Faces intense competition in storage hardware, pressured by cloud adoption and SSD transitions.
NetApp, Inc.
- Competes in hybrid and public cloud data management, challenged by rapid cloud innovation and software disruptors.
2. Capital Structure & Debt
Seagate Technology Holdings plc
- High debt-to-assets (67%) signals financial leverage risk despite favorable interest coverage.
NetApp, Inc.
- Moderate debt levels with 32% debt-to-assets, maintaining healthier financial flexibility.
3. Stock Volatility
Seagate Technology Holdings plc
- Elevated beta at 1.64 indicates higher stock price volatility relative to the market.
NetApp, Inc.
- Lower beta of 1.39 reflects comparably less stock price fluctuation.
4. Regulatory & Legal
Seagate Technology Holdings plc
- Exposure to global data privacy laws and trade restrictions due to multinational footprint.
NetApp, Inc.
- Regulatory risk primarily from data sovereignty and cloud compliance standards in US and global markets.
5. Supply Chain & Operations
Seagate Technology Holdings plc
- Supply chain vulnerable to semiconductor shortages and geopolitical tensions in Asia.
NetApp, Inc.
- Relies on third-party cloud infrastructure partners, facing operational risks tied to service uptime and integration.
6. ESG & Climate Transition
Seagate Technology Holdings plc
- Faces pressure to reduce carbon footprint in manufacturing and data center energy use.
NetApp, Inc.
- ESG focus on sustainable cloud solutions and data center efficiency improvements.
7. Geopolitical Exposure
Seagate Technology Holdings plc
- Significant exposure to EU and Asia-Pacific regulatory changes and trade conflicts.
NetApp, Inc.
- Primarily US-based but dependent on global cloud partners, sensitive to US-China tech tensions.
Which company shows a better risk-adjusted profile?
Seagate’s highest risk is its elevated leverage, which strains financial flexibility despite strong operating metrics. NetApp’s most impactful risk is competitive pressure in a fast-evolving cloud market. Overall, NetApp’s lower debt and more stable stock volatility grant it a superior risk-adjusted profile. Notably, Seagate’s debt-to-assets ratio near 67% raises caution amid macroeconomic uncertainty.
Final Verdict: Which stock to choose?
Seagate Technology Holdings (STX) stands out for its robust capital efficiency and a powerful ability to generate returns well above its cost of capital. Its superpower lies in creating value through disciplined capital allocation and operational leverage. A point of vigilance remains its elevated debt levels, which could pressure financial flexibility. STX suits portfolios focused on aggressive growth with tolerance for leverage risk.
NetApp, Inc. (NTAP) boasts a strategic moat in its recurring revenue streams and cloud storage solutions, delivering steady profitability and superior interest coverage. Compared to STX, NTAP offers a more conservative financial profile with manageable debt and consistent cash flow. It fits well within GARP (Growth at a Reasonable Price) portfolios seeking a balance of growth and stability.
If you prioritize high-return growth fueled by operational excellence and can accept leverage risk, STX outshines as the compelling choice with its superior ROIC trajectory. However, if you seek safer income streams with a durable moat and better financial stability, NTAP offers better risk-adjusted stability despite a more modest growth pace. Both scenarios reflect disciplined investment approaches aligned with distinct investor avatars.
Disclaimer: Investment carries a risk of loss of initial capital. The past performance is not a reliable indicator of future results. Be sure to understand risks before making an investment decision.
Go Further
I encourage you to read the complete analyses of Seagate Technology Holdings plc and NetApp, Inc. to enhance your investment decisions: