In the rapidly evolving technology sector, NetApp, Inc. and Rigetti Computing, Inc. stand out as pioneers in data and computing solutions. NetApp excels in cloud-led data management and storage infrastructure, while Rigetti focuses on cutting-edge quantum computing systems. Both companies share the computer hardware industry but represent distinct innovation strategies and growth potentials. This article will help you assess which company offers the most compelling investment opportunity in 2026.
Table of contents
Companies Overview
I will begin the comparison between NetApp and Rigetti Computing by providing an overview of these two companies and their main differences.
NetApp Overview
NetApp, Inc. is a technology company specializing in cloud-led and data-centric services to manage and share data across on-premises, private, and public clouds worldwide. It offers intelligent data management software and storage infrastructure solutions, serving industries such as energy, financial services, healthcare, and telecommunications. Headquartered in San Jose, California, NetApp operates with a sizable workforce of 11,800 employees and was founded in 1992.
Rigetti Computing Overview
Rigetti Computing, Inc. is a technology company focused on building quantum computers and superconducting quantum processors. Founded in 2013 and based in Berkeley, California, Rigetti integrates its machines into various cloud environments through its Quantum Cloud Services platform. The company operates with a much smaller team of 137 employees and is considered an integrated systems company within the computer hardware industry.
Key similarities and differences
Both companies operate in the technology sector and computer hardware industry, serving cloud-related markets. However, NetApp focuses on data management and storage solutions for a broad range of industries with well-established products and services, while Rigetti specializes in quantum computing hardware and cloud integration with a niche technological focus. NetApp’s scale and employee count far exceed Rigetti’s, reflecting different stages of company maturity and market reach.
Income Statement Comparison
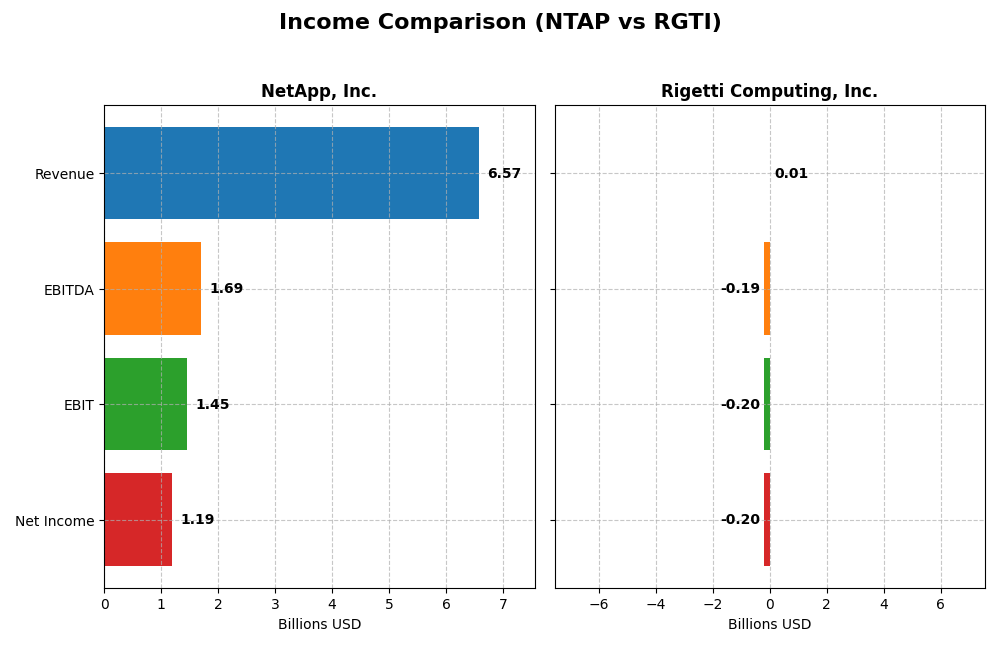
This table presents a side-by-side comparison of the most recent fiscal year income statement metrics for NetApp, Inc. and Rigetti Computing, Inc., illustrating their financial performance.
| Metric | NetApp, Inc. (NTAP) | Rigetti Computing, Inc. (RGTI) |
|---|---|---|
| Market Cap | 21.4B | 8.1B |
| Revenue | 6.57B | 10.8M |
| EBITDA | 1.69B | -191M |
| EBIT | 1.45B | -198M |
| Net Income | 1.19B | -201M |
| EPS | 5.81 | -1.09 |
| Fiscal Year | 2025 | 2024 |
Income Statement Interpretations
NetApp, Inc.
NetApp’s revenue steadily increased from $5.74B in 2021 to $6.57B in 2025, reflecting a 14.42% growth over the period. Net income showed strong growth, rising from $730M to $1.19B, a 62.47% increase. Margins remained favorable, with a gross margin above 70% and net margin improving to 18.05%. The latest year showed moderate revenue growth of 4.85%, with notable margin and EPS improvements.
Rigetti Computing, Inc.
Rigetti’s revenue peaked at $13.1M in 2022 but declined to $10.8M in 2024, a 10.14% drop in the most recent year. Net income remained negative and worsened substantially, from -$17.2M in 2020 to -$201M in 2024. Margins are unfavorable, with a negative EBIT and net margin exceeding -1800%. The latest year saw deteriorating profitability and shrinking margins despite some overall revenue growth over the longer term.
Which one has the stronger fundamentals?
NetApp presents stronger fundamentals with favorable gross, EBIT, and net margins, along with consistent revenue and net income growth. In contrast, Rigetti struggles with persistent losses, unfavorable margins, and declining recent revenue. The income statement evaluations favor NetApp’s stable profitability and margin improvements, while Rigetti faces significant operational and financial challenges reflected in its income trends.
Financial Ratios Comparison
The table below presents a side-by-side comparison of key financial ratios for NetApp, Inc. (NTAP) and Rigetti Computing, Inc. (RGTI) based on their most recent fiscal year data.
| Ratios | NetApp, Inc. (NTAP) FY 2025 | Rigetti Computing, Inc. (RGTI) FY 2024 |
|---|---|---|
| ROE | 114.0% | -158.8% |
| ROIC | 16.5% | -24.9% |
| P/E | 15.4 | -14.0 |
| P/B | 17.6 | 22.3 |
| Current Ratio | 1.26 | 17.42 |
| Quick Ratio | 1.22 | 17.42 |
| D/E (Debt-to-Equity) | 3.36 | 0.07 |
| Debt-to-Assets | 32.3% | 3.1% |
| Interest Coverage | 20.9 | -21.0 |
| Asset Turnover | 0.61 | 0.04 |
| Fixed Asset Turnover | 8.17 | 0.20 |
| Payout ratio | 35.8% | 0% |
| Dividend yield | 2.32% | 0% |
Interpretation of the Ratios
NetApp, Inc.
NetApp’s ratios present a slightly favorable profile, with strong net margin at 18.05% and an exceptional return on equity of 114.04%, reflecting efficient profitability. However, its price-to-book ratio of 17.6 and debt-to-equity of 3.36 raise concerns about valuation and leverage. The company pays dividends with a 2.32% yield, supported by sustainable free cash flow and no signs of excessive payout risks.
Rigetti Computing, Inc.
Rigetti’s financial ratios are largely unfavorable, marked by a negative net margin of -1862.72% and a heavily negative return on equity at -158.77%, indicating significant losses. The firm carries minimal debt and a very high current ratio, reflecting liquidity but possibly idle resources. It does not pay dividends, consistent with its negative earnings and focus on R&D during this growth phase.
Which one has the best ratios?
Based on the evaluations, NetApp demonstrates stronger and more balanced financial metrics, with favorable profitability and dividend sustainability. Rigetti’s ratios reflect considerable financial distress and ongoing investment with no current returns to shareholders. Therefore, NetApp has the best ratios between the two companies.
Strategic Positioning
This section compares the strategic positioning of NetApp and Rigetti Computing, including market position, key segments, and exposure to technological disruption:
NetApp, Inc.
- Established market presence with 21B market cap and moderate competitive pressure in computer hardware.
- Focuses on hybrid cloud and public cloud data management services, driving revenues above 6.5B in 2025.
- Operates in a mature technology space with incremental innovation in cloud data management software and storage.
Rigetti Computing, Inc.
- Smaller market cap of 8B with high beta, facing intense competition in quantum computing hardware.
- Concentrated on quantum computer systems and cloud integration with limited revenue primarily from access services.
- Positioned in a disruptive quantum computing field with potential high technological shifts and innovation.
NetApp vs Rigetti Computing Positioning
NetApp pursues a diversified strategy across hybrid and public cloud services in a mature market, offering scale advantages but facing moderate competitive pressure. Rigetti is concentrated in quantum computing, a nascent sector with high innovation potential but smaller scale and revenue base.
Which has the best competitive advantage?
NetApp shows a very favorable moat with ROIC well above WACC and increasing profitability, indicating durable competitive advantage. Rigetti has a slightly unfavorable moat, currently shedding value despite improving ROIC trends, reflecting higher risk and less established advantage.
Stock Comparison
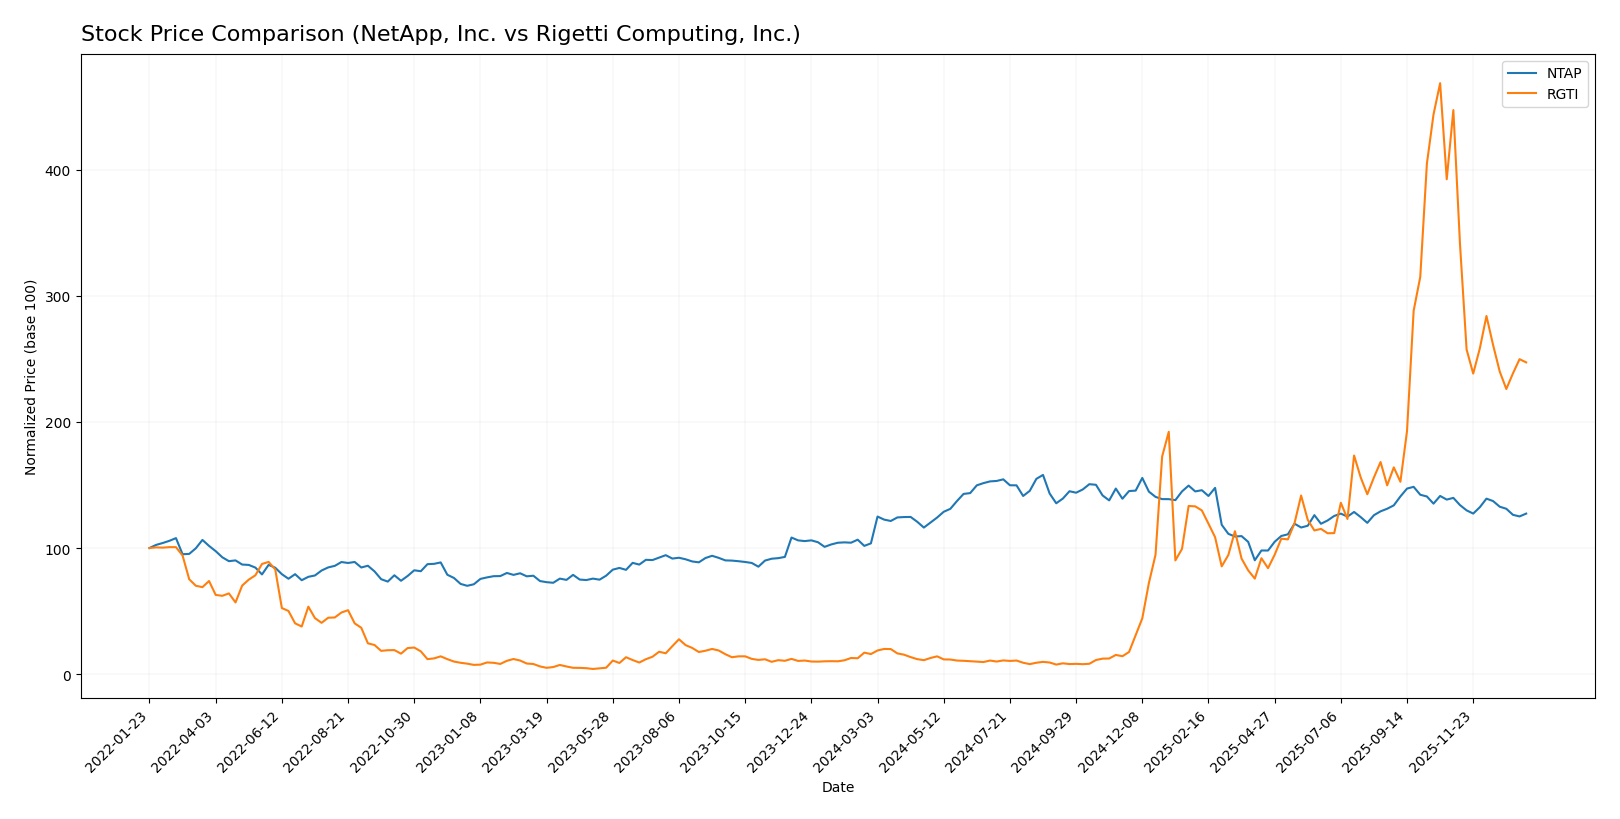
The stock prices of NetApp, Inc. (NTAP) and Rigetti Computing, Inc. (RGTI) have demonstrated significant upward momentum over the past 12 months, with both showing decelerating bullish trends despite recent downward corrections.
Trend Analysis
NetApp, Inc. (NTAP) exhibited a bullish trend over the past year with a 22.75% price increase, though the trend is decelerating. The stock reached a high of 133.12 and a low of 76.1, with a standard deviation of 12.21 indicating moderate volatility.
Rigetti Computing, Inc. (RGTI) posted a strong bullish trend with a 1448.73% price increase over the past 12 months, also decelerating. It recorded a high of 46.38 and a low of 0.75, with volatility slightly lower at 11.24 standard deviation.
Comparing the two, RGTI delivered substantially higher market performance than NTAP over the past year, despite both experiencing decelerating bullish trends and recent declines.
Target Prices
The current analyst consensus indicates optimistic target prices for both companies.
| Company | Target High | Target Low | Consensus |
|---|---|---|---|
| NetApp, Inc. | 137 | 115 | 125.17 |
| Rigetti Computing, Inc. | 50 | 18 | 35.83 |
Analysts expect NetApp’s stock to rise from $107.28 to around $125, suggesting moderate upside potential. Rigetti’s consensus target of $35.83 also indicates significant growth from its $24.47 current price.
Analyst Opinions Comparison
This section compares analysts’ ratings and grades for NetApp, Inc. and Rigetti Computing, Inc.:
Rating Comparison
NetApp, Inc. Rating
- Rating: B+, considered very favorable by analysts.
- Discounted Cash Flow Score: 4, favorable valuation score.
- ROE Score: 5, very favorable efficiency in equity use.
- ROA Score: 5, very favorable asset utilization.
- Debt To Equity Score: 1, very unfavorable financial risk.
- Overall Score: 3, moderate overall financial standing.
Rigetti Computing, Inc. Rating
- Rating: C, considered very unfavorable by analysts.
- Discounted Cash Flow Score: 1, very unfavorable valuation.
- ROE Score: 1, very unfavorable equity efficiency.
- ROA Score: 1, very unfavorable asset utilization.
- Debt To Equity Score: 4, favorable financial stability.
- Overall Score: 2, moderate overall financial standing.
Which one is the best rated?
Based strictly on the provided data, NetApp, Inc. holds a higher rating (B+) and better scores in discounted cash flow, ROE, and ROA. Rigetti Computing, Inc. scores better only in debt-to-equity, but overall is less favorably rated.
Scores Comparison
Here is a comparison of the financial health scores for NetApp, Inc. and Rigetti Computing, Inc.:
NetApp Scores
- Altman Z-Score: 2.86, indicating moderate bankruptcy risk in the grey zone.
- Piotroski Score: 7, reflecting strong financial health.
Rigetti Scores
- Altman Z-Score: 101.71, well within the safe zone, very low bankruptcy risk.
- Piotroski Score: 2, indicating very weak financial strength.
Which company has the best scores?
Based strictly on the provided data, Rigetti exhibits a much stronger Altman Z-Score indicating financial safety, while NetApp has a considerably higher Piotroski Score reflecting better financial strength. The strengths of the companies differ depending on the score analyzed.
Grades Comparison
Here is a detailed comparison of the recent grades assigned to NetApp, Inc. and Rigetti Computing, Inc.:
NetApp, Inc. Grades
The following table summarizes recent analyst grades from well-known financial institutions for NetApp, Inc.:
| Grading Company | Action | New Grade | Date |
|---|---|---|---|
| Barclays | Maintain | Overweight | 2025-11-26 |
| Wells Fargo | Maintain | Equal Weight | 2025-11-26 |
| Northland Capital Markets | Upgrade | Outperform | 2025-11-26 |
| B of A Securities | Maintain | Neutral | 2025-11-26 |
| UBS | Maintain | Neutral | 2025-11-26 |
| Citigroup | Maintain | Neutral | 2025-11-12 |
| Citigroup | Maintain | Neutral | 2025-10-16 |
| Argus Research | Maintain | Buy | 2025-08-29 |
| UBS | Maintain | Neutral | 2025-08-28 |
| Barclays | Maintain | Overweight | 2025-08-28 |
NetApp’s grades show a stable outlook, with most analysts maintaining neutral or overweight ratings, alongside a recent upgrade to outperform by Northland Capital Markets.
Rigetti Computing, Inc. Grades
The following table presents recent analyst grades from reputable firms for Rigetti Computing, Inc.:
| Grading Company | Action | New Grade | Date |
|---|---|---|---|
| B. Riley Securities | Maintain | Neutral | 2025-11-12 |
| Benchmark | Maintain | Buy | 2025-11-12 |
| B. Riley Securities | Downgrade | Neutral | 2025-11-03 |
| Benchmark | Maintain | Buy | 2025-10-07 |
| B. Riley Securities | Maintain | Buy | 2025-09-22 |
| Benchmark | Maintain | Buy | 2025-08-13 |
| Needham | Maintain | Buy | 2025-08-04 |
| B. Riley Securities | Maintain | Buy | 2025-07-23 |
| Benchmark | Maintain | Buy | 2025-05-15 |
| Needham | Maintain | Buy | 2025-05-14 |
Rigetti’s ratings predominantly consist of buy recommendations with a recent slight downgrade to neutral by B. Riley Securities, indicating some cautious sentiment.
Which company has the best grades?
Comparing both companies, Rigetti Computing, Inc. has a stronger buy consensus, whereas NetApp, Inc. mostly receives hold or neutral ratings with some overweight and outperform views. This difference suggests Rigetti’s grades reflect greater growth expectations, while NetApp’s grades imply steadier, more cautious investor outlooks.
Strengths and Weaknesses
Below is a comparative overview of key strengths and weaknesses for NetApp, Inc. (NTAP) and Rigetti Computing, Inc. (RGTI) based on the most recent financial and operational data.
| Criterion | NetApp, Inc. (NTAP) | Rigetti Computing, Inc. (RGTI) |
|---|---|---|
| Diversification | Strong product and service mix, with dominant Hybrid Cloud revenues (5.9B in 2025) plus Public Cloud and maintenance contracts | Limited revenue streams, primarily from quantum computing access services (356K in 2024) |
| Profitability | Solid profitability: net margin 18.05%, ROIC 16.49%, ROE 114% (2025) | Negative profitability with large net loss margins (-1862.7%), negative ROIC (-24.9%) |
| Innovation | Steady investment in hybrid and public cloud solutions, maintaining competitiveness | Focus on cutting-edge quantum computing technology but not yet profit-generating |
| Global presence | Established global footprint in cloud storage and services | Smaller scale, emerging presence in quantum computing sector |
| Market Share | Significant market share in hybrid cloud storage | Niche player in quantum computing, market share currently minimal |
Key takeaways: NetApp stands out with strong diversification, robust profitability, and a durable competitive advantage supported by growing ROIC. Rigetti, while innovative in quantum computing, faces challenges in profitability and market scale, indicating higher investment risk despite growth potential.
Risk Analysis
Below is a comparison of key risks for NetApp, Inc. (NTAP) and Rigetti Computing, Inc. (RGTI) in 2026.
| Metric | NetApp, Inc. (NTAP) | Rigetti Computing, Inc. (RGTI) |
|---|---|---|
| Market Risk | Beta 1.374, moderate market volatility exposure | Beta 1.713, higher market sensitivity and volatility |
| Debt level | Debt-to-Equity 3.36 (unfavorable), Debt-to-Assets 32.26% (neutral) | Debt-to-Equity 0.07 (favorable), very low debt level |
| Regulatory Risk | Moderate, typical for tech and cloud sectors | Higher, emerging quantum tech faces evolving regulations |
| Operational Risk | Established operations with 11.8K employees, operational scale reduces risk | Smaller scale (137 employees), higher execution risk |
| Environmental Risk | Moderate, data centers have energy demands but improving efficiency | Moderate, quantum computing energy impact less known |
| Geopolitical Risk | US-based, global cloud exposure, moderate geopolitical sensitivity | US-based, niche tech, potential export controls impact |
NetApp’s main risks are elevated debt levels and moderate market/geopolitical exposure. Rigetti faces high operational and regulatory risks due to its early-stage quantum computing focus and volatile market behavior. Investors should weigh Rigetti’s innovation potential against its financial fragility and higher risk profile.
Which Stock to Choose?
NetApp, Inc. (NTAP) shows a favorable income evolution with consistent revenue and net income growth over 2021-2025. Its financial ratios are slightly favorable overall, with strong profitability indicators like an 18.05% net margin and a 114.04% ROE. Despite some unfavorable debt metrics, its rating is very favorable (B+), supported by a very favorable moat evaluation indicating durable competitive advantage.
Rigetti Computing, Inc. (RGTI) exhibits an unfavorable income trend marked by large negative margins and net losses in recent years despite overall revenue growth. Most financial ratios are unfavorable, reflecting poor profitability and operational efficiency. Though it has low debt levels and a favorable debt-to-equity ratio, its rating is very unfavorable (C), with a slightly unfavorable moat evaluation signaling value destruction but improving profitability.
For investors emphasizing stable profitability and competitive strength, NetApp might appear more favorable given its strong income statement and financial ratios alongside a solid rating and moat. Conversely, those with a high risk tolerance seeking growth potential in emerging technologies could interpret Rigetti’s improving ROIC trend and significant price appreciation as indicative of speculative opportunity, despite weaker financial fundamentals.
Disclaimer: Investment carries a risk of loss of initial capital. The past performance is not a reliable indicator of future results. Be sure to understand risks before making an investment decision.
Go Further
I encourage you to read the complete analyses of NetApp, Inc. and Rigetti Computing, Inc. to enhance your investment decisions: