In the rapidly evolving technology sector, NetApp, Inc. and Quantum Computing, Inc. represent two distinct yet overlapping players in computer hardware. NetApp leads with established cloud data management solutions, while Quantum Computing pioneers software for emerging quantum technologies. Comparing these companies offers insight into traditional versus cutting-edge innovation strategies. Join me as we explore which firm presents the most compelling investment opportunity in 2026.
Table of contents
Companies Overview
I will begin the comparison between NetApp, Inc. and Quantum Computing, Inc. by providing an overview of these two companies and their main differences.
NetApp Overview
NetApp, Inc. provides cloud-led and data-centric services to manage and share data across on-premises, private, and public clouds worldwide. The company offers intelligent data management software and storage infrastructure solutions, serving diverse sectors including energy, financial services, healthcare, and telecommunications. Headquartered in San Jose, California, NetApp operates with over 11,800 employees and emphasizes cloud and hybrid cloud technologies.
Quantum Computing Overview
Quantum Computing, Inc. specializes in software tools and applications for quantum computers, focusing on enabling developers to create quantum-ready applications on conventional systems. Based in Leesburg, Virginia, the company targets commercial and government clients with its quantum application accelerator and supports multiple quantum processing units. Founded in 2018, Quantum Computing employs 41 people and operates in the emerging quantum computing sector.
Key similarities and differences
Both companies operate in the technology sector within the computer hardware industry, but their business focuses differ markedly. NetApp concentrates on cloud data management and storage infrastructure with a broad market reach, while Quantum Computing targets quantum software development and accelerator tools for niche commercial and government applications. NetApp’s scale and employee count are substantially larger, reflecting more established operations compared to Quantum Computing’s early-stage quantum technology specialization.
Income Statement Comparison
The table below compares key income statement metrics for the most recent fiscal year of NetApp, Inc. and Quantum Computing, Inc., providing a snapshot of their financial performance.

| Metric | NetApp, Inc. (NTAP) | Quantum Computing, Inc. (QUBT) |
|---|---|---|
| Market Cap | 21.4B | 1.6B |
| Revenue | 6.57B | 0.37M |
| EBITDA | 1.69B | -62.2M |
| EBIT | 1.45B | -66.0M |
| Net Income | 1.19B | -68.5M |
| EPS | 5.81 | -0.73 |
| Fiscal Year | 2025 | 2024 |
Income Statement Interpretations
NetApp, Inc.
NetApp demonstrated steady revenue growth from $5.74B in 2021 to $6.57B in 2025, with net income rising from $730M to $1.19B. Margins improved notably, with a gross margin of 70.19% and net margin of 18.05% in 2025. The latest fiscal year showed a 4.85% revenue increase, alongside a 14.72% net margin growth, signaling enhanced profitability.
Quantum Computing, Inc.
Quantum Computing’s revenue remained minimal and volatile, reaching only $373K in 2024, with continuous net losses expanding to -$68.5M. Margins were deeply negative, including a gross margin of -988.2% and net margin of -18,375.87%, reflecting substantial operational inefficiencies. The latest year showed a slight revenue growth of 4.19%, but worsening profitability with net margin and EPS declines.
Which one has the stronger fundamentals?
NetApp’s fundamentals are stronger, supported by consistent revenue and net income growth, favorable margin improvements, and positive operating metrics. In contrast, Quantum Computing faces significant financial challenges with persistent losses and unfavorable margin trends. The disparity highlights NetApp’s more stable and profitable income statement over the analyzed periods.
Financial Ratios Comparison
This table presents a side-by-side comparison of key financial ratios for NetApp, Inc. (NTAP) and Quantum Computing, Inc. (QUBT) based on the most recent fiscal year data available.
| Ratios | NetApp, Inc. (NTAP) 2025 | Quantum Computing, Inc. (QUBT) 2024 |
|---|---|---|
| ROE | 114.0% | -63.9% |
| ROIC | 16.5% | -17.4% |
| P/E | 15.4 | -22.7 |
| P/B | 17.6 | 14.5 |
| Current Ratio | 1.26 | 17.36 |
| Quick Ratio | 1.22 | 17.36 |
| D/E | 3.36 | 0.01 |
| Debt-to-Assets | 32.3% | 0.8% |
| Interest Coverage | 20.9 | -10.4 |
| Asset Turnover | 0.61 | 0.0024 |
| Fixed Asset Turnover | 8.17 | 0.038 |
| Payout ratio | 35.8% | -0.3% |
| Dividend yield | 2.32% | 0.01% |
Interpretation of the Ratios
NetApp, Inc.
NetApp exhibits a generally strong financial profile with favorable net margin (18.05%), ROE (114.04%), and ROIC (16.49%), indicating effective profitability and capital use. Some concerns include an unfavorable price-to-book ratio (17.6) and a high debt-to-equity ratio (3.36). The company pays dividends with a favorable 2.32% yield, supported by solid free cash flow coverage, suggesting sustainable shareholder returns.
Quantum Computing, Inc.
Quantum Computing shows weak financial ratios, marked by highly negative net margin (-18375.87%), ROE (-63.89%), and ROIC (-17.41%), reflecting significant losses and poor capital efficiency. The firm does not pay dividends, likely due to its negative earnings and growth focus. Despite a favorable debt-to-equity ratio (0.01), other ratios like interest coverage and asset turnover are unfavorable, indicating operational challenges.
Which one has the best ratios?
NetApp presents a more balanced and financially sound ratio profile with half of its key ratios favorable and a slightly favorable global opinion. In contrast, Quantum Computing’s ratios are predominantly unfavorable, reflecting financial distress and operational inefficiencies. Thus, NetApp stands out as having the stronger and more consistent financial ratios between the two.
Strategic Positioning
This section compares the strategic positioning of NetApp, Inc. and Quantum Computing, Inc. covering market position, key segments, and exposure to technological disruption:
NetApp, Inc.
- Large market cap of 21.4B facing technology sector competition and NASDAQ Global Select listing.
- Focus on Hybrid Cloud (5.9B revenue) and Public Cloud (665M), offering data management software and storage solutions.
- Operates in established cloud and data infrastructure markets, moderate disruption from evolving cloud technologies.
Quantum Computing, Inc.
- Smaller market cap of 1.6B with high volatility on NASDAQ Capital Market.
- Provides quantum software tools and multiple quantum processing units for commercial and government clients.
- Positioned in emerging quantum computing sector with potential high technological disruption.
NetApp vs Quantum Computing Positioning
NetApp pursues a diversified cloud and data management strategy with significant scale and established markets, while Quantum Computing concentrates on quantum software and hardware with a small workforce and emerging technology focus, reflecting differing risk and growth profiles.
Which has the best competitive advantage?
NetApp demonstrates a very favorable moat with a ROIC exceeding WACC by 7.2%, showing durable competitive advantage, whereas Quantum Computing has a slightly unfavorable moat, shedding value despite improving profitability.
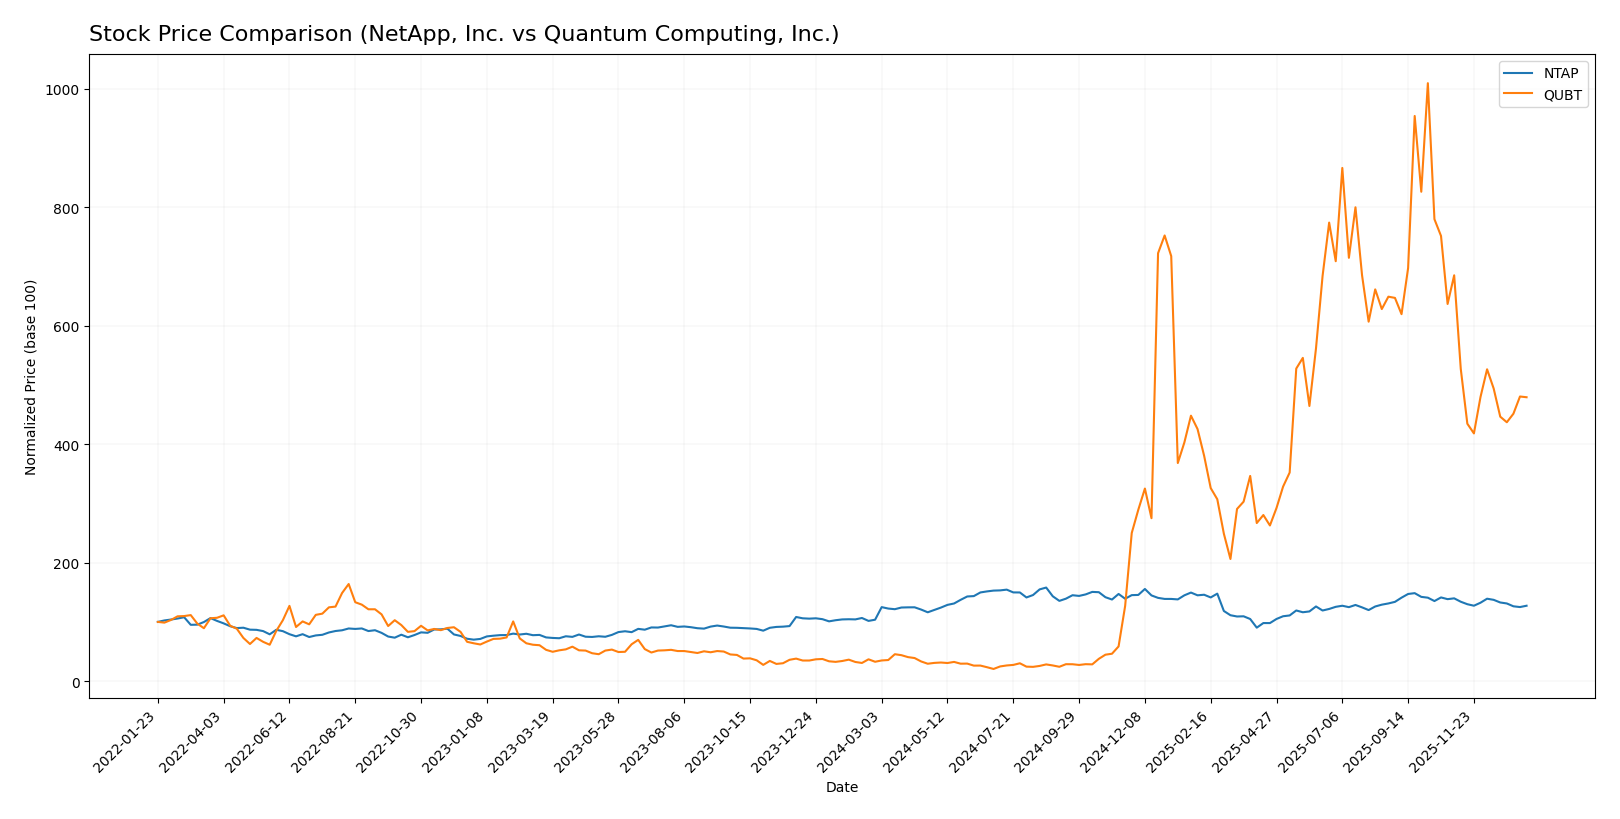
Stock Comparison
The stock price chart highlights significant bullish gains for both NetApp, Inc. and Quantum Computing, Inc. over the past 12 months, with recent periods showing downward corrections and shifts in trading dominance.
Trend Analysis
NetApp, Inc. (NTAP) experienced a 22.75% price increase over the past year, indicating a bullish trend with deceleration. The stock reached a high of 133.12 and a low of 76.1, showing moderate volatility (std deviation 12.21). Recent months show an 8.91% decline.
Quantum Computing, Inc. (QUBT) showed a strong bullish trend with a 1362.9% price increase over 12 months and deceleration in momentum. The stock ranged from 0.5 to 24.62, with lower volatility (std deviation 6.91). Recently, it declined 30.04%.
Comparing both, QUBT delivered the highest market performance with a much larger price increase despite recent corrections, while NTAP showed steadier gains and less extreme volatility.
Target Prices
Analysts present a clear consensus on target prices for NetApp, Inc. and Quantum Computing, Inc.
| Company | Target High | Target Low | Consensus |
|---|---|---|---|
| NetApp, Inc. | 137 | 115 | 125.17 |
| Quantum Computing, Inc. | 40 | 10 | 19.5 |
The target consensus for NetApp, Inc. suggests a potential upside from its current price of 107.28 USD, while Quantum Computing, Inc.’s consensus indicates significant volatility with a wide target range, reflecting higher risk and growth uncertainty.
Analyst Opinions Comparison
This section compares analysts’ ratings and grades for NetApp, Inc. and Quantum Computing, Inc.:
Rating Comparison
NTAP Rating
- Rating: B+ indicating a very favorable assessment of financial standing.
- Discounted Cash Flow Score: 4, a favorable indication of valuation.
- ROE Score: 5, very favorable efficiency in generating profit from equity.
- ROA Score: 5, very favorable asset utilization to generate earnings.
- Debt To Equity Score: 1, very unfavorable, indicating high financial risk.
- Overall Score: 3, moderate financial standing.
QUBT Rating
- Rating: C+ reflecting a very favorable overall rating despite some weaknesses.
- Discounted Cash Flow Score: 2, moderate indication of valuation.
- ROE Score: 1, very unfavorable efficiency in profit generation.
- ROA Score: 1, very unfavorable asset utilization.
- Debt To Equity Score: 5, very favorable, indicating low financial risk.
- Overall Score: 2, moderate financial standing but lower than NTAP.
Which one is the best rated?
Based strictly on the provided data, NTAP is better rated overall with higher scores in discounted cash flow, ROE, and ROA, despite a weak debt to equity score. QUBT shows strength in debt management but lagging significantly in profitability metrics.
Scores Comparison
Here is a comparison of the key financial health scores for NetApp, Inc. and Quantum Computing, Inc.:
NTAP Scores
- Altman Z-Score: 2.86, in the grey zone, showing moderate bankruptcy risk.
- Piotroski Score: 7, strong financial strength and good value potential.
QUBT Scores
- Altman Z-Score: 50.17, in the safe zone, indicating very low bankruptcy risk.
- Piotroski Score: 4, average financial strength and moderate value.
Which company has the best scores?
Quantum Computing, Inc. has a significantly higher Altman Z-Score placing it in the safe zone, while NetApp’s score is in the grey zone. However, NetApp’s Piotroski Score is stronger, indicating better financial health by that measure.
Grades Comparison
Here is a detailed comparison of the latest grades and ratings for NetApp, Inc. and Quantum Computing, Inc.:
NetApp, Inc. Grades
This table summarizes recent grades assigned to NetApp, Inc. by major financial institutions.
| Grading Company | Action | New Grade | Date |
|---|---|---|---|
| Barclays | Maintain | Overweight | 2025-11-26 |
| Wells Fargo | Maintain | Equal Weight | 2025-11-26 |
| Northland Capital Markets | Upgrade | Outperform | 2025-11-26 |
| B of A Securities | Maintain | Neutral | 2025-11-26 |
| UBS | Maintain | Neutral | 2025-11-26 |
| Citigroup | Maintain | Neutral | 2025-11-12 |
| Citigroup | Maintain | Neutral | 2025-10-16 |
| Argus Research | Maintain | Buy | 2025-08-29 |
| UBS | Maintain | Neutral | 2025-08-28 |
| Barclays | Maintain | Overweight | 2025-08-28 |
NetApp’s grades show a generally stable outlook with multiple “Neutral” and “Overweight” ratings, and one recent upgrade to “Outperform.”
Quantum Computing, Inc. Grades
This table presents recent grades for Quantum Computing, Inc. from recognized grading firms.
| Grading Company | Action | New Grade | Date |
|---|---|---|---|
| Ascendiant Capital | Maintain | Buy | 2025-12-22 |
| Cantor Fitzgerald | Maintain | Neutral | 2025-12-18 |
| Lake Street | Maintain | Buy | 2025-11-17 |
| Ascendiant Capital | Maintain | Buy | 2025-10-03 |
| Ascendiant Capital | Maintain | Buy | 2025-06-06 |
| Ascendiant Capital | Maintain | Buy | 2025-04-28 |
| Ascendiant Capital | Maintain | Buy | 2024-11-13 |
| Ascendiant Capital | Maintain | Buy | 2023-11-24 |
Quantum Computing, Inc. consistently receives “Buy” ratings from Ascendiant Capital, supplemented by one “Neutral” from Cantor Fitzgerald.
Which company has the best grades?
Quantum Computing, Inc. holds a stronger and more consistent “Buy” rating consensus compared to NetApp’s mixed “Hold” and “Neutral” grades. This suggests investors may view Quantum Computing as having higher growth potential but possibly higher risk, while NetApp’s stable but cautious ratings indicate moderate expectations.
Strengths and Weaknesses
Below is a comparative overview of key strengths and weaknesses for NetApp, Inc. (NTAP) and Quantum Computing, Inc. (QUBT) based on their latest financial and operational data.
| Criterion | NetApp, Inc. (NTAP) | Quantum Computing, Inc. (QUBT) |
|---|---|---|
| Diversification | Strong in hybrid and public cloud segments with $5.9B and $665M revenue respectively in 2025 | Very limited revenue, primarily in services ($346K in 2024) |
| Profitability | Favorable profitability with 18.05% net margin and ROIC at 16.49% | Negative profitability; net margin deeply negative (-18,375.87%) and ROIC at -17.41% |
| Innovation | Consistent investment in cloud and software maintenance | Focused on emerging quantum tech but still early-stage with no significant commercial revenue |
| Global presence | Established global footprint in cloud infrastructure markets | Limited scale and market presence, mostly in developmental phase |
| Market Share | Solid market share in hybrid cloud storage | Negligible market share in quantum computing sector |
Key takeaways: NetApp exhibits a well-diversified business with strong profitability and a durable competitive advantage, reflected in its growing ROIC and favorable financial ratios. Quantum Computing, Inc. is in an early growth phase, showing improving ROIC but currently destroying value with very limited revenue and negative margins, implying higher risk for investors.
Risk Analysis
Below is a comparison of key risks for NetApp, Inc. (NTAP) and Quantum Computing, Inc. (QUBT) based on the most recent data from 2025 and 2024 respectively:
| Metric | NetApp, Inc. (NTAP) | Quantum Computing, Inc. (QUBT) |
|---|---|---|
| Market Risk | Beta 1.374, moderate | Beta 3.489, high volatility |
| Debt level | Debt-to-equity 3.36, high leverage | Debt-to-equity 0.01, very low leverage |
| Regulatory Risk | Moderate, tech sector regulations | Moderate, emerging tech regulations |
| Operational Risk | Medium, established infrastructure | High, early-stage tech and scaling challenges |
| Environmental Risk | Moderate, compliance in data centers | Low, limited physical footprint |
| Geopolitical Risk | Moderate, global cloud services | Moderate, reliance on US government contracts |
NetApp carries moderate market and operational risks typical of a mature tech company but faces higher debt levels, impacting financial stability. Quantum Computing, with its high beta and operational early-stage risks, shows greater volatility but benefits from very low debt. The most impactful risk for NTAP is its leverage, while for QUBT, market volatility and operational uncertainties dominate.
Which Stock to Choose?
NetApp, Inc. has demonstrated favorable income growth with a stable 18.05% net margin and increasing earnings per share over 2021-2025. Its financial ratios show a slightly favorable stance, strong profitability with a 114% ROE, moderate debt levels, and a robust B+ rating.
Quantum Computing, Inc. displays unfavorable income statement metrics including a deeply negative net margin and negative returns on equity and assets. Its financial ratios are mostly unfavorable, though it carries very low debt and a C+ rating, reflecting ongoing value destruction despite improving profitability.
For investors, NetApp might appear more suitable for those prioritizing stable profitability and a durable competitive advantage, while Quantum Computing could be of interest to risk-tolerant investors focusing on early-stage growth potential but facing significant financial challenges.
Disclaimer: Investment carries a risk of loss of initial capital. The past performance is not a reliable indicator of future results. Be sure to understand risks before making an investment decision.
Go Further
I encourage you to read the complete analyses of NetApp, Inc. and Quantum Computing, Inc. to enhance your investment decisions: