In the dynamic world of data storage, Pure Storage, Inc. (PSTG) and NetApp, Inc. (NTAP) stand out as key players shaping the future of enterprise technology. Both companies operate in the computer hardware industry, focusing on innovative data management and storage solutions that cater to evolving cloud and on-premises demands. This comparison will help investors discern which company offers the most compelling growth and stability prospects in 2026. Let’s explore which holds greater promise for your investment portfolio.
Table of contents
Companies Overview
I will begin the comparison between Pure Storage and NetApp by providing an overview of these two companies and their main differences.
Pure Storage Overview
Pure Storage, Inc. specializes in data storage technologies, offering products and services that include FlashArray for block storage, FlashBlade for unstructured data, and cloud-native Kubernetes data management solutions. Founded in 2009 and based in Santa Clara, CA, Pure Storage focuses on enterprise-class data services such as data reduction, protection, and encryption, positioning itself as a modern innovator in computer hardware with a market cap of $24.7B.
NetApp Overview
NetApp, Inc. provides cloud-led and data-centric services designed to manage data on-premises and across public and private clouds. Established in 1992 and headquartered in San Jose, CA, NetApp operates through Hybrid Cloud and Public Cloud segments, offering intelligent data management software and storage infrastructure solutions. With a market cap of $21.4B, it serves diverse industries including energy, healthcare, and telecommunications, emphasizing hybrid and cloud storage technologies.
Key similarities and differences
Both Pure Storage and NetApp operate within the computer hardware industry, focusing on data storage and management solutions. Pure Storage emphasizes all-flash arrays and cloud-native Kubernetes services, while NetApp offers a broader portfolio including hybrid cloud and public cloud software and infrastructure. NetApp has a longer market presence and larger workforce, whereas Pure Storage is positioned as a younger, innovation-driven competitor with a slightly higher market valuation.
Income Statement Comparison
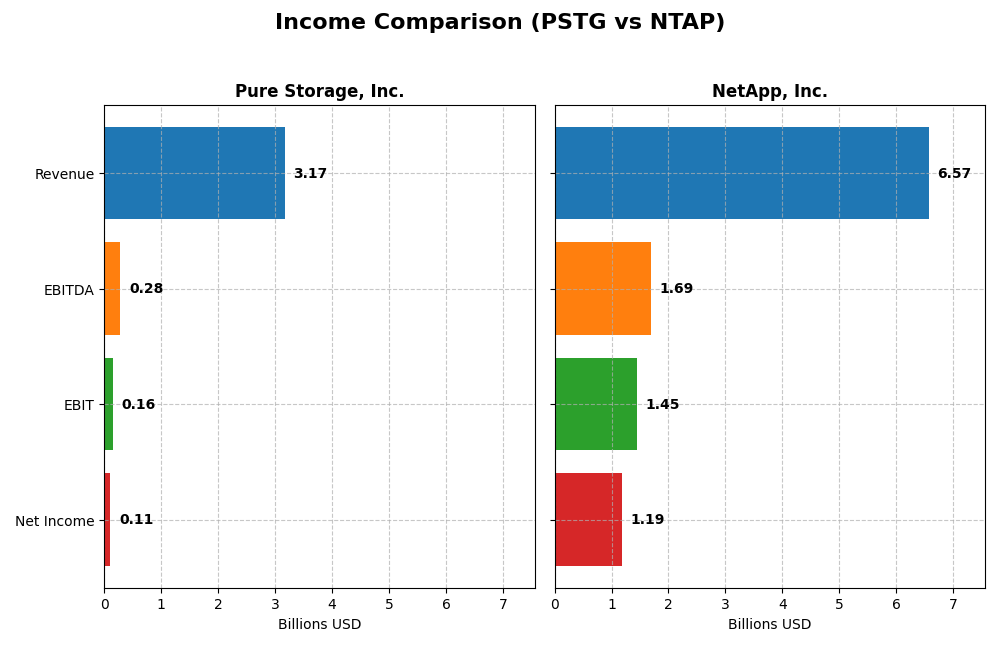
The table below compares key income statement metrics for Pure Storage, Inc. and NetApp, Inc. for their most recent fiscal year, providing a snapshot of their financial performance.
| Metric | Pure Storage, Inc. (PSTG) | NetApp, Inc. (NTAP) |
|---|---|---|
| Market Cap | 24.7B | 21.4B |
| Revenue | 3.17B | 6.57B |
| EBITDA | 282M | 1.69B |
| EBIT | 156M | 1.45B |
| Net Income | 107M | 1.19B |
| EPS | 0.33 | 5.81 |
| Fiscal Year | 2025 | 2025 |
Income Statement Interpretations
Pure Storage, Inc.
Pure Storage has exhibited robust growth from 2021 to 2025, with revenue increasing by 88.11% and net income surging 137.84%. Gross margins remain strong at nearly 70%, while net margins have improved significantly, reaching 3.37% in 2025. The latest year shows accelerated EBIT growth of 58.71%, signaling margin expansion and operational improvement despite a modest net margin.
NetApp, Inc.
NetApp’s revenue grew moderately by 14.42% over the period, with net income rising 62.47%. Its gross margin is stable at 70.19%, and EBIT margin is notably healthy at 22.02%. The 2025 fiscal year reveals steady revenue growth of 4.85%, and net margin improvement of 14.72%, reflecting consistent profitability gains and controlled operating expenses.
Which one has the stronger fundamentals?
Both companies display favorable income statement fundamentals with strong gross margins and positive growth metrics. Pure Storage shows higher overall revenue and net income growth, but NetApp maintains superior EBIT and net margins. Each has strengths: Pure Storage excels in growth momentum, while NetApp demonstrates better profitability and margin stability.
Financial Ratios Comparison
The table below compares key financial ratios for Pure Storage, Inc. (PSTG) and NetApp, Inc. (NTAP) based on their most recent fiscal year data, providing insight into profitability, liquidity, leverage, and market valuation.
| Ratios | Pure Storage, Inc. (2025) | NetApp, Inc. (2025) |
|---|---|---|
| ROE | 8.2% | 114.0% |
| ROIC | 2.5% | 16.5% |
| P/E | 207 | 15.4 |
| P/B | 16.9 | 17.6 |
| Current Ratio | 1.61 | 1.26 |
| Quick Ratio | 1.58 | 1.22 |
| D/E (Debt-to-Equity) | 0.22 | 3.36 |
| Debt-to-Assets | 7.1% | 32.3% |
| Interest Coverage | 10.9 | 20.9 |
| Asset Turnover | 0.80 | 0.61 |
| Fixed Asset Turnover | 5.21 | 8.17 |
| Payout Ratio | 0% | 36% |
| Dividend Yield | 0% | 2.3% |
Interpretation of the Ratios
Pure Storage, Inc.
Pure Storage shows a mixed financial profile with favorable liquidity and leverage ratios but unfavorable profitability metrics such as net margin (3.37%), ROE (8.17%), and ROIC (2.45%). Its valuation ratios, including PE (206.9) and PB (16.9), are also unfavorable, indicating a potentially high market premium. The company does not pay dividends, reflecting a reinvestment strategy likely focused on growth and innovation.
NetApp, Inc.
NetApp presents generally strong profitability ratios, with a net margin of 18.05%, ROE of 114.04%, and ROIC of 16.49%, all favorable. Liquidity is decent, though current ratio is neutral at 1.26. Its debt-to-equity ratio is high (3.36), marked unfavorable, but interest coverage remains strong. NetApp pays a 2.32% dividend yield, supported by a stable payout, signaling shareholder returns with manageable risk.
Which one has the best ratios?
NetApp’s ratios appear stronger overall, showing robust profitability, solid dividend yield, and manageable valuation concerns. Pure Storage’s ratios are balanced between favorable liquidity and weak profitability, with no dividend payouts. Thus, NetApp holds a slight edge due to its favorable earnings performance and shareholder returns, despite some leverage concerns.
Strategic Positioning
This section compares the strategic positioning of Pure Storage, Inc. and NetApp, Inc., including their market position, key segments, and exposure to technological disruption:
Pure Storage, Inc.
- Competes in computer hardware with a $24.7B market cap and moderate competitive pressure.
- Focuses on data storage products and services, including FlashArray and cloud-native Kubernetes data management.
- Innovates with enterprise-class data services and AI-ready infrastructure, addressing traditional and unstructured workloads.
NetApp, Inc.
- Operates in computer hardware with a $21.4B market cap facing strong competitive pressure.
- Concentrates on cloud-led data management and hybrid/public cloud storage services.
- Emphasizes intelligent data management software and cloud storage solutions across hybrid and public clouds.
Pure Storage, Inc. vs NetApp, Inc. Positioning
Pure Storage offers a more product and service diversified portfolio with a strong flash storage focus, while NetApp is more concentrated on cloud and hybrid cloud data management, leveraging extensive software and cloud services. Both have distinct market approaches with varying scale and specialization.
Which has the best competitive advantage?
NetApp demonstrates a very favorable moat with consistent value creation and growing ROIC, indicating durable competitive advantage. Pure Storage shows slightly unfavorable moat status despite improving profitability, suggesting weaker competitive defensibility.
Stock Comparison
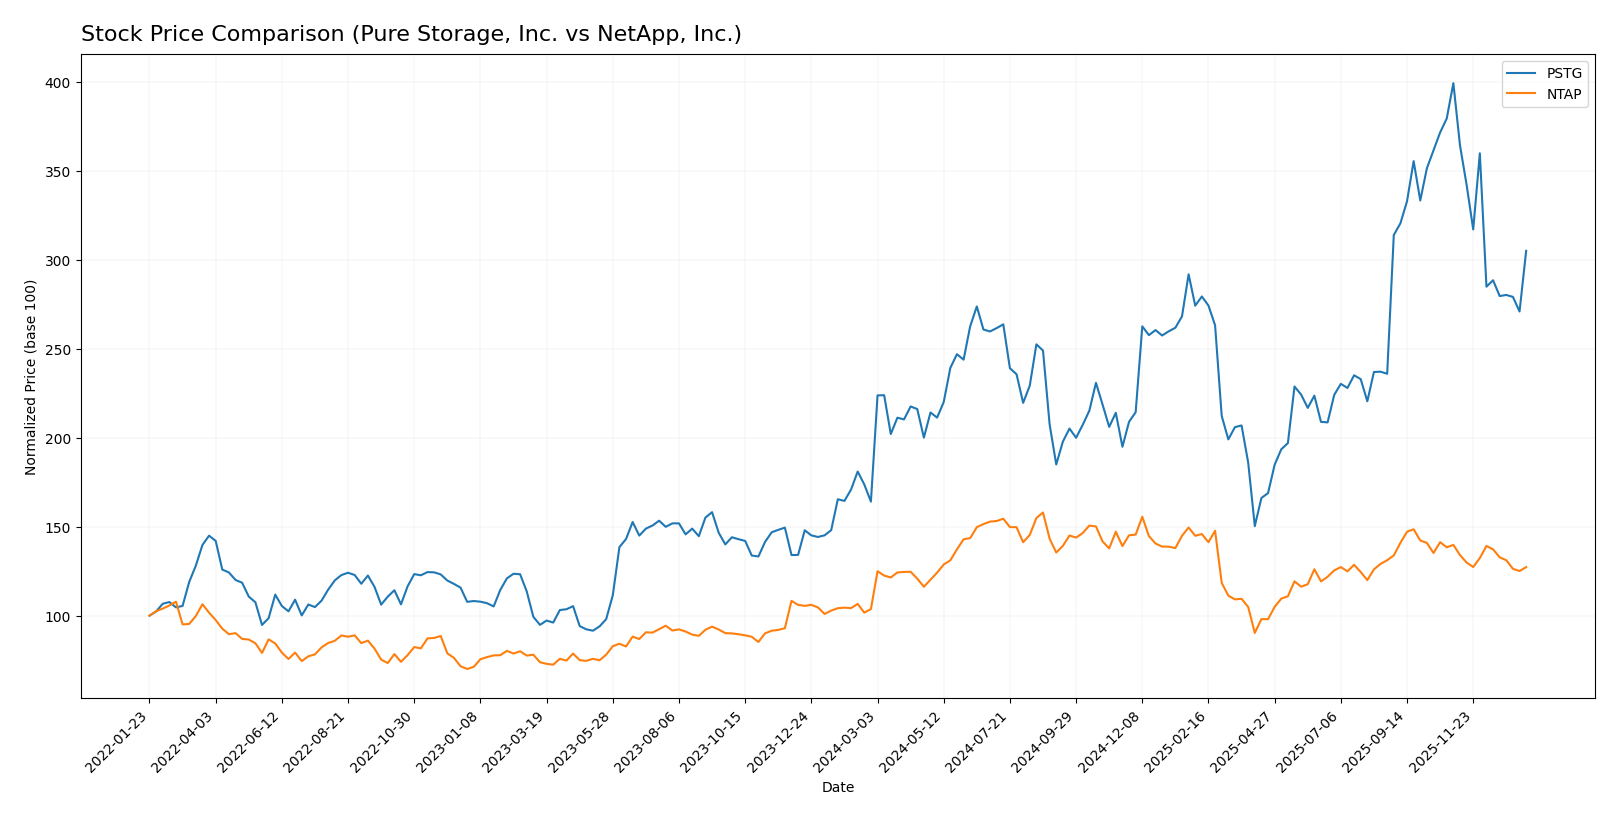
The stock price movements of Pure Storage, Inc. and NetApp, Inc. over the past 12 months reveal notable bullish trends with decelerating momentum, alongside recent downward corrections in both stocks reflecting seller dominance in trading volumes.
Trend Analysis
Pure Storage, Inc. experienced an 85.88% price increase over the past year, indicating a strong bullish trend with deceleration. The stock reached a high of 98.7 and a low of 37.18, with recent weeks showing a 23.6% decline and increased volatility.
NetApp, Inc. showed a 22.75% price gain over the same period, also bullish but with deceleration. It peaked at 133.12 and bottomed at 76.1, followed by an 8.91% recent drop, accompanied by reduced volatility compared to Pure Storage.
Comparing both, Pure Storage delivered a higher market performance over the past year, though both stocks faced recent declines dominated by sellers, highlighting cautious trading dynamics.
Target Prices
Analysts present a clear consensus on target prices for Pure Storage, Inc. and NetApp, Inc., reflecting moderate upside potential.
| Company | Target High | Target Low | Consensus |
|---|---|---|---|
| Pure Storage, Inc. | 105 | 60 | 91.15 |
| NetApp, Inc. | 137 | 115 | 125.17 |
The consensus target prices suggest that Pure Storage’s stock, currently at $75.41, has room to grow toward the $91 range, while NetApp, trading at $107.28, is expected to appreciate closer to $125, indicating positive analyst sentiment for both.
Analyst Opinions Comparison
This section compares analysts’ ratings and financial scores for Pure Storage, Inc. (PSTG) and NetApp, Inc. (NTAP):
Rating Comparison
PSTG Rating
- Rating: B- indicating a very favorable overall assessment.
- Discounted Cash Flow Score: 3, a moderate valuation metric.
- ROE Score: 3, showing moderate efficiency in profit use.
- ROA Score: 3, moderate asset utilization.
- Debt To Equity Score: 3, moderate financial risk.
- Overall Score: 2, moderate overall financial standing.
NTAP Rating
- Rating: B+ indicating a very favorable overall assessment.
- Discounted Cash Flow Score: 4, a favorable valuation metric.
- ROE Score: 5, showing very favorable profit generation.
- ROA Score: 5, very favorable asset utilization.
- Debt To Equity Score: 1, indicating very unfavorable risk.
- Overall Score: 3, moderate overall financial standing.
Which one is the best rated?
Based strictly on the provided data, NTAP holds a higher rating (B+) and scores better on discounted cash flow, ROE, and ROA compared to PSTG. However, NTAP’s debt-to-equity score is significantly weaker, indicating higher financial risk.
Scores Comparison
Here is a comparison of the Altman Z-Score and Piotroski Score for Pure Storage, Inc. and NetApp, Inc.:
Pure Storage Scores
- Altman Z-Score: 5.91, indicating a safe zone with low bankruptcy risk.
- Piotroski Score: 5, considered average financial strength.
NetApp Scores
- Altman Z-Score: 2.86, in the grey zone with moderate bankruptcy risk.
- Piotroski Score: 7, indicating strong financial strength.
Which company has the best scores?
Pure Storage shows a stronger Altman Z-Score, suggesting better bankruptcy safety. NetApp has a higher Piotroski Score, indicating stronger financial health. Each company leads in a different score based on the provided data.
Grades Comparison
Here is a detailed comparison of the latest grades from reputable grading companies for the two companies:
Pure Storage, Inc. Grades
The table below summarizes recent analyst grades for Pure Storage, Inc.:
| Grading Company | Action | New Grade | Date |
|---|---|---|---|
| UBS | Maintain | Sell | 2025-12-03 |
| Barclays | Maintain | Equal Weight | 2025-12-03 |
| Needham | Maintain | Buy | 2025-12-03 |
| Susquehanna | Downgrade | Neutral | 2025-12-03 |
| JP Morgan | Maintain | Overweight | 2025-12-03 |
| Citigroup | Maintain | Buy | 2025-12-03 |
| Wedbush | Maintain | Outperform | 2025-12-03 |
| Lake Street | Maintain | Buy | 2025-12-03 |
| JP Morgan | Maintain | Overweight | 2025-11-17 |
| Morgan Stanley | Maintain | Equal Weight | 2025-11-17 |
Grades for Pure Storage show a mixed pattern with several buy and overweight ratings balanced by a sell from UBS and a neutral from Susquehanna, indicating a cautious but generally positive outlook.
NetApp, Inc. Grades
The table below summarizes recent analyst grades for NetApp, Inc.:
| Grading Company | Action | New Grade | Date |
|---|---|---|---|
| Barclays | Maintain | Overweight | 2025-11-26 |
| Wells Fargo | Maintain | Equal Weight | 2025-11-26 |
| Northland Capital Markets | Upgrade | Outperform | 2025-11-26 |
| B of A Securities | Maintain | Neutral | 2025-11-26 |
| UBS | Maintain | Neutral | 2025-11-26 |
| Citigroup | Maintain | Neutral | 2025-11-12 |
| Citigroup | Maintain | Neutral | 2025-10-16 |
| Argus Research | Maintain | Buy | 2025-08-29 |
| UBS | Maintain | Neutral | 2025-08-28 |
| Barclays | Maintain | Overweight | 2025-08-28 |
NetApp’s grades reveal a somewhat balanced assessment with a slight tilt towards neutral and overweight ratings, including an upgrade to outperform from Northland Capital Markets, reflecting moderate confidence among analysts.
Which company has the best grades?
Pure Storage, Inc. has received a stronger consensus toward buy and outperform ratings, while NetApp, Inc. shows more neutral and hold ratings overall. This suggests Pure Storage may be viewed more favorably by analysts, potentially impacting investor sentiment and portfolio decisions.
Strengths and Weaknesses
Below is a comparison table of key strengths and weaknesses for Pure Storage, Inc. (PSTG) and NetApp, Inc. (NTAP) based on the latest data from 2025.
| Criterion | Pure Storage, Inc. (PSTG) | NetApp, Inc. (NTAP) |
|---|---|---|
| Diversification | Moderate product and growing service revenues (Product: $1.7B; Service: $1.47B) | Strong hybrid and public cloud focus ($6.57B combined) |
| Profitability | Low net margin (3.37%), ROIC below WACC, value destroying but improving | High net margin (18.05%), ROIC well above WACC, value creating |
| Innovation | Growing ROIC trend indicates improving efficiency and innovation | Durable competitive advantage with steady ROIC growth |
| Global presence | Expanding, but smaller scale compared to NTAP | Strong global presence with large cloud segment revenues |
| Market Share | Smaller market share, premium valuation (PE 206.9) | Larger market share, reasonable valuation (PE 15.44) |
Key takeaway: NetApp demonstrates clear profitability, a durable moat, and solid financial ratios, making it a stronger value creator. Pure Storage shows improving profitability but currently destroys value and carries higher valuation risks. Investors should weigh growth potential against profitability when choosing between them.
Risk Analysis
Below is a comparative overview of key risks for Pure Storage, Inc. (PSTG) and NetApp, Inc. (NTAP) based on the most recent 2025 data.
| Metric | Pure Storage, Inc. (PSTG) | NetApp, Inc. (NTAP) |
|---|---|---|
| Market Risk | Beta 1.264 (moderate) | Beta 1.374 (moderate-high) |
| Debt level | Low (D/E 0.22, Debt/Assets 7.1%) | Higher (D/E 3.36, Debt/Assets 32.3%) |
| Regulatory Risk | Moderate, US-focused tech | Moderate, global cloud and data management |
| Operational Risk | Medium, reliance on flash storage tech | Medium, diverse cloud and storage products |
| Environmental Risk | Moderate, tech industry standard | Moderate, cloud infrastructure impact |
| Geopolitical Risk | Moderate, global sales exposure | Higher, due to broader international cloud services |
Pure Storage shows lower financial leverage and strong liquidity but has weaker profitability metrics, increasing sensitivity to market downturns. NetApp benefits from higher profitability and strong cash flows but carries elevated debt, which could be impactful if interest rates rise. Market and geopolitical risks remain most significant for both due to sector volatility and global operations.
Which Stock to Choose?
Pure Storage, Inc. (PSTG) shows a favorable income growth with an 11.92% revenue increase in 2025 and strong profitability improvements, yet financial ratios remain mixed: moderate ROE at 8.17%, low net margin at 3.37%, and low debt levels. Its rating is very favorable overall but with some valuation concerns.
NetApp, Inc. (NTAP) presents steady income growth with a 4.85% revenue increase in 2025 and higher profitability, including an 18.05% net margin and ROE above 100%. Financial ratios are mostly favorable, though debt levels are higher. The company holds a very favorable rating with strong profitability metrics.
For investors prioritizing growth and improving profitability, PSTG’s rising income and modest debt might appear attractive despite mixed ratios. Conversely, NTAP’s stronger profitability and value creation suggest it could be more suitable for those focused on quality and stable returns, considering its higher debt. The choice might depend on risk tolerance and investment strategy.
Disclaimer: Investment carries a risk of loss of initial capital. The past performance is not a reliable indicator of future results. Be sure to understand risks before making an investment decision.
Go Further
I encourage you to read the complete analyses of Pure Storage, Inc. and NetApp, Inc. to enhance your investment decisions: