Home > Comparison > Financial Services > SPGI vs NDAQ
The strategic rivalry between S&P Global Inc. and Nasdaq, Inc. defines the current trajectory of the financial data and stock exchange sector. S&P Global operates as a diversified analytics and credit ratings powerhouse, while Nasdaq focuses on technology-driven market services and exchange platforms. This head-to-head represents a clash between comprehensive data solutions and cutting-edge market technology. This analysis will identify which company offers a superior risk-adjusted opportunity for a diversified portfolio in financial services.
Table of contents
Companies Overview
S&P Global and Nasdaq shape the backbone of financial data and market infrastructure worldwide.
S&P Global Inc.: Data-Driven Market Insight Leader
S&P Global dominates as a provider of credit ratings, benchmarks, and analytics across capital, commodity, and automotive markets. Its revenue stems from six divisions offering data, research, and workflow solutions. In 2026, the firm focuses strategically on expanding its data-driven decision-making platforms and integrating ESG and sustainability analytics into core offerings.
Nasdaq, Inc.: Technology-Forward Market Operator
Nasdaq operates primarily as a technology-driven exchange and market services provider, generating revenue from trading, clearing, and listing fees across multiple asset classes. Its 2026 strategy emphasizes advanced SaaS solutions for anti-financial crime compliance and enhanced market surveillance, alongside growth in investment intelligence and corporate governance platforms.
Strategic Collision: Similarities & Divergences
Both companies excel in financial data and market services but diverge in approach: S&P Global leans on comprehensive data analytics and ratings, while Nasdaq prioritizes technology-enabled market infrastructure. Their primary battleground is delivering sophisticated data and compliance tools to institutional investors. This distinction carves two unique investment profiles—one rooted in data expertise, the other in market technology innovation.
Income Statement Comparison
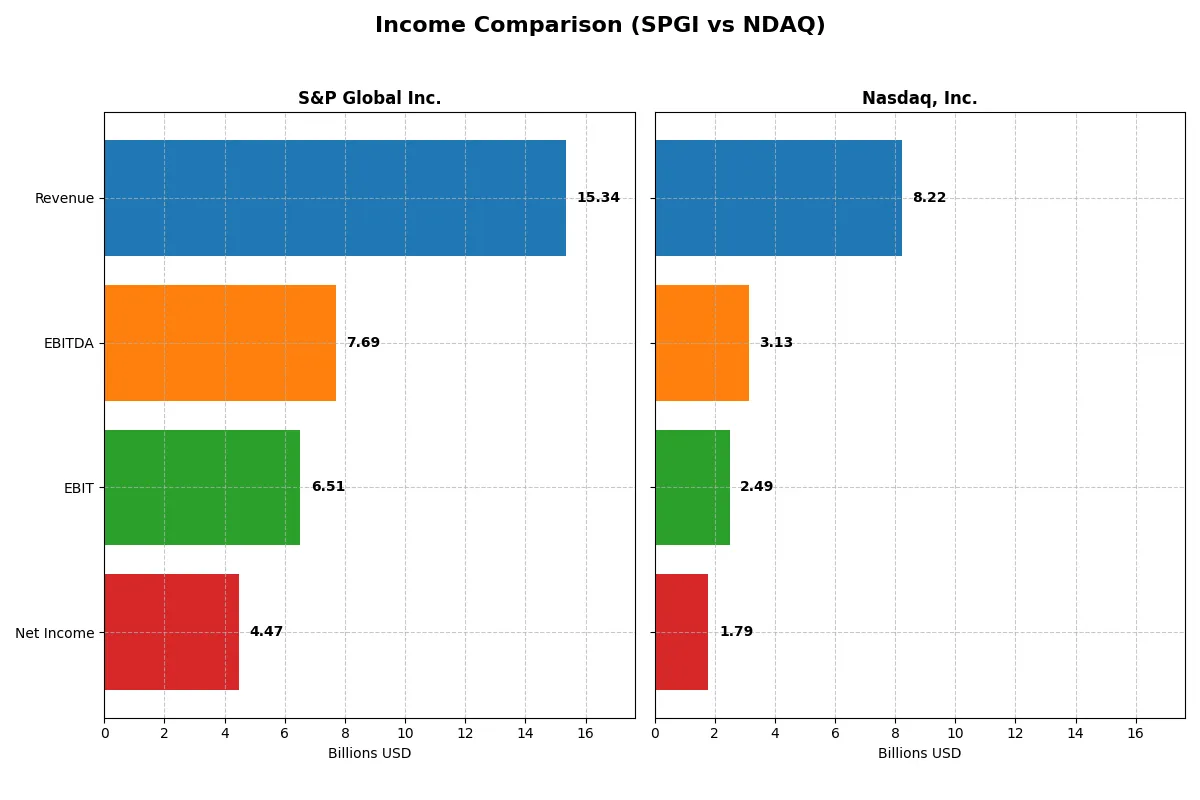
This table dissects the core profitability and scalability of both corporate engines to reveal who dominates the bottom line:
| Metric | S&P Global Inc. (SPGI) | Nasdaq, Inc. (NDAQ) |
|---|---|---|
| Revenue | 15.3B | 8.2B |
| Cost of Revenue | 9.2B | 4.3B |
| Operating Expenses | 0 | 1.6B |
| Gross Profit | 6.2B | 3.9B |
| EBITDA | 7.7B | 3.1B |
| EBIT | 6.5B | 2.5B |
| Interest Expense | 287M | 88M |
| Net Income | 4.5B | 1.8B |
| EPS | 14.67 | 3.13 |
| Fiscal Year | 2025 | 2025 |
Income Statement Analysis: The Bottom-Line Duel
This income statement comparison exposes which company runs its financial engine with superior efficiency and growth momentum.
S&P Global Inc. Analysis
S&P Global’s revenue rose steadily from $8.3B in 2021 to $15.3B in 2025, marking an 85% growth over five years. Net income followed suit, climbing from $3.0B to $4.5B, reflecting solid profitability gains. The company sustains a healthy gross margin around 40%, and its net margin reached 29.15% in 2025, signaling robust cost control and operational leverage. Recent years show strong EBIT and EPS growth, underscoring improving earnings quality despite a slight gross profit dip in 2025.
Nasdaq, Inc. Analysis
Nasdaq’s revenue expanded from $5.9B in 2021 to $8.2B in 2025, a respectable 40% increase. Net income advanced from $1.2B to $1.8B, supported by a rising net margin of 21.77%. Nasdaq boasts a higher gross margin of nearly 48%, but operating expenses grew faster than revenue in the last year, dampening margin expansion. Nevertheless, the firm delivered impressive EBIT and EPS growth fueled by efficient cost management and rising top-line momentum, especially in 2025.
Margin Strength vs. Growth Trajectory
S&P Global showcases superior scale and margin strength, delivering nearly double Nasdaq’s revenue and a higher net margin. Nasdaq shines in rapid margin and earnings growth, with a superior gross margin but narrower net profit. For investors, S&P Global offers steady, high-margin profitability, while Nasdaq provides more dynamic growth potential with slightly thinner margins.
Financial Ratios Comparison
These vital ratios act as a diagnostic tool to expose the underlying fiscal health, valuation premiums, and capital efficiency of the companies compared below:
| Ratios | S&P Global Inc. (SPGI) | Nasdaq, Inc. (NDAQ) |
|---|---|---|
| ROE | 14.31% | 14.63% |
| ROIC | 9.24% | 8.26% |
| P/E | 35.63 | 30.98 |
| P/B | 5.10 | 4.53 |
| Current Ratio | 0.82 | 1.01 |
| Quick Ratio | 0.82 | 1.01 |
| D/E | 0.43 | 0.81 |
| Debt-to-Assets | 22.19% | 31.97% |
| Interest Coverage | 22.57 | 26.49 |
| Asset Turnover | 0.25 | 0.26 |
| Fixed Asset Turnover | 55.17 | 6.99 |
| Payout Ratio | 26.17% | 33.59% |
| Dividend Yield | 0.73% | 1.08% |
| Fiscal Year | 2025 | 2025 |
Efficiency & Valuation Duel: The Vital Signs
Ratios act as the company’s DNA, revealing hidden risks and operational excellence that numbers alone cannot fully express.
S&P Global Inc.
S&P Global posts a strong net margin of 29.15% and a solid ROE of 14.31%, signaling decent profitability. Yet, its P/E of 35.63 and P/B of 5.1 mark the stock as expensive. Shareholder returns rely mainly on modest dividends with limited buybacks, reflecting cautious capital allocation.
Nasdaq, Inc.
Nasdaq delivers a 21.77% net margin and a slightly higher ROE at 14.63%, showing efficient profitability. Its P/E of 30.98 and P/B of 4.53 suggest a stretched but less inflated valuation versus S&P Global. Dividend yield at 1.08% complements a balanced approach to shareholder returns and reinvestment.
Premium Valuation vs. Operational Safety
S&P Global commands a premium valuation but faces liquidity concerns with its low current ratio. Nasdaq offers a more balanced risk-reward profile, supported by better liquidity and a slightly more favorable ratio mix. Risk-tolerant investors might lean toward S&P Global’s premium growth, while conservative ones may prefer Nasdaq’s steadier footing.
Which one offers the Superior Shareholder Reward?
I observe that S&P Global Inc. (SPGI) maintains a lower dividend yield (~0.73%) but couples that with a conservative payout ratio (~26%) and robust free cash flow coverage (~97%). Its buyback programs are intense, supporting share price appreciation sustainably. Nasdaq, Inc. (NDAQ) offers a higher dividend yield (~1.08%) with an elevated payout ratio (~34%) but weaker free cash flow coverage (~88%). Its buyback activity appears less aggressive, which may limit capital return upside. Historically, I’ve seen that SPGI’s balanced distribution model, combining dividends and strong buybacks funded by resilient cash flows, drives superior total returns over market cycles. In 2026, I favor SPGI for a more attractive, sustainable shareholder reward profile.
Comparative Score Analysis: The Strategic Profile
The radar chart reveals the fundamental DNA and trade-offs of S&P Global Inc. and Nasdaq, Inc., highlighting their core financial strengths and valuation challenges:
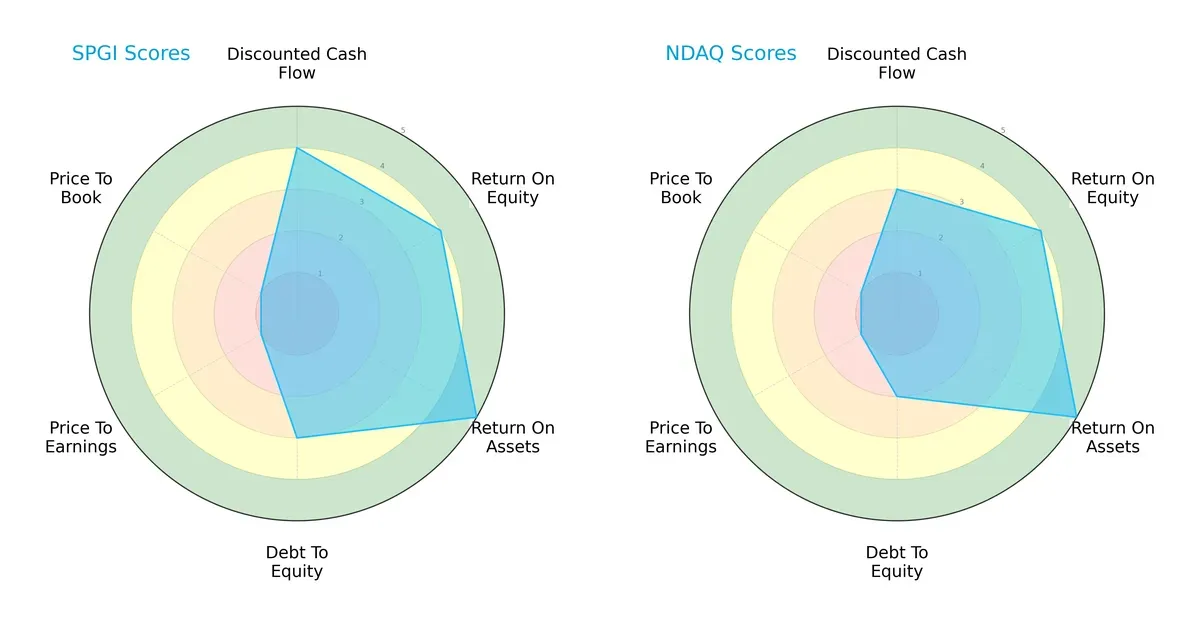
S&P Global leads in discounted cash flow (4 vs. 3) and debt-to-equity (3 vs. 2), indicating a more balanced capital structure. Both firms excel equally in return on equity (4) and return on assets (5), showcasing operational efficiency. However, both face valuation headwinds with very unfavorable price-to-earnings and price-to-book scores (1 each). Overall, S&P Global offers a steadier profile, while Nasdaq leans more heavily on asset efficiency amid weaker leverage metrics.
—
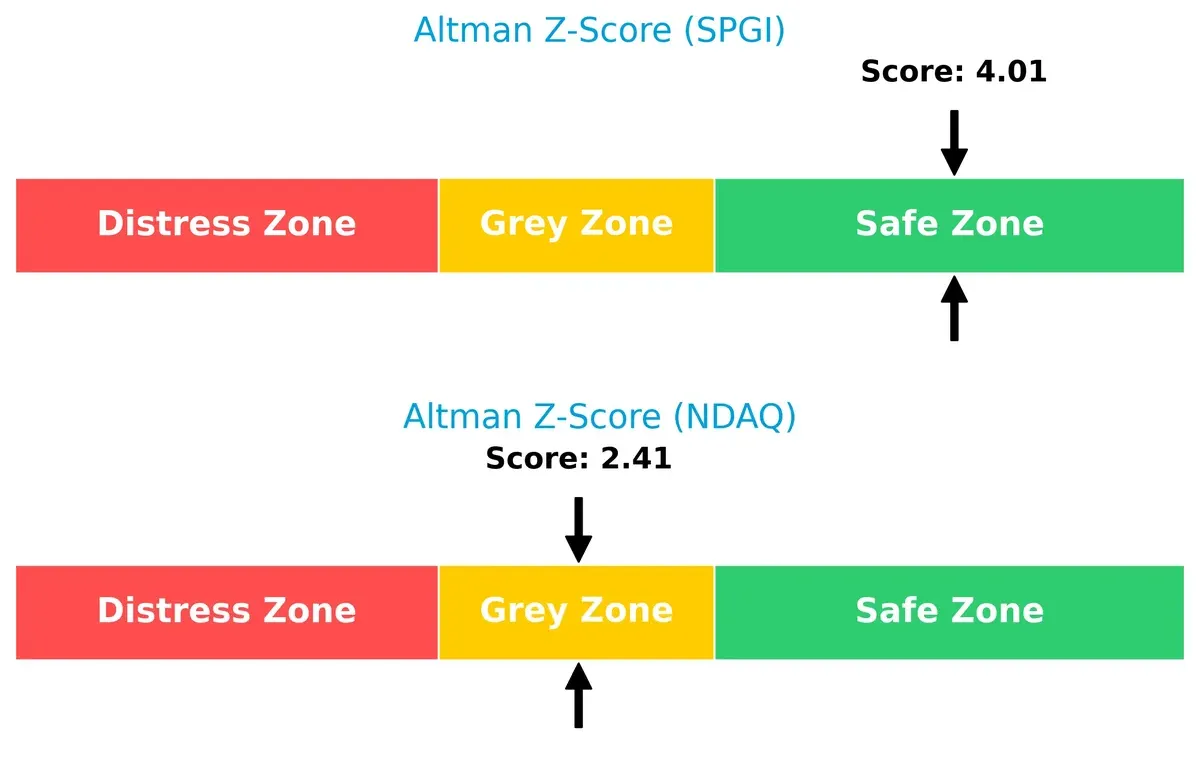
Bankruptcy Risk: Solvency Showdown
S&P Global’s Altman Z-Score of 4.01 signals strong solvency and a safe zone for long-term survival. Nasdaq scores 2.41, placing it in the grey zone with moderate bankruptcy risk. This gap highlights S&P Global’s superior financial resilience in this cycle:
—
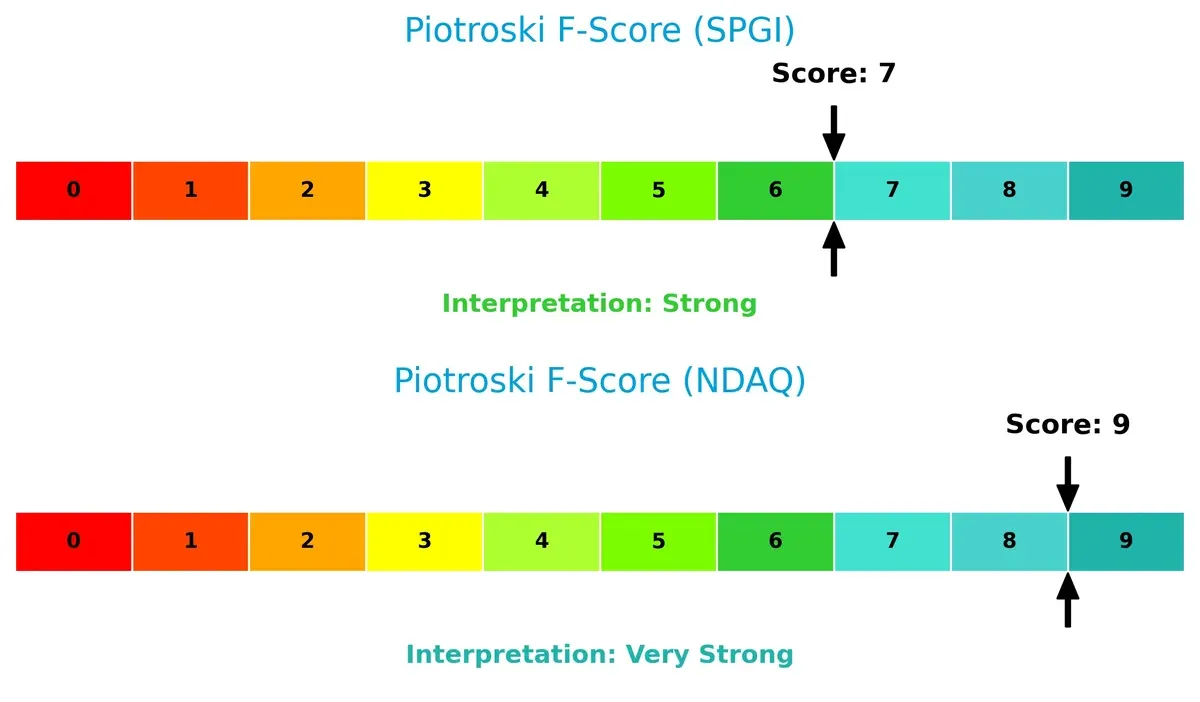
Financial Health: Quality of Operations
Nasdaq’s Piotroski F-Score of 9 outperforms S&P Global’s 7, indicating Nasdaq’s superior internal financial health and operational quality. S&P Global shows some red flags compared to Nasdaq’s peak score, suggesting room for improvement in profitability and liquidity metrics:
How are the two companies positioned?
This section dissects the operational DNA of S&P Global and Nasdaq by comparing their revenue distribution and internal strengths and weaknesses. The goal is to confront their economic moats and identify which model offers the most resilient, sustainable advantage.
Revenue Segmentation: The Strategic Mix
This visual comparison dissects how S&P Global Inc. and Nasdaq, Inc. diversify their income streams and where their primary sector bets lie:
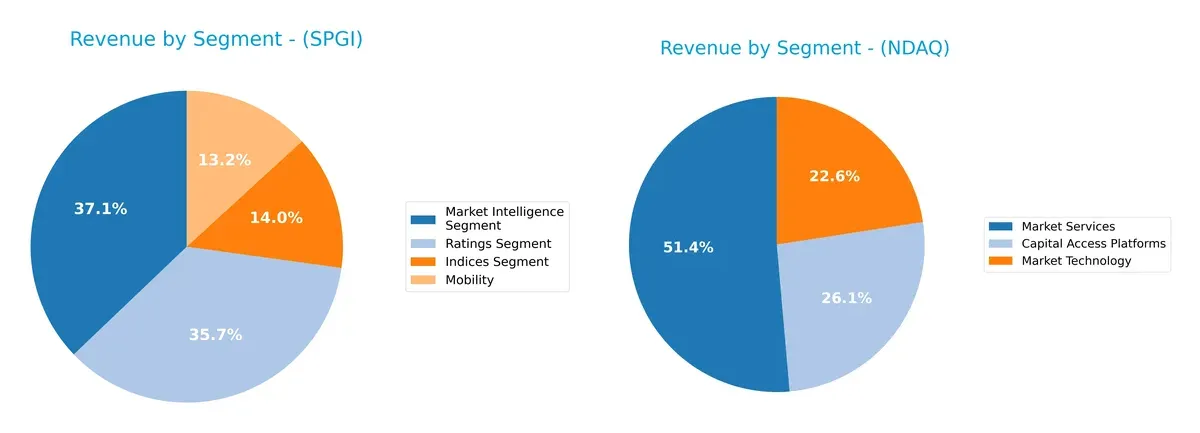
S&P Global’s 2025 revenue shows strong balance across Market Intelligence (4.9B), Ratings (4.7B), and Indices (1.9B). Nasdaq leans more heavily on Market Services (4.2B), anchoring 43% of its 9.2B total. S&P’s diverse segments reduce concentration risk, while Nasdaq’s dominance in Market Services signals infrastructure strength but heightens exposure to that segment’s cyclicality. This contrast highlights S&P’s ecosystem lock-in versus Nasdaq’s infrastructure pivot.
Strengths and Weaknesses Comparison
This table compares the Strengths and Weaknesses of S&P Global Inc. and Nasdaq, Inc.:
S&P Global Inc. Strengths
- Diverse revenue streams across indices, market intelligence, ratings, and mobility segments
- Strong profitability with 29.15% net margin
- Favorable debt metrics and interest coverage
- Significant global presence with large US and Europe sales
Nasdaq, Inc. Strengths
- Balanced revenues from capital access, market technology, and market services
- Favorable net margin of 21.77% and lower WACC at 7.44%
- Strong liquidity ratios and interest coverage
- Large US market share with growing non-US revenues
S&P Global Inc. Weaknesses
- Low current ratio at 0.82 signals liquidity concerns
- High valuation multiples (PE 35.63, PB 5.1) may pressure returns
- Relatively low asset turnover (0.25) limits efficiency
- Low dividend yield at 0.73%
Nasdaq, Inc. Weaknesses
- Elevated debt-to-equity at 0.81 adds financial risk
- High PE (30.98) and PB (4.53) ratios imply stretched valuations
- Asset turnover also low (0.26), impacting capital use efficiency
- Dividend yield moderate at 1.08%
S&P Global shows broad diversification and strong profitability but faces liquidity and valuation challenges. Nasdaq benefits from favorable capital costs and liquidity but carries higher leverage risk. Both companies must balance growth and efficiency amid distinct financial structures.
The Moat Duel: Analyzing Competitive Defensibility
A structural moat is the only true shield protecting long-term profits from relentless competitive erosion. Let’s dissect the moats of two leaders in financial data services:
S&P Global Inc.: Data Dominance Through Intangible Assets
I see S&P Global’s moat rooted in its intangible assets—trusted credit ratings and proprietary indices. This manifests in stable, high EBIT margins above 40%. However, its declining ROIC signals rising competition risks by 2026.
Nasdaq, Inc.: Technology-Driven Network Effects
Nasdaq’s moat stems from its integrated technology platforms and network effects across multiple asset classes. It sustains healthy gross margins near 48%, with faster revenue growth and improving EPS. Still, slight ROIC erosion warns of margin pressure ahead.
Verdict: Intangible Trust vs. Tech Ecosystem Resilience
Both firms face declining ROIC trends, yet Nasdaq’s faster growth and stronger operational leverage hint at a wider moat. I conclude Nasdaq is better positioned to defend market share in an evolving financial data landscape.
Which stock offers better returns?
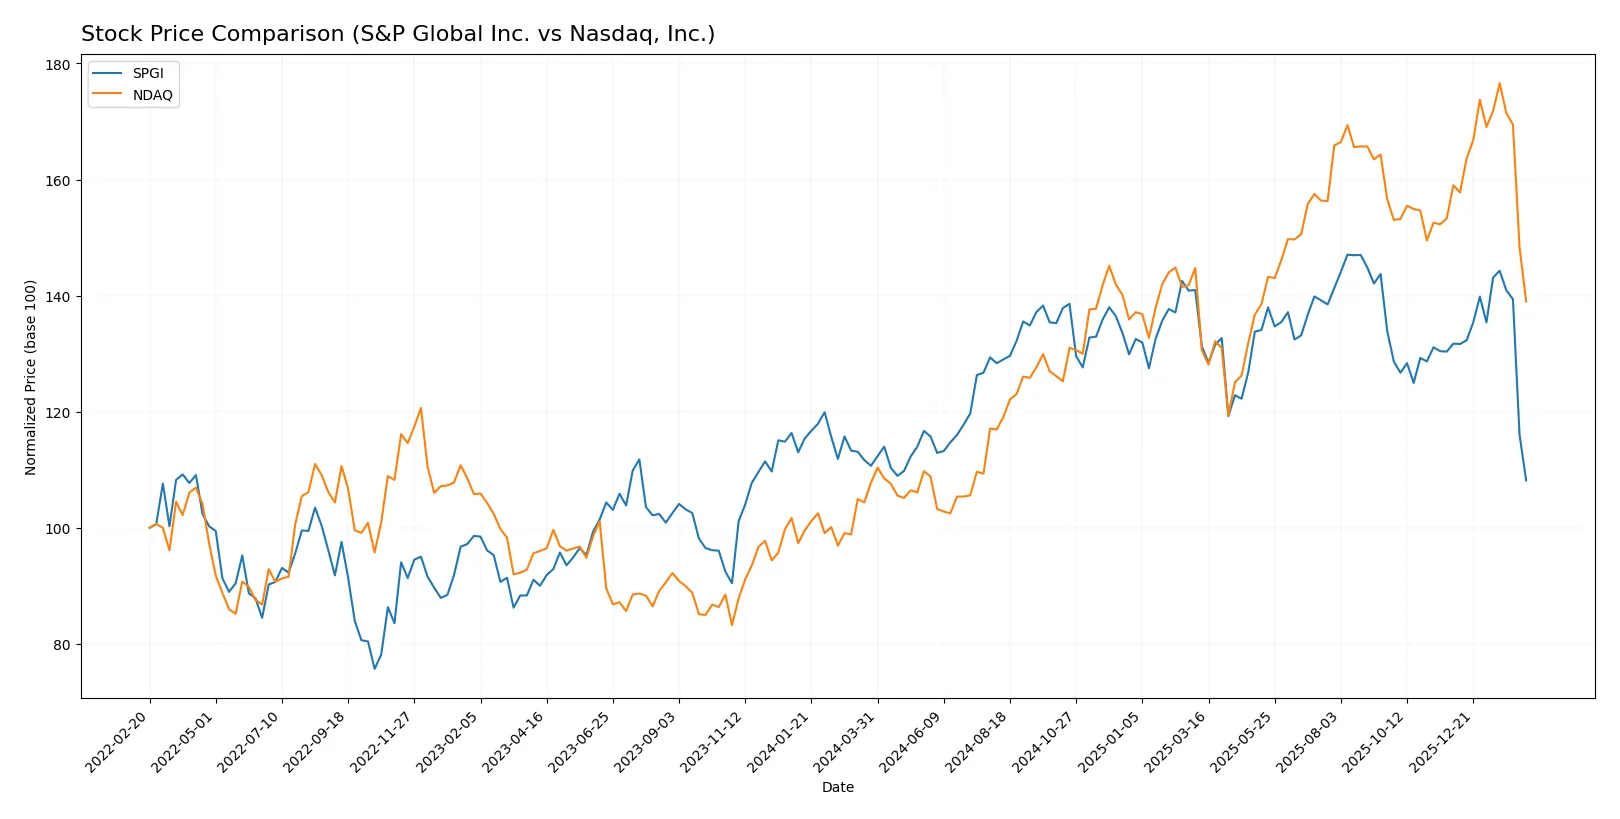
The past 12 months show contrasting price dynamics: S&P Global Inc. declines steadily with marked deceleration, while Nasdaq, Inc. posts strong gains despite recent pullbacks.
Trend Comparison
S&P Global Inc. (SPGI) registers a -2.29% price change over the last year, signaling a bearish trend with deceleration. The stock peaked at 556.87 and troughed at 409.54.
Nasdaq, Inc. (NDAQ) posts a robust 28.95% price increase, confirming a bullish trend with deceleration. Its price range spans from 58.6 to 100.98 during the same period.
Nasdaq’s stock outperforms S&P Global by a wide margin over the past year, delivering the highest market return despite recent downward pressure.
Target Prices
Analysts project strong upside potential for both S&P Global Inc. and Nasdaq, Inc., signaling positive market sentiment.
| Company | Target Low | Target High | Consensus |
|---|---|---|---|
| S&P Global Inc. | 482 | 627 | 544.75 |
| Nasdaq, Inc. | 100 | 120 | 111.8 |
The consensus targets for SPGI and NDAQ sit well above their current prices of 410 and 79.5, respectively. This suggests analysts expect notable appreciation ahead.

Don’t Let Luck Decide Your Entry Point
Optimize your entry points with our advanced ProRealTime indicators. You’ll get efficient buy signals with precise price targets for maximum performance. Start outperforming now!
How do institutions grade them?
Here are the latest institutional grades for S&P Global Inc. and Nasdaq, Inc.:
S&P Global Inc. Grades
The table below shows recent grades from reputable financial institutions for S&P Global Inc.:
| Grading Company | Action | New Grade | Date |
|---|---|---|---|
| BMO Capital | Maintain | Outperform | 2026-02-12 |
| Mizuho | Maintain | Outperform | 2026-02-12 |
| Stifel | Maintain | Buy | 2026-02-11 |
| Evercore ISI Group | Maintain | Outperform | 2026-02-11 |
| RBC Capital | Maintain | Outperform | 2026-02-11 |
| Goldman Sachs | Maintain | Buy | 2026-02-11 |
| Wells Fargo | Maintain | Overweight | 2026-02-11 |
| Goldman Sachs | Maintain | Buy | 2026-02-09 |
| Morgan Stanley | Maintain | Overweight | 2026-01-13 |
| Evercore ISI Group | Maintain | Outperform | 2026-01-08 |
Nasdaq, Inc. Grades
Below are recent institutional grades for Nasdaq, Inc. from recognized firms:
| Grading Company | Action | New Grade | Date |
|---|---|---|---|
| Barclays | Maintain | Overweight | 2026-01-30 |
| Morgan Stanley | Maintain | Overweight | 2026-01-30 |
| RBC Capital | Maintain | Outperform | 2026-01-30 |
| TD Cowen | Maintain | Hold | 2026-01-30 |
| JP Morgan | Maintain | Overweight | 2026-01-30 |
| Morgan Stanley | Maintain | Overweight | 2026-01-15 |
| TD Cowen | Maintain | Hold | 2026-01-14 |
| UBS | Maintain | Buy | 2026-01-12 |
| JP Morgan | Maintain | Overweight | 2026-01-12 |
| Barclays | Maintain | Overweight | 2026-01-08 |
Which company has the best grades?
S&P Global Inc. consistently receives higher-tier grades like Buy and Outperform from multiple firms. Nasdaq, Inc. shows more Overweight and Hold ratings with fewer Buy grades. This difference may influence investor confidence and portfolio positioning.
Risks specific to each company
The following categories identify the critical pressure points and systemic threats facing both firms in the 2026 market environment:
1. Market & Competition
S&P Global Inc.
- Dominates credit ratings and commodity insights but faces pricing pressure in analytics segments.
Nasdaq, Inc.
- Strong in market technology and trading platforms, yet competition in SaaS surveillance is intensifying.
2. Capital Structure & Debt
S&P Global Inc.
- Maintains a conservative debt-to-equity ratio (0.43) with favorable interest coverage (22.7x).
Nasdaq, Inc.
- Higher leverage at 0.81 debt-to-equity, raising caution despite strong interest coverage (28.3x).
3. Stock Volatility
S&P Global Inc.
- Beta of 1.20 indicates moderate volatility, slightly above sector norms.
Nasdaq, Inc.
- Lower beta of 1.02 suggests marginally less price fluctuation than S&P Global.
4. Regulatory & Legal
S&P Global Inc.
- Faces scrutiny over credit rating transparency and compliance standards.
Nasdaq, Inc.
- Encounters regulatory challenges tied to market surveillance tools and listing platform governance.
5. Supply Chain & Operations
S&P Global Inc.
- Relies on data integrity and technology infrastructure with moderate operational complexity.
Nasdaq, Inc.
- Dependent on technology delivery and real-time data feeds, vulnerable to system disruptions.
6. ESG & Climate Transition
S&P Global Inc.
- Integrates ESG analytics into product offerings; must manage transition risks in commodity markets.
Nasdaq, Inc.
- Invests in ESG compliance technology but faces pressure to enhance transparency and data quality.
7. Geopolitical Exposure
S&P Global Inc.
- Global footprint exposes it to regulatory variability and geopolitical tensions in key markets.
Nasdaq, Inc.
- International exchange operations subject to geopolitical risks, particularly in emerging markets.
Which company shows a better risk-adjusted profile?
S&P Global’s most impactful risk lies in its stretched valuation metrics and weaker liquidity ratios. Nasdaq’s principal concern is its higher leverage, increasing financial risk despite operational strength. Overall, Nasdaq presents a slightly better risk-adjusted profile, supported by a safer liquidity position and very strong Piotroski score. Recent data reveals Nasdaq’s Altman Z-Score in the grey zone, signaling moderate bankruptcy risk, while S&P Global sits comfortably in the safe zone but must monitor valuation pressures closely.
Final Verdict: Which stock to choose?
S&P Global Inc. (SPGI) excels as a cash-generating powerhouse with a formidable operating margin. Its superpower lies in efficient capital deployment and strong income quality. However, its low current ratio signals a point of vigilance on short-term liquidity. SPGI suits aggressive growth portfolios willing to tolerate liquidity risk for robust profitability.
Nasdaq, Inc. (NDAQ) benefits from a durable strategic moat in market infrastructure and recurring revenue streams. Its safer liquidity profile and favorable weighted average cost of capital enhance stability compared to SPGI. NDAQ is a fit for GARP investors who seek steady growth combined with reasonable risk management.
If you prioritize cash flow strength and operating efficiency, SPGI is the compelling choice due to its superior profitability metrics. However, if you seek a more balanced risk-return profile with a defensible moat, NDAQ offers better stability and a more moderate valuation. Both present analytical scenarios depending on the investor’s appetite for growth versus safety.
Disclaimer: Investment carries a risk of loss of initial capital. The past performance is not a reliable indicator of future results. Be sure to understand risks before making an investment decision.
Go Further
I encourage you to read the complete analyses of S&P Global Inc. and Nasdaq, Inc. to enhance your investment decisions: