In the evolving landscape of industrial machinery, Xylem Inc. and Nano Nuclear Energy Inc. stand out with distinct yet overlapping ambitions in innovation and sustainability. Xylem leads in water technology solutions worldwide, while Nano Nuclear pioneers microreactor technology for clean energy. Comparing these companies reveals contrasting growth paths within the same sector. Join me as we explore which company presents the most compelling opportunity for investors today.
Table of contents
Companies Overview
I will begin the comparison between Xylem Inc. and Nano Nuclear Energy Inc by providing an overview of these two companies and their main differences.
Xylem Inc. Overview
Xylem Inc. specializes in designing, manufacturing, and servicing engineered products and solutions for water and wastewater applications globally. Operating through three segments—Water Infrastructure, Applied Water, and Measurement & Control Solutions—it offers pumps, filtration, treatment equipment, smart meters, and software services. Headquartered in Rye Brook, NY, Xylem serves residential, commercial, and industrial markets with a broad product portfolio and extensive sales network.
Nano Nuclear Energy Inc Overview
Nano Nuclear Energy Inc. develops advanced microreactor technology focused on solid-core battery and low-pressure coolant reactors. The company also works on fuel fabrication, transportation, and nuclear consultation services. Founded in 2021 and based in New York City, it operates with a small workforce and aims to innovate within the nuclear energy sector, emphasizing new reactor designs and fuel supply solutions.
Key similarities and differences
Both companies operate in the industrial machinery sector and are based in New York, but their business models diverge significantly. Xylem focuses on diverse water infrastructure and treatment solutions with global market reach, while Nano Nuclear Energy concentrates on nuclear microreactors and related fuel technologies, targeting a niche market with emerging technology. Xylem employs a large workforce and established product lines, whereas Nano Nuclear is a smaller, early-stage company with high beta volatility reflecting its developmental stage.
Income Statement Comparison
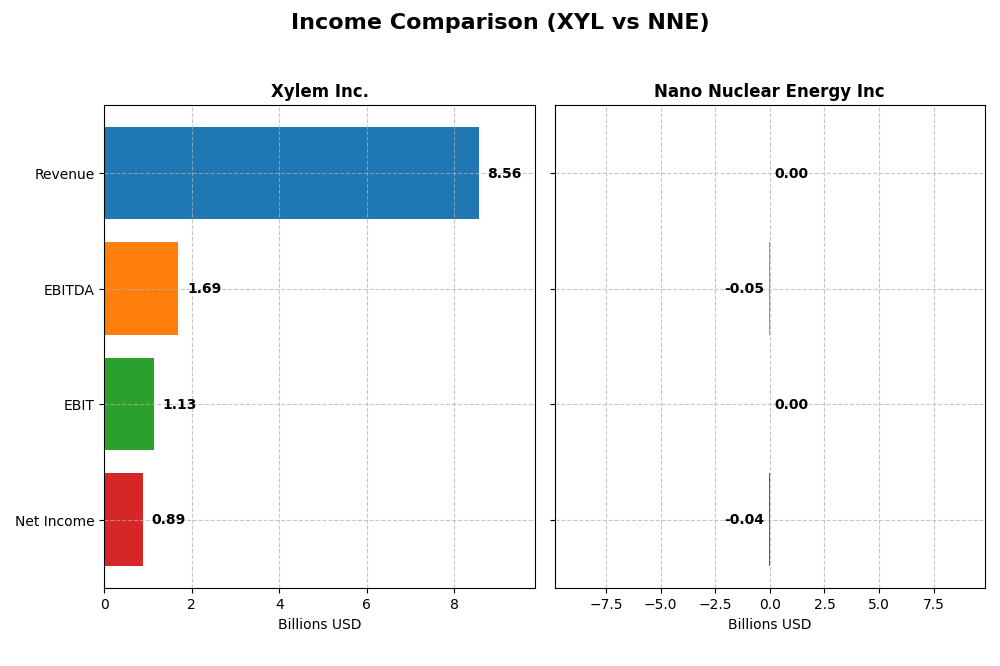
The table below compares the latest fiscal year income statement figures for Xylem Inc. and Nano Nuclear Energy Inc., highlighting key financial metrics.
| Metric | Xylem Inc. (XYL) | Nano Nuclear Energy Inc (NNE) |
|---|---|---|
| Market Cap | 34B | 1.33B |
| Revenue | 8.56B | 0 |
| EBITDA | 1.69B | -46.2M |
| EBIT | 1.13B | 0 |
| Net Income | 890M | -40.1M |
| EPS | 3.67 | -1.06 |
| Fiscal Year | 2024 | 2025 |
Income Statement Interpretations
Xylem Inc.
Xylem Inc. has shown strong revenue growth from $4.9B in 2020 to $8.6B in 2024, with net income rising from $254M to $890M. Margins improved significantly, with gross margin at 37.5% and net margin at 10.4% in 2024. The latest year saw revenue growth of 16.3% and net margin growth of 25.7%, indicating robust profitability and operational efficiency gains.
Nano Nuclear Energy Inc
Nano Nuclear Energy Inc. reported no revenue from 2022 to 2025 and consistently negative net income, reaching a loss of $40M in 2025. Margins remain unfavorable due to absence of sales and ongoing R&D and administrative expenses. Despite a 100% gross profit and EBIT growth in 2025, these reflect recovery from prior losses rather than profitability, with no net margin improvement.
Which one has the stronger fundamentals?
Xylem Inc. exhibits solid fundamentals, marked by consistent revenue and net income growth, favorable margins, and positive earnings momentum. In contrast, Nano Nuclear Energy faces significant challenges with no revenues and sustained losses, reflected in unfavorable margin metrics. Thus, Xylem’s income statement demonstrates more stable and positive financial fundamentals relative to Nano Nuclear Energy.
Financial Ratios Comparison
The table below presents a side-by-side comparison of key financial ratios for Xylem Inc. (XYL) and Nano Nuclear Energy Inc (NNE), based on their most recent fiscal year data, to facilitate a clear evaluation of their financial health and performance.
| Ratios | Xylem Inc. (2024) | Nano Nuclear Energy Inc (2025) |
|---|---|---|
| ROE | 8.36% | -18.00% |
| ROIC | 5.78% | -20.51% |
| P/E | 31.63 | -0.04 |
| P/B | 2.64 | 0.007 |
| Current Ratio | 1.75 | 53.48 |
| Quick Ratio | 1.33 | 53.48 |
| D/E (Debt-to-Equity) | 0.20 | 0.01 |
| Debt-to-Assets | 12.88% | 1.22% |
| Interest Coverage | 22.93 | 0 |
| Asset Turnover | 0.52 | 0 |
| Fixed Asset Turnover | 7.43 | 0 |
| Payout Ratio | 39.33% | 0 |
| Dividend Yield | 1.24% | 0 |
Interpretation of the Ratios
Xylem Inc.
Xylem Inc. shows a slightly favorable ratio profile with a strong net margin of 10.39% and sound liquidity ratios, including a current ratio of 1.75 and debt-to-equity at 0.2. However, its return on equity at 8.36% and P/E ratio of 31.63 are considered less favorable, indicating moderate profitability and valuation concerns. The company pays dividends with a stable yield of 1.24%, supported by reasonable payout coverage, suggesting manageable distribution risks.
Nano Nuclear Energy Inc
Nano Nuclear Energy’s ratios mostly reflect an unfavorable financial standing, with negative return metrics such as ROE at -18.0% and ROIC at -20.51%, and a zero net margin. Though it benefits from low leverage and a very high quick ratio of 53.48, the current ratio is abnormally high, signaling potential asset inefficiencies. The company does not pay dividends, likely due to its negative profitability and focus on growth and development in microreactor technology.
Which one has the best ratios?
Based on the ratio evaluations, Xylem Inc. presents a more balanced and slightly favorable financial profile, with stronger profitability and efficient leverage management. Conversely, Nano Nuclear Energy Inc. displays largely unfavorable performance metrics and no dividend distribution, reflecting higher financial risk and operational challenges. Thus, Xylem’s ratios are comparatively more robust for investors.
Strategic Positioning
This section compares the strategic positioning of Xylem Inc. and Nano Nuclear Energy Inc, including Market position, Key segments, and exposure to disruption:
Xylem Inc.
- Established market player with $34B market cap facing industrial machinery competition.
- Diversified segments: Water Infrastructure, Applied Water, Measurement & Control Solutions driving revenue.
- Moderate exposure to technological disruption through smart meters, cloud analytics, and control systems.
Nano Nuclear Energy Inc
- Smaller, emerging company with $1.3B market cap in microreactor technology.
- Focused on microreactor tech, fuel fabrication, and nuclear consultation services.
- High exposure to nuclear tech innovation and fuel supply disruptions.
Xylem Inc. vs Nano Nuclear Energy Inc Positioning
Xylem’s diversified water technology portfolio contrasts with Nano Nuclear’s concentrated nuclear microreactor focus. Xylem benefits from established infrastructure and broader revenue streams, while Nano Nuclear targets emerging nuclear energy markets with high innovation risk.
Which has the best competitive advantage?
Both companies show slightly unfavorable MOAT evaluations, indicating value destruction despite growing profitability. Xylem’s larger scale and diversified segments may offer more stability, while Nano Nuclear’s high ROIC growth suggests potential but with greater risk.
Stock Comparison
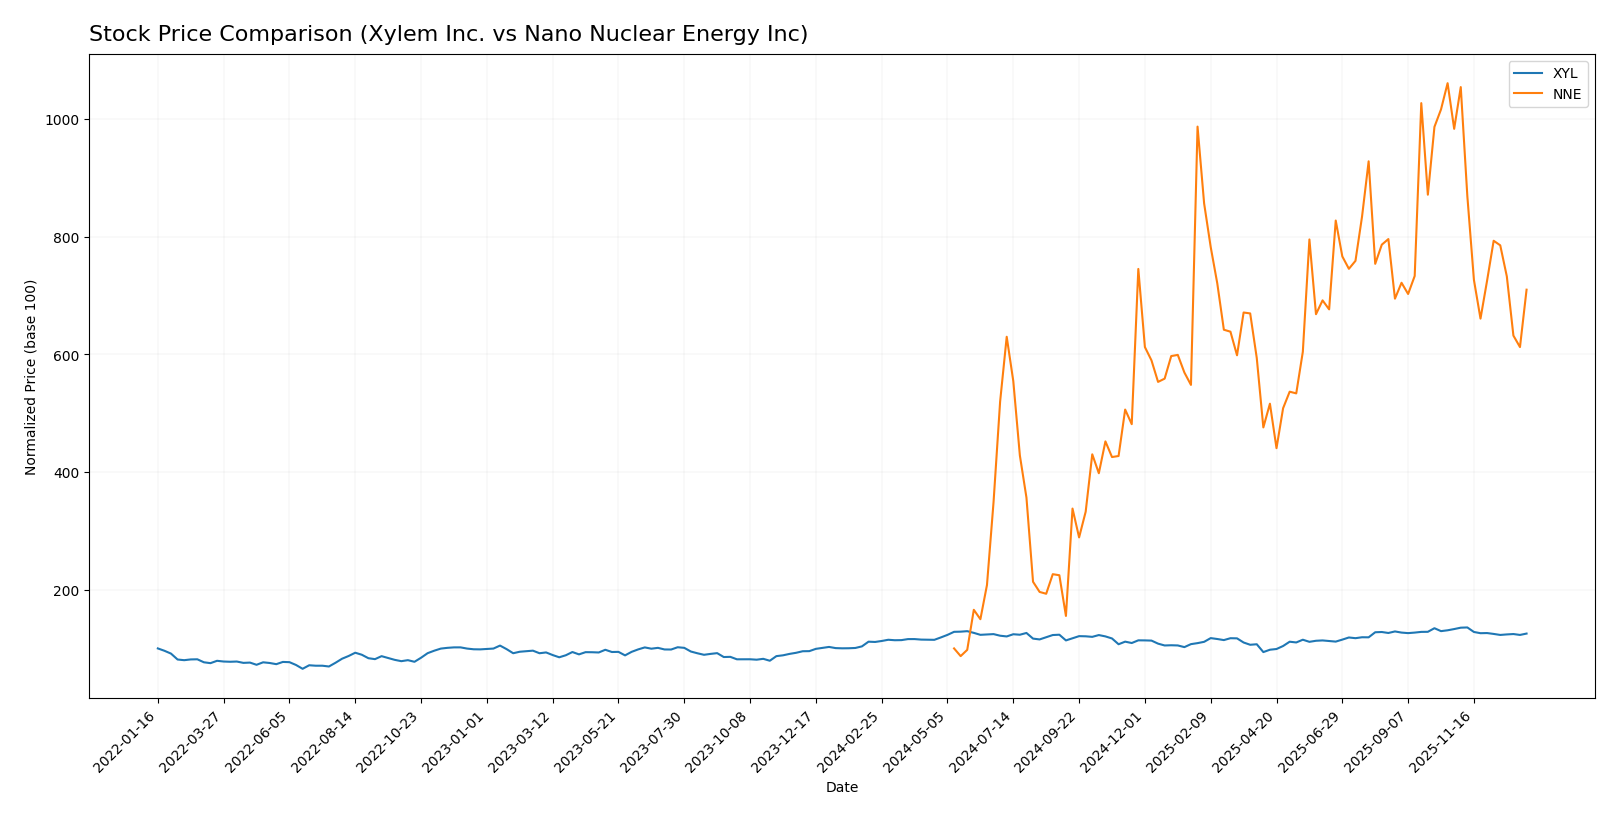
The stock price movements of Xylem Inc. and Nano Nuclear Energy Inc. over the past year illustrate significant gains followed by recent downward corrections, reflecting evolving trading dynamics and investor sentiment.
Trend Analysis
Xylem Inc. exhibited a bullish trend over the past 12 months with a 12.84% price increase, albeit with decelerating momentum and a notable high of 151.31. The recent quarter shows a mild bearish correction of -5.77%.
Nano Nuclear Energy Inc. delivered a strong bullish trend with a 609.76% rise over the same period, though also with deceleration. Its recent trend is bearish with a sharper -27.81% decline, indicating higher volatility.
Comparing both, Nano Nuclear Energy Inc. achieved the highest market performance, significantly outperforming Xylem Inc. despite recent steep declines.
Target Prices
Analysts show a positive target consensus for both Xylem Inc. and Nano Nuclear Energy Inc.
| Company | Target High | Target Low | Consensus |
|---|---|---|---|
| Xylem Inc. | 178 | 150 | 169.43 |
| Nano Nuclear Energy Inc | 50 | 50 | 50 |
The targets suggest significant upside potential for Xylem Inc., with consensus 21% above the current price of 139.69 USD. Nano Nuclear Energy’s consensus target of 50 USD also indicates a strong expected increase from its current 32.01 USD.
Analyst Opinions Comparison
This section compares analysts’ ratings and grades for Xylem Inc. and Nano Nuclear Energy Inc.:
Rating Comparison
Xylem Inc. Rating
- Rating: B, considered very favorable by analysts.
- Discounted Cash Flow Score: 3, moderate valuation view.
- ROE Score: 3, moderate efficiency in generating profit.
- ROA Score: 4, favorable asset utilization.
- Debt To Equity Score: 3, moderate financial risk.
- Overall Score: 3, moderate financial standing.
Nano Nuclear Energy Inc Rating
- Rating: C, also considered very favorable by analysts.
- Discounted Cash Flow Score: 2, moderate valuation view.
- ROE Score: 1, very unfavorable efficiency level.
- ROA Score: 1, very unfavorable asset utilization.
- Debt To Equity Score: 5, very favorable financial risk.
- Overall Score: 2, moderate financial standing.
Which one is the best rated?
Based strictly on the provided data, Xylem Inc. is better rated overall with higher scores in ROE, ROA, and a balanced debt-to-equity score, despite Nano Nuclear Energy’s stronger debt-to-equity rating.
Scores Comparison
Here is a comparison of the Altman Z-Score and Piotroski Score for Xylem Inc. and Nano Nuclear Energy Inc.:
Xylem Inc. Scores
- Altman Z-Score: 4.89, indicating strong financial safety in the safe zone.
- Piotroski Score: 8, reflecting very strong financial health.
Nano Nuclear Energy Inc Scores
- Altman Z-Score: 143.56, indicating extremely strong financial safety in the safe zone.
- Piotroski Score: 2, reflecting very weak financial health.
Which company has the best scores?
Nano Nuclear Energy Inc has a much higher Altman Z-Score, indicating lower bankruptcy risk, but Xylem Inc has a significantly stronger Piotroski Score, showing better overall financial health. Scores favor different aspects for each company.
Grades Comparison
Here is a comparison of the most recent grades from reputable financial institutions for the two companies:
Xylem Inc. Grades
The following table summarizes the recent grades assigned to Xylem Inc. by major grading companies:
| Grading Company | Action | New Grade | Date |
|---|---|---|---|
| Barclays | Maintain | Overweight | 2026-01-07 |
| Mizuho | Maintain | Neutral | 2026-01-05 |
| TD Cowen | Maintain | Hold | 2025-12-05 |
| UBS | Maintain | Buy | 2025-11-06 |
| RBC Capital | Maintain | Outperform | 2025-10-29 |
| Stifel | Maintain | Buy | 2025-10-29 |
| Barclays | Maintain | Overweight | 2025-10-29 |
| Citigroup | Maintain | Buy | 2025-10-29 |
| Citigroup | Maintain | Buy | 2025-10-09 |
| Mizuho | Maintain | Neutral | 2025-09-12 |
Xylem Inc. consistently receives a range of positive grades, with multiple “Buy,” “Overweight,” and “Outperform” ratings, indicating a generally favorable outlook.
Nano Nuclear Energy Inc Grades
The recent grades from respected institutions for Nano Nuclear Energy Inc are as follows:
| Grading Company | Action | New Grade | Date |
|---|---|---|---|
| HC Wainwright & Co. | Maintain | Buy | 2025-08-19 |
| Ladenburg Thalmann | Downgrade | Sell | 2025-08-18 |
| HC Wainwright & Co. | Maintain | Buy | 2025-08-15 |
| HC Wainwright & Co. | Maintain | Buy | 2025-03-31 |
| HC Wainwright & Co. | Maintain | Buy | 2025-01-29 |
| HC Wainwright & Co. | Maintain | Buy | 2024-11-27 |
| Benchmark | Maintain | Buy | 2024-11-07 |
| Benchmark | Maintain | Buy | 2024-07-15 |
| Benchmark | Maintain | Buy | 2024-06-25 |
Nano Nuclear Energy Inc shows a majority of “Buy” ratings, but with a notable recent downgrade to “Sell” by Ladenburg Thalmann, suggesting some degree of uncertainty.
Which company has the best grades?
Xylem Inc. has received a broader mix of positive ratings including multiple “Buy,” “Overweight,” and “Outperform” grades, while Nano Nuclear Energy Inc. mainly holds “Buy” ratings but includes a recent “Sell” downgrade. This difference may influence investors’ perception of stability and confidence in future performance.
Strengths and Weaknesses
The table below compares the key strengths and weaknesses of Xylem Inc. (XYL) and Nano Nuclear Energy Inc. (NNE) based on their latest financial and operational data.
| Criterion | Xylem Inc. (XYL) | Nano Nuclear Energy Inc (NNE) |
|---|---|---|
| Diversification | Diverse water-related segments: Applied Water, Measurement & Control, Infrastructure | Limited product diversification; early-stage focus on nuclear energy |
| Profitability | Positive net margin (10.4%), ROIC (5.8%) below WACC but growing | Negative margins and ROIC; currently unprofitable |
| Innovation | Moderate innovation in water tech solutions, steady revenue growth in Measurement & Control | High potential innovation in nuclear tech, but early development stage |
| Global presence | Established global footprint in water infrastructure and services | Limited global presence, niche market |
| Market Share | Strong market position in water infrastructure with $2.55B revenue segment | Small market share, emerging company |
Key takeaways: Xylem shows stable profitability with diversified water sector exposure and improving returns, though currently shedding some value. Nano Nuclear Energy is highly innovative but remains unprofitable and less diversified, posing higher risk despite growth potential.
Risk Analysis
Below is a comparative table of key risks for Xylem Inc. (XYL) and Nano Nuclear Energy Inc. (NNE) based on the most recent financial and operational data:
| Metric | Xylem Inc. (XYL) | Nano Nuclear Energy Inc. (NNE) |
|---|---|---|
| Market Risk | Moderate beta 1.17; stable in water infrastructure market | High beta 7.49; volatile due to emerging tech and small size |
| Debt level | Low debt-to-equity 0.2; strong interest coverage (25.7) | Very low debt 0.01; minimal financial burden |
| Regulatory Risk | Moderate; operates globally with compliance in water sector | High; nuclear energy is heavily regulated and faces licensing hurdles |
| Operational Risk | Medium; diversified product lines and global operations | High; early-stage tech with limited operational history and staff (5 employees) |
| Environmental Risk | Moderate; water treatment focus but subject to environmental regulations | High; nuclear tech involves radiation safety and waste management concerns |
| Geopolitical Risk | Moderate; international exposure but stable markets | High; nuclear projects sensitive to geopolitical tensions and export controls |
The most impactful and likely risks are regulatory and operational for Nano Nuclear Energy given its novel nuclear technology and small scale, which could hamper growth and increase volatility. Xylem faces moderate market and environmental risks but benefits from diversified operations and strong financial health, reducing bankruptcy risk. Caution is advised with NNE due to its unfavorable profitability metrics and very weak Piotroski score despite a safe Altman Z-score, reflecting early development risks.
Which Stock to Choose?
Xylem Inc. (XYL) shows a favorable income evolution with consistent revenue and net income growth, supported by solid profitability and low debt levels. Its financial ratios are slightly favorable overall, with strong liquidity and interest coverage, though some valuation metrics are moderate. The company’s rating is very favorable with a moderate overall score.
Nano Nuclear Energy Inc. (NNE) exhibits an unfavorable income statement, marked by persistent losses and negative profitability despite a growing ROIC trend. Financial ratios are largely unfavorable due to poor margins and asset turnover, though it benefits from very low debt and a very favorable rating status with moderate overall scores.
For investors prioritizing financial stability and consistent profitability, Xylem Inc. might appear more favorable given its strong income growth and balanced financial ratios. Conversely, those with a higher risk tolerance and interest in potential turnaround or growth opportunities might find Nano Nuclear Energy Inc.’s profile more appealing despite its current challenges.
Disclaimer: Investment carries a risk of loss of initial capital. The past performance is not a reliable indicator of future results. Be sure to understand risks before making an investment decision.
Go Further
I encourage you to read the complete analyses of Xylem Inc. and Nano Nuclear Energy Inc to enhance your investment decisions: