Home > Comparison > Industrials > ROP vs NNE
The strategic rivalry between Roper Technologies, Inc. and Nano Nuclear Energy Inc shapes the future of industrial machinery innovation. Roper dominates with a diversified portfolio of software and engineered products, blending mature cash flows and steady growth. In contrast, Nano Nuclear Energy pursues breakthrough microreactor technology, embodying high risk and high potential reward. This analysis aims to identify which company’s trajectory offers the superior risk-adjusted return for a diversified industrial portfolio.
Table of contents
Companies Overview
Roper Technologies and Nano Nuclear Energy both carve vital niches within industrial machinery, impacting diverse technology sectors.
Roper Technologies, Inc.: Diversified Industrial Software and Equipment Leader
Roper Technologies stands as a diversified industrial powerhouse. It generates revenues through a broad portfolio including software for healthcare, insurance, and supply chain, plus precision instruments and control systems. In 2026, its strategic focus emphasizes expanding cloud-based analytics and automation solutions, reinforcing its competitive edge across multiple verticals.
Nano Nuclear Energy Inc: Emerging Microreactor Innovator
Nano Nuclear Energy focuses on advanced microreactor technology. Its core revenue engine revolves around developing solid-core and low-pressure coolant nuclear reactors, alongside fuel fabrication and consultation services. In 2026, the company prioritizes advancing its ZEUS and ODIN reactor projects, positioning itself as a pioneer within the nuclear energy sector.
Strategic Collision: Similarities & Divergences
Both companies operate within industrial machinery but diverge sharply in scope. Roper embraces a broad, software-driven model, while Nano Nuclear pursues a niche, innovation-heavy reactor technology. Their primary battleground lies in technology leadership within industrial applications. These differences define distinct investment profiles: Roper offers stability through diversification, whereas Nano Nuclear embodies high-growth potential with elevated risk.
Income Statement Comparison
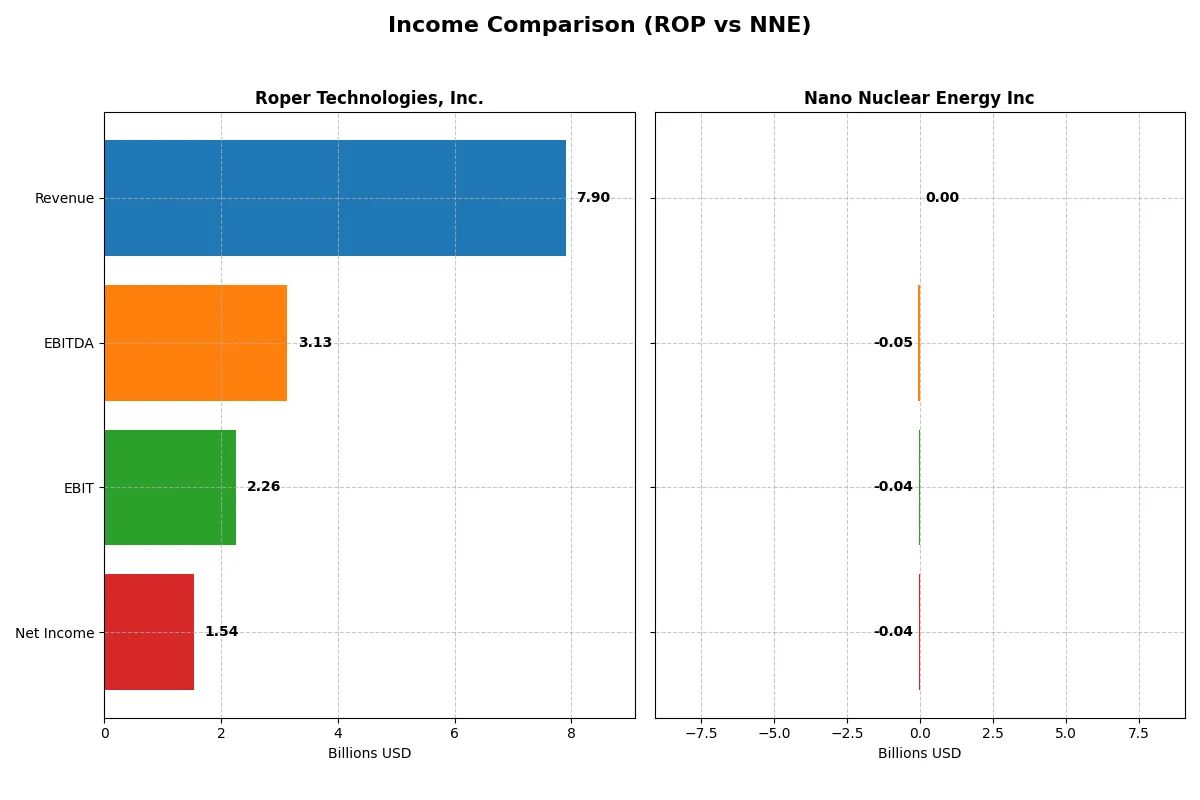
The following data dissects the core profitability and scalability of both corporate engines to reveal who dominates the bottom line:
| Metric | Roper Technologies, Inc. (ROP) | Nano Nuclear Energy Inc (NNE) |
|---|---|---|
| Revenue | 7.9B | 0 |
| Cost of Revenue | 2.43B | 651K |
| Operating Expenses | 3.24B | 44.4M |
| Gross Profit | 5.47B | -651K |
| EBITDA | 3.13B | -46.2M |
| EBIT | 2.26B | -40.1M |
| Interest Expense | 325M | 0 |
| Net Income | 1.54B | -40.1M |
| EPS | 14.31 | -1.06 |
| Fiscal Year | 2025 | 2025 |
Income Statement Analysis: The Bottom-Line Duel
This income statement comparison reveals which company runs a more efficient and profitable business engine over recent years.
Roper Technologies, Inc. Analysis
Roper Technologies shows consistent revenue growth from 4.8B in 2021 to 7.9B in 2025, alongside rising net income from 1.1B to 1.5B. Gross margins hover near 69%, indicating strong cost control. Despite slight net margin compression recently, Roper maintains solid operational efficiency and favorable earnings momentum in 2025.
Nano Nuclear Energy Inc Analysis
Nano Nuclear Energy reports zero revenue across recent years and escalating losses, with net income plunging to -40M in 2025. Gross and net margins remain negative, reflecting no commercial sales and high operating expenses. The company’s negative EBIT and net income highlight ongoing developmental challenges with no current profitability or scale.
Verdict: Established Profitability vs. Early-Stage Losses
Roper Technologies clearly outperforms Nano Nuclear Energy with robust revenue growth, strong margins, and positive net income. Roper’s proven operational efficiency contrasts sharply with Nano Nuclear’s lack of revenue and persistent losses. Investors seeking stable earnings and margin power will find Roper’s profile significantly more attractive.
Financial Ratios Comparison
These vital ratios act as a diagnostic tool to expose the underlying fiscal health, valuation premiums, and capital efficiency of the companies compared below:
| Ratios | Roper Technologies, Inc. (ROP) | Nano Nuclear Energy Inc (NNE) |
|---|---|---|
| ROE | 8.2% (2024) | -0.02% (2025) |
| ROIC | 5.5% (2024) | -0.02% (2025) |
| P/E | 36.0x (2024) | -36.5x (2025) |
| P/B | 2.95x (2024) | 0.007x (2025) |
| Current Ratio | 0.40 (2024) | 53.5 (2025) |
| Quick Ratio | 0.37 (2024) | 53.5 (2025) |
| D/E | 0.41 (2024) | 0.01 (2025) |
| Debt-to-Assets | 24.5% (2024) | 1.2% (2025) |
| Interest Coverage | 7.7x (2024) | 0x (2025) |
| Asset Turnover | 0.22 (2024) | 0 (2025) |
| Fixed Asset Turnover | 47.0 (2024) | 0 (2025) |
| Payout Ratio | 21% (2024) | 0% (2025) |
| Dividend Yield | 0.58% (2024) | 0% (2025) |
| Fiscal Year | 2024 | 2025 |
Efficiency & Valuation Duel: The Vital Signs
Financial ratios serve as a company’s DNA, unveiling operational strengths and hidden risks that shape investor decisions.
Roper Technologies, Inc.
Roper Technologies posts a solid net margin of 19.44%, indicating strong profitability, yet its ROE and ROIC stand at zero, signaling inefficiencies in capital use. The stock trades at a stretched P/E of 31.06, reflecting elevated valuation. It pays a modest dividend yield of 0.74%, favoring steady shareholder returns alongside ongoing R&D investments.
Nano Nuclear Energy Inc
Nano Nuclear Energy shows negative profitability metrics, including ROE and ROIC around -2%, reflecting operational losses. Despite a favorable P/E ratio of -36.49 and low price-to-book at 0.01, its current ratio is abnormally high at 53.48, suggesting liquidity distortion. The company does not pay dividends, likely reinvesting capital into growth or development.
Premium Valuation vs. Liquidity Anomaly
Roper trades at a premium with strong margins but capital efficiency concerns. Nano Nuclear suffers operational losses despite attractive valuation multiples and unusual liquidity. Roper fits investors seeking profitability with modest income, while Nano suits those tolerating high risk for potential turnaround gains.
Which one offers the Superior Shareholder Reward?
Roper Technologies (ROP) delivers a modest 0.74% dividend yield with a prudent 23% payout ratio, fully covered by free cash flow. Its disciplined buyback program further enhances returns. Nano Nuclear Energy (NNE) pays no dividends, focusing cash on R&D and capital expenditure, but negative free cash flow and no buybacks signal high risk. I find ROP’s balanced dividend and buyback strategy offers a more sustainable, superior total return profile for 2026 investors.
Comparative Score Analysis: The Strategic Profile
The radar chart reveals the fundamental DNA and trade-offs of both firms, highlighting their core financial strengths and weaknesses:
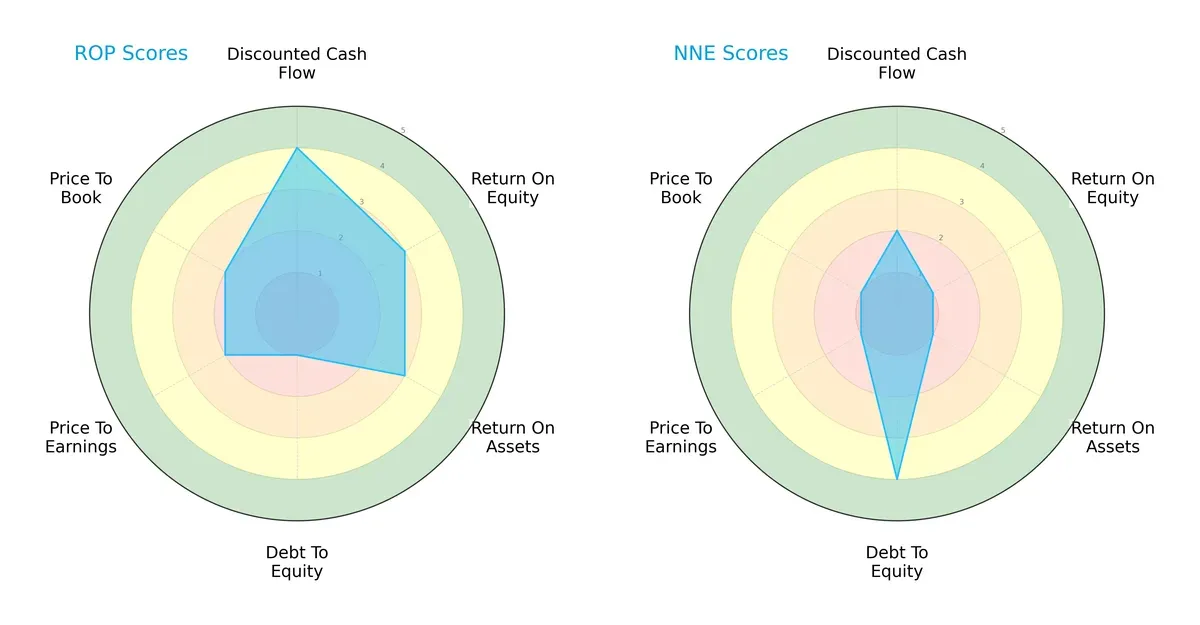
Roper Technologies shows balanced strength across DCF (4), ROE (3), and ROA (3), but a glaring weakness in debt-to-equity (1). Nano Nuclear Energy leans heavily on a strong debt position (4) but scores very low on profitability metrics (ROE 1, ROA 1) and valuation (P/E 1, P/B 1). Roper dominates with a more consistent profile, while Nano Nuclear’s edge is financial leverage, though it risks overreliance on debt.
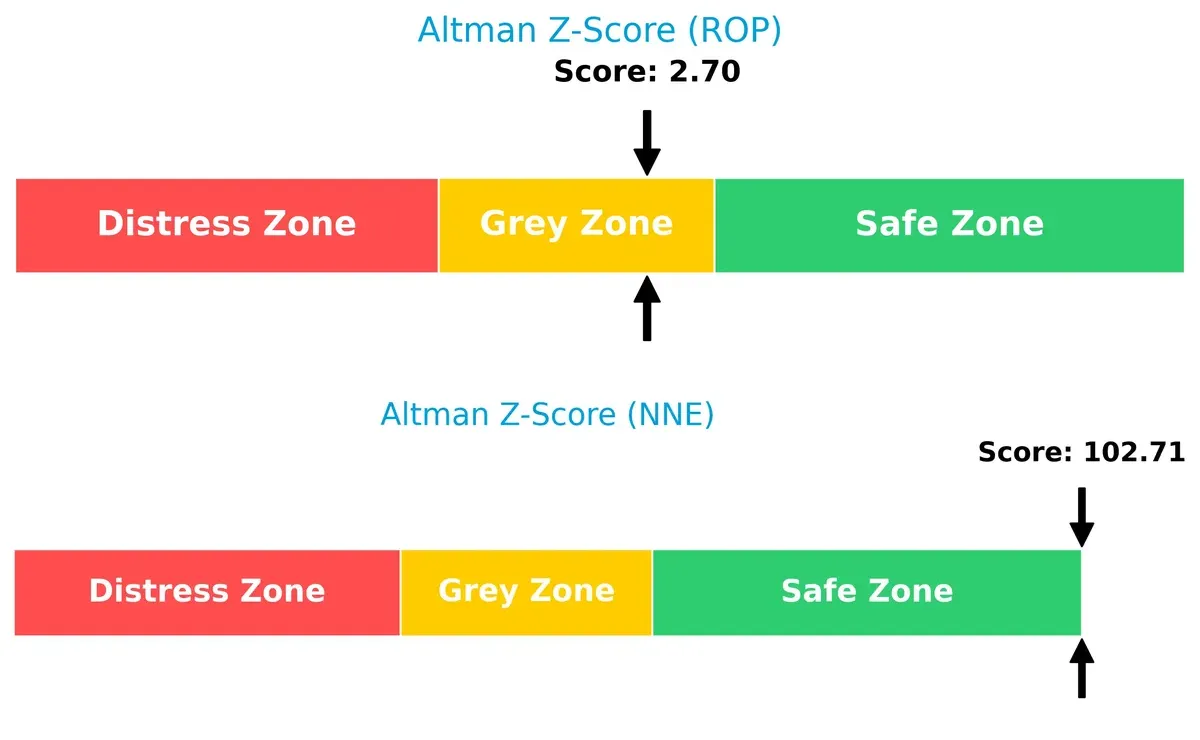
Bankruptcy Risk: Solvency Showdown
Roper’s Altman Z-Score of 2.7 places it in the grey zone, signaling moderate bankruptcy risk. Nano Nuclear’s exceptionally high score above 100 indicates it sits firmly in the safe zone, reflecting robust solvency and low default risk in this cycle:
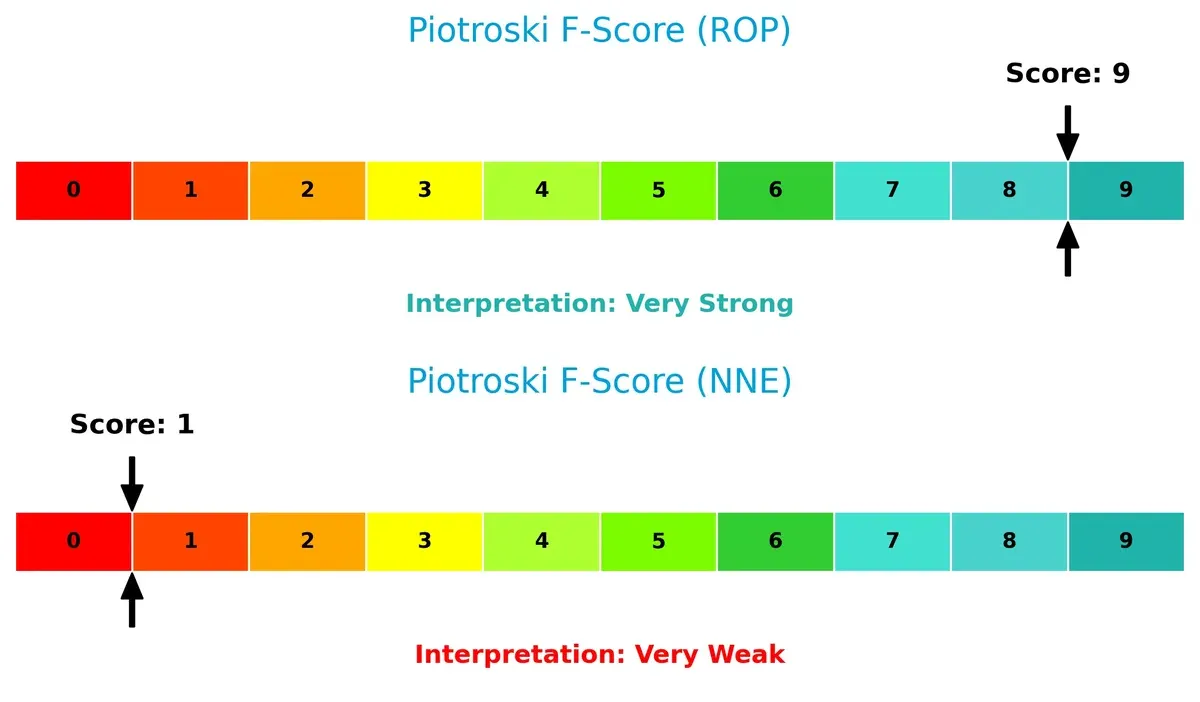
Financial Health: Quality of Operations
Roper scores a perfect 9 on the Piotroski F-Score, signaling peak financial health with strong profitability, liquidity, and operational efficiency. Nano Nuclear’s score of 1 flags severe internal weaknesses, indicating poor financial quality and potential red flags:
How are the two companies positioned?
This section dissects the operational DNA of Roper Technologies and Nano Nuclear Energy by comparing their revenue distribution and internal dynamics. The final objective is to confront their economic moats and identify which model offers the most resilient, sustainable competitive advantage today.
Revenue Segmentation: The Strategic Mix
This comparison dissects how Roper Technologies and Nano Nuclear Energy diversify income streams and where their primary sector bets lie:
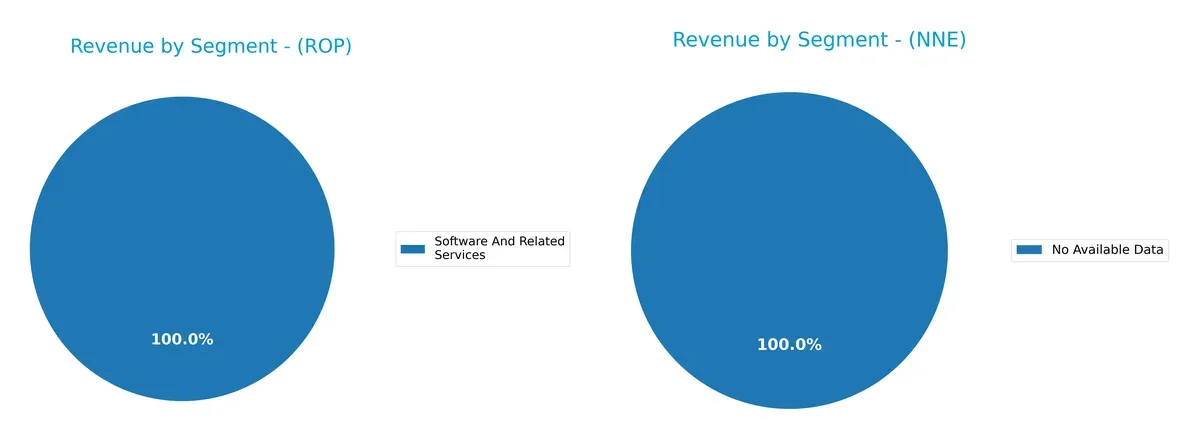
Roper Technologies anchors its revenue in software and related services, generating $10.7B in 2024. Its prior years show a balanced mix across application software, network software, and technology-enabled products, indicating solid diversification. Nano Nuclear Energy lacks available segmentation data, preventing direct comparison. Roper’s broad software ecosystem reduces concentration risk and supports infrastructure dominance, showcasing strategic resilience amid sector shifts.
Strengths and Weaknesses Comparison
This table compares the strengths and weaknesses of Roper Technologies, Inc. and Nano Nuclear Energy Inc:
Roper Technologies Strengths
- Diversified software and technology product segments
- Strong US market presence with multi-regional revenue
- Favorable net margin at 19.44%
- Low debt-to-assets ratio at 0%
- High interest coverage ratio at 6.96
Nano Nuclear Energy Strengths
- Favorable price-to-book ratio at 0.01
- Favorable price-to-earnings despite negative earnings
- Low debt-to-assets ratio at 1.22%
- Favorable quick ratio at 53.48
- Very low debt-to-equity ratio at 0.01
Roper Technologies Weaknesses
- Unfavorable ROE and ROIC at 0%
- Unavailable WACC data
- Unfavorable current and quick ratios at 0
- Unfavorable asset and fixed asset turnover
- Low dividend yield at 0.74%
- High P/E ratio at 31.06
Nano Nuclear Energy Weaknesses
- Negative net margin and returns (ROE and ROIC)
- Unfavorable WACC at 14.03%
- Unfavorable current ratio at 53.48
- Zero interest coverage ratio
- Negative dividend yield
- Unfavorable asset turnover ratios
Roper Technologies shows strength in diversified revenue streams and solid profitability metrics but faces challenges in asset efficiency and liquidity. Nano Nuclear Energy exhibits financial fragility with negative returns and coverage concerns despite some favorable valuation metrics. These contrasts highlight differing strategic and operational risk profiles.
The Moat Duel: Analyzing Competitive Defensibility
A durable structural moat protects long-term profits from relentless competition and market forces. Here’s how two industrial innovators match up:
Roper Technologies, Inc.: Diversified Intangible Assets Moat
Roper’s moat stems from its wide portfolio of specialized software and engineered products. This diversity supports stable margins near 28.6% EBIT and consistent revenue growth above 12% in 2025. New industry-specific cloud solutions should deepen its intangible asset moat, though margin pressures warrant caution.
Nano Nuclear Energy Inc: Emerging Technology Innovation Moat
Nano Nuclear’s moat relies on breakthrough microreactor technology, a stark contrast to Roper’s diversified base. Despite zero margins and negative cash flow, its rising ROIC signals improving operational efficiency. The company’s next-gen reactors could disrupt energy markets if commercialized by 2026, but execution risk remains high.
Moat Strength Battle: Diversification vs. Disruption Potential
Roper boasts a wider moat through diversified products and steady cash generation. Nano Nuclear shows a narrower but potentially deeper moat fueled by cutting-edge innovation. Roper is better positioned today to defend market share, while Nano Nuclear’s moat depends heavily on future technological success.
Which stock offers better returns?
Stock price movements over the past year reveal stark contrasts: Roper Technologies, Inc. faces a sustained decline, while Nano Nuclear Energy Inc surges with extraordinary gains before recent stabilization.
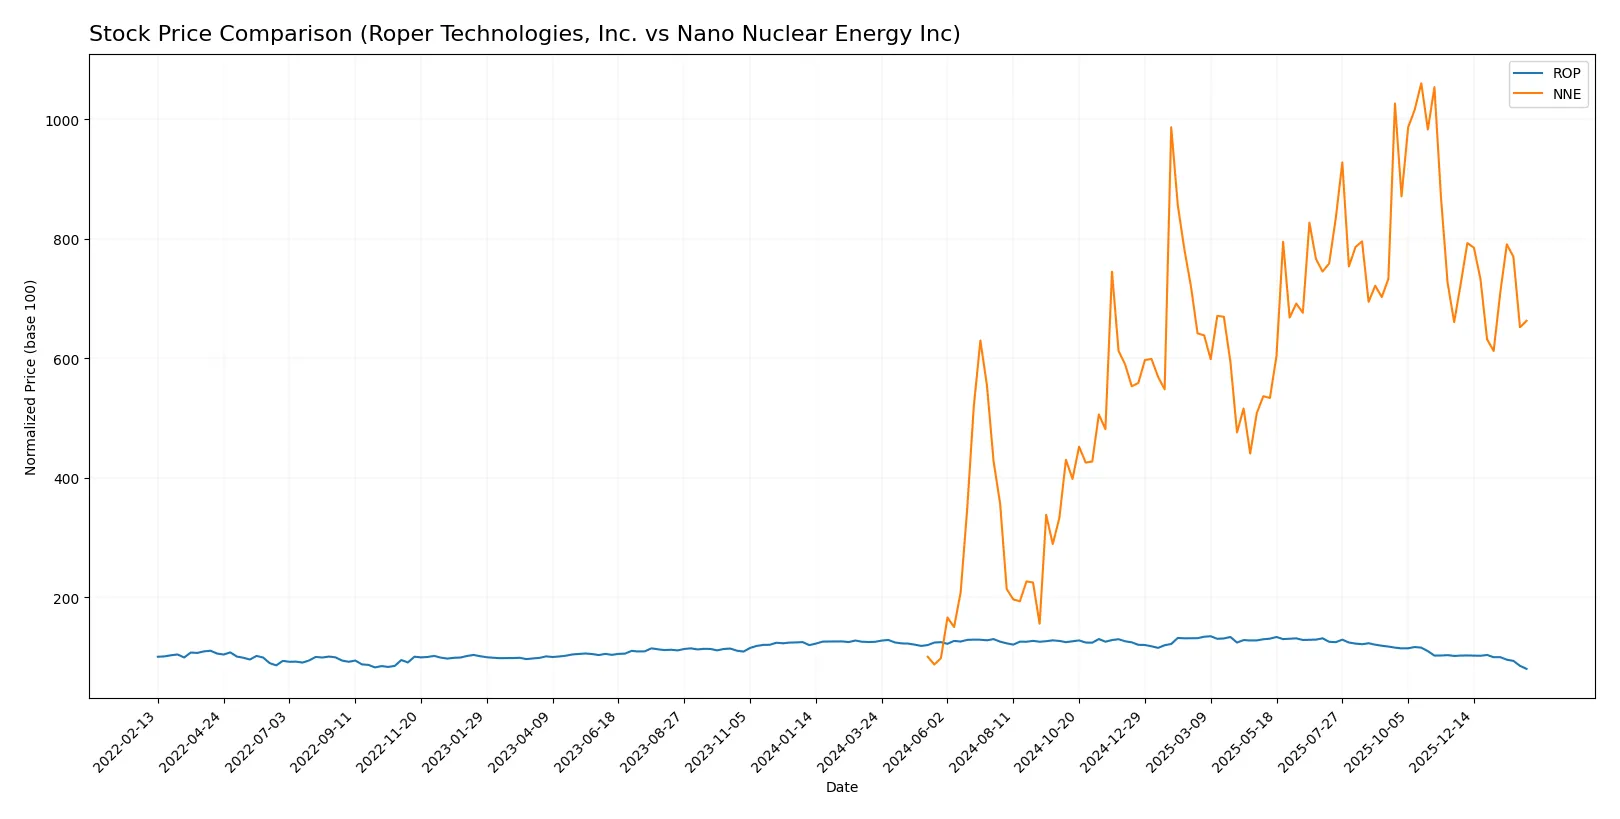
Trend Comparison
Roper Technologies, Inc. shows a bearish trend with a -36.27% price drop over 12 months. The decline decelerates, with recent losses narrowing to -21.39%.
Nano Nuclear Energy Inc exhibits a strong bullish trend, surging 562.75% over the past year. Despite deceleration, it maintains stable recent growth at 0.34%.
Nano Nuclear Energy Inc clearly outperforms Roper Technologies, delivering the highest market returns in the analyzed period.
Target Prices
Analysts present a clear consensus on target prices for Roper Technologies and Nano Nuclear Energy.
| Company | Target Low | Target High | Consensus |
|---|---|---|---|
| Roper Technologies, Inc. | 365 | 575 | 475.5 |
| Nano Nuclear Energy Inc | 50 | 50 | 50 |
The target consensus for Roper Technologies stands significantly above its current price of 349, implying strong upside potential. Nano Nuclear Energy’s consensus target of 50 also suggests substantial growth from its current price near 30.

Don’t Let Luck Decide Your Entry Point
Optimize your entry points with our advanced ProRealTime indicators. You’ll get efficient buy signals with precise price targets for maximum performance. Start outperforming now!
How do institutions grade them?
Roper Technologies, Inc. Grades
Below is a summary of recent grades assigned to Roper Technologies by major institutions:
| Grading Company | Action | New Grade | Date |
|---|---|---|---|
| Goldman Sachs | Maintain | Neutral | 2026-01-29 |
| Argus Research | Downgrade | Hold | 2026-01-28 |
| Mizuho | Maintain | Underperform | 2026-01-28 |
| RBC Capital | Maintain | Sector Perform | 2026-01-28 |
| Stifel | Downgrade | Hold | 2026-01-28 |
| Citigroup | Maintain | Buy | 2026-01-28 |
| JP Morgan | Maintain | Underweight | 2026-01-28 |
| Truist Securities | Maintain | Buy | 2026-01-28 |
| Barclays | Maintain | Underweight | 2026-01-28 |
| Oppenheimer | Downgrade | Perform | 2026-01-28 |
Nano Nuclear Energy Inc Grades
Here are the latest grades issued for Nano Nuclear Energy by recognized grading firms:
| Grading Company | Action | New Grade | Date |
|---|---|---|---|
| HC Wainwright & Co. | Maintain | Buy | 2025-08-19 |
| Ladenburg Thalmann | Downgrade | Sell | 2025-08-18 |
| HC Wainwright & Co. | Maintain | Buy | 2025-08-15 |
| HC Wainwright & Co. | Maintain | Buy | 2025-03-31 |
| HC Wainwright & Co. | Maintain | Buy | 2025-01-29 |
| HC Wainwright & Co. | Maintain | Buy | 2024-11-27 |
| Benchmark | Maintain | Buy | 2024-11-07 |
| Benchmark | Maintain | Buy | 2024-07-15 |
| Benchmark | Maintain | Buy | 2024-06-25 |
Which company has the best grades?
Nano Nuclear Energy consistently receives “Buy” ratings with few downgrades except one “Sell.” Roper Technologies shows mixed opinions with multiple “Hold” and “Underperform” grades. Nano Nuclear’s stronger consensus may influence investor confidence more positively.
Risks specific to each company
The following categories identify the critical pressure points and systemic threats facing both firms in the 2026 market environment:
1. Market & Competition
Roper Technologies, Inc.
- Established industrial machinery player with diversified software and hardware products faces intense competition from legacy and tech firms.
Nano Nuclear Energy Inc
- Emerging microreactor tech firm in a nascent market must overcome significant adoption and technological hurdles amid competition from established nuclear players.
2. Capital Structure & Debt
Roper Technologies, Inc.
- Favorable debt metrics with manageable interest coverage at 6.96; however, some ratios like current and quick ratios are weak or missing, raising liquidity concerns.
Nano Nuclear Energy Inc
- Low debt-to-equity and debt-to-assets ratios indicate conservative leverage, but zero interest coverage signals inability to service debt, reflecting early-stage funding risk.
3. Stock Volatility
Roper Technologies, Inc.
- Beta of 0.93 suggests stock moves roughly in line with the market, implying moderate volatility.
Nano Nuclear Energy Inc
- Elevated beta at 7.49 signals extreme stock price volatility, reflecting high risk and speculative nature.
4. Regulatory & Legal
Roper Technologies, Inc.
- Operates across multiple industrial sectors with regulatory complexity but benefits from established compliance frameworks.
Nano Nuclear Energy Inc
- Faces significant regulatory scrutiny and licensing challenges in nuclear technology development, increasing operational risk.
5. Supply Chain & Operations
Roper Technologies, Inc.
- Large, diversified operations with established supply chains but exposed to global industrial disruptions.
Nano Nuclear Energy Inc
- Very limited operational scale and resources create vulnerability to supply chain disruptions and operational bottlenecks.
6. ESG & Climate Transition
Roper Technologies, Inc.
- Industrial firm increasingly integrating ESG factors but must advance climate transition efforts amid regulatory pressures.
Nano Nuclear Energy Inc
- Positioned in clean energy nuclear sector, potentially benefiting from climate transition tailwinds but exposed to nuclear waste and safety controversies.
7. Geopolitical Exposure
Roper Technologies, Inc.
- Primarily US-based with moderate global exposure; geopolitical risks manageable but present in supply and regulatory environments.
Nano Nuclear Energy Inc
- Nuclear technology business faces heightened geopolitical risks tied to nuclear proliferation concerns and international policy shifts.
Which company shows a better risk-adjusted profile?
Roper Technologies faces moderate market and operational risks but benefits from stable cash flows and manageable debt servicing. Nano Nuclear Energy carries outsized risks from extreme stock volatility, regulatory hurdles, and operational infancy despite promising low leverage. The most impactful risk for Roper is its weak liquidity ratios, posing short-term financial stress. For Nano Nuclear, regulatory and operational risks dominate given its early-stage nuclear technology development. Roper’s Altman Z-score in the grey zone and very strong Piotroski score reflect solid financial health compared to Nano Nuclear’s safe zone Altman but very weak Piotroski score, signaling fragility. Overall, Roper exhibits a better risk-adjusted profile given its established operations and financial stability.
Final Verdict: Which stock to choose?
Roper Technologies, Inc. excels as a cash-generating industrial powerhouse with a proven ability to grow revenues steadily. Its strength lies in operational efficiency and strong income quality. However, its weak liquidity ratios pose a point of vigilance. Roper fits well in a portfolio targeting steady, industrial growth with moderate risk tolerance.
Nano Nuclear Energy Inc’s strategic moat is its potential in a cutting-edge, emerging sector with a rapidly expanding market presence. Its balance sheet shows strong liquidity and low leverage, offering a safety cushion relative to Roper. This stock is more suited to risk-tolerant investors seeking speculative upside and long-term innovation exposure.
If you prioritize stable cash flow and operational resilience, Roper Technologies is the compelling choice due to its industrial scale and income quality. However, if you seek high-growth potential with better liquidity and can tolerate volatility, Nano Nuclear Energy offers superior upside as an early-stage innovator. Both present analytical scenarios tailored to distinct investor profiles and risk appetites.
Disclaimer: Investment carries a risk of loss of initial capital. The past performance is not a reliable indicator of future results. Be sure to understand risks before making an investment decision.
Go Further
I encourage you to read the complete analyses of Roper Technologies, Inc. and Nano Nuclear Energy Inc to enhance your investment decisions: