In today’s evolving industrial landscape, Rockwell Automation, Inc. (ROK) and Nano Nuclear Energy Inc (NNE) stand out as compelling players in industrial machinery with distinct innovation approaches. Rockwell Automation leads with established automation and digital transformation solutions, while Nano Nuclear pioneers cutting-edge microreactor technology. Their shared sector but differing strategies make this comparison essential. Join me as we explore which company presents the most attractive investment opportunity for your portfolio.
Table of contents
Companies Overview
I will begin the comparison between Rockwell Automation, Inc. and Nano Nuclear Energy Inc by providing an overview of these two companies and their main differences.
Rockwell Automation Overview
Rockwell Automation, Inc. provides industrial automation and digital transformation solutions globally. The company operates through three segments: Intelligent Devices, Software & Control, and Lifecycle Services, offering hardware, software, and consulting services. Rockwell serves diverse markets including automotive, semiconductor, food and beverage, and renewable energy. Founded in 1903, it is headquartered in Milwaukee, Wisconsin, with a market cap of approximately 46B USD.
Nano Nuclear Energy Overview
Nano Nuclear Energy Inc is a microreactor technology firm focused on developing solid-core and low-pressure coolant reactors, alongside nuclear fuel fabrication and consultation services. Founded in 2021 and based in New York City, it operates with a small workforce of 5 employees. The company’s market cap stands near 1.3B USD, reflecting its emerging status in the industrial machinery sector with a specific focus on nuclear technology innovation.
Key similarities and differences
Both companies operate in the industrial machinery sector and are listed on major U.S. exchanges; Rockwell on NYSE and Nano Nuclear on NASDAQ. Rockwell Automation has a broad industrial automation portfolio and large market presence, while Nano Nuclear specializes in nuclear microreactors and related services with a high beta indicating greater volatility. Their business models differ significantly in scale, maturity, and technological focus, with Rockwell serving diverse industries and Nano Nuclear targeting advanced nuclear energy solutions.
Income Statement Comparison
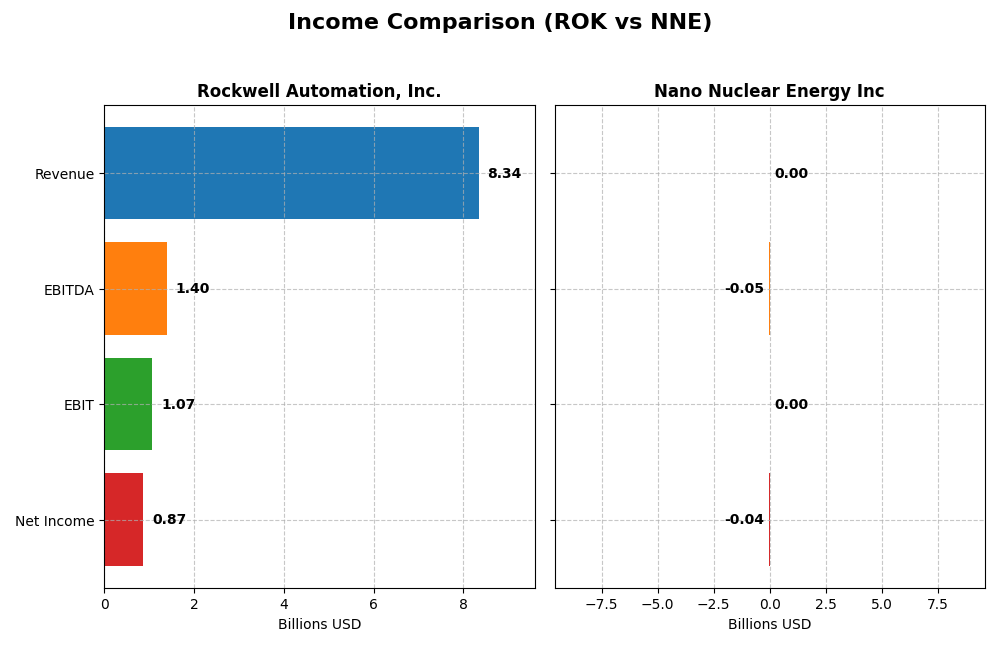
This table presents a side-by-side comparison of key income statement metrics for Rockwell Automation, Inc. and Nano Nuclear Energy Inc for their most recent fiscal year, 2025.
| Metric | Rockwell Automation, Inc. | Nano Nuclear Energy Inc |
|---|---|---|
| Market Cap | 46.1B | 1.33B |
| Revenue | 8.34B | 0 |
| EBITDA | 1.40B | -46.2M |
| EBIT | 1.07B | 0 |
| Net Income | 869M | -40.1M |
| EPS | 7.69 | -1.06 |
| Fiscal Year | 2025 | 2025 |
Income Statement Interpretations
Rockwell Automation, Inc.
Rockwell Automation’s revenue showed a steady increase from $7B in 2021 to $8.34B in 2025, reflecting a 19.22% growth over five years. However, net income declined by 36%, falling to $867M in 2025, with net margin shrinking by 46%. The latest year saw revenue growth slow to under 1%, gross margin improved to 48.14%, but EBIT and net margins contracted, indicating margin pressures despite stable top-line growth.
Nano Nuclear Energy Inc
Nano Nuclear Energy reported zero revenue from 2022 to 2025, reflecting its developmental stage. Operating losses deepened in absolute terms, with net income dropping substantially to a negative $40M in 2025. Margins remain unfavorable at zero percent due to absence of revenue, though some growth in EPS and EBIT was recorded from a low base. The company continues to incur research and operating expenses as it advances technological development.
Which one has the stronger fundamentals?
Rockwell Automation demonstrates stronger fundamentals with consistent revenue growth, positive gross and EBIT margins, and substantial scale at $8.3B revenue. Despite recent earnings pressure, its established business contrasts with Nano Nuclear’s pre-revenue status and persistent losses. Both companies have an overall unfavorable income statement evaluation, but Rockwell’s financial scale and margin structure are more robust relative to Nano Nuclear’s developmental phase and negative profitability.
Financial Ratios Comparison
This table presents the most recent financial ratios for Rockwell Automation, Inc. and Nano Nuclear Energy Inc as of fiscal year 2025, facilitating a clear side-by-side comparison.
| Ratios | Rockwell Automation, Inc. (ROK) | Nano Nuclear Energy Inc (NNE) |
|---|---|---|
| ROE | 23.8% | -18.0% |
| ROIC | 13.7% | -20.5% |
| P/E | 45.3 | -0.036 |
| P/B | 10.8 | 0.0066 |
| Current Ratio | 1.14 | 53.5 |
| Quick Ratio | 0.77 | 53.5 |
| D/E (Debt-to-Equity) | 1.00 | 0.013 |
| Debt-to-Assets | 32.5% | 1.22% |
| Interest Coverage | 9.12 | 0 |
| Asset Turnover | 0.74 | 0 |
| Fixed Asset Turnover | 6.95 | 0 |
| Payout Ratio | 68.0% | 0 |
| Dividend Yield | 1.50% | 0 |
Interpretation of the Ratios
Rockwell Automation, Inc.
Rockwell Automation exhibits mostly favorable profitability ratios, with a net margin of 10.42% and ROE at 23.78%, indicating strong earnings efficiency. However, high valuation multiples like a P/E of 45.33 and P/B of 10.78 are concerning. Liquidity ratios are mixed, with a neutral current ratio of 1.14 but an unfavorable quick ratio of 0.77. The company pays a dividend with a 1.5% yield, reflecting a stable payout supported by solid free cash flow coverage and moderate risk of over-distribution.
Nano Nuclear Energy Inc
Nano Nuclear Energy’s ratios indicate significant challenges, with negative ROE of -18% and ROIC of -20.51%, signaling losses and inefficient capital use. The company has a very high current ratio of 53.48, which is unfavorable and may reflect operational inefficiencies. Nano Nuclear does not pay dividends, which aligns with its negative profitability and ongoing investment in R&D and growth initiatives, typical for a microreactor technology developer in an early phase.
Which one has the best ratios?
Rockwell Automation shows a more favorable overall ratio profile, combining profitability, reasonable liquidity, and shareholder returns, despite some valuation concerns. In contrast, Nano Nuclear Energy’s ratios are largely unfavorable, reflecting its developmental stage and negative earnings. Based solely on ratio quality, Rockwell Automation presents stronger financial health and operational efficiency.
Strategic Positioning
This section compares the strategic positioning of Rockwell Automation and Nano Nuclear Energy, focusing on market position, key segments, and exposure to technological disruption:
Rockwell Automation, Inc.
- Well-established leader with large market cap and moderate competition pressure.
- Diverse industrial automation segments: Intelligent Devices, Software & Control, and Lifecycle Services drive revenue.
- Operates in traditional industrial sectors with digital transformation solutions; moderate technological disruption risks.
Nano Nuclear Energy Inc
- Smaller market cap with high beta indicating higher competitive pressure and volatility.
- Focused on microreactor technology and nuclear fuel fabrication, developing ZEUS and ODIN reactors.
- Positioned in emerging microreactor technology, exposed to high innovation and potential disruption in nuclear energy.
Rockwell Automation, Inc. vs Nano Nuclear Energy Inc Positioning
Rockwell exhibits a diversified industrial automation strategy across multiple segments, providing stable revenue streams. Nano Nuclear Energy pursues a concentrated approach in innovative microreactor development, with higher risk and growth potential. Each approach reflects distinct market and technological exposures.
Which has the best competitive advantage?
Rockwell Automation demonstrates a very favorable MOAT with growing ROIC above WACC, indicating strong value creation and durable competitive advantage. Nano Nuclear Energy shows a slightly unfavorable MOAT with negative ROIC versus WACC, signaling value destruction despite improving profitability.
Stock Comparison
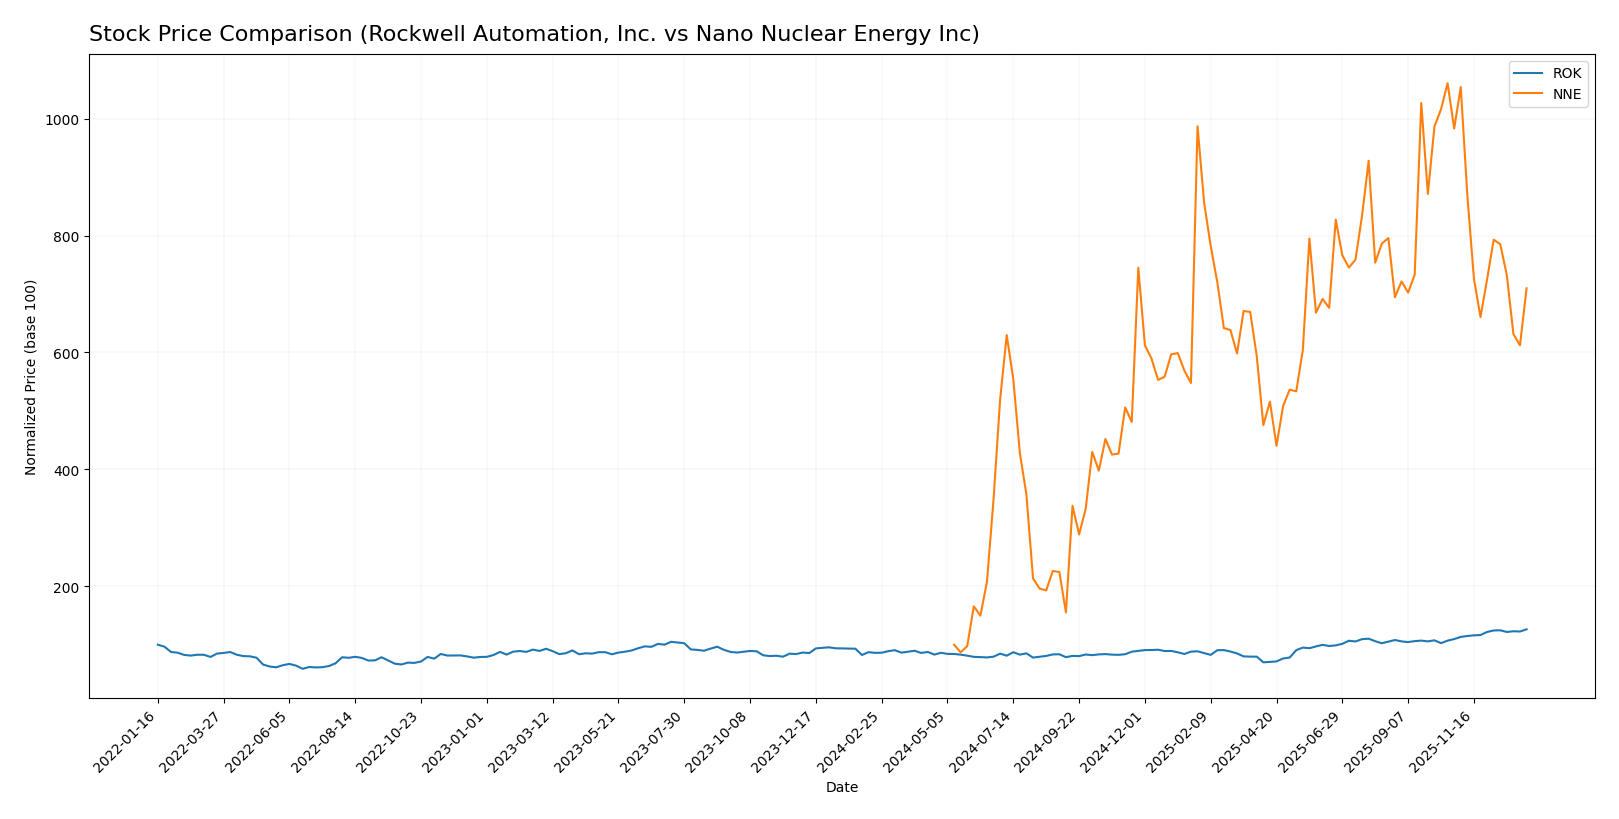
The stock price movements of Rockwell Automation, Inc. and Nano Nuclear Energy Inc over the past year reveal strong bullish trends for both, with notable acceleration and deceleration dynamics shaping their trading profiles.
Trend Analysis
Rockwell Automation, Inc. (ROK) experienced a 46.76% price increase over the past 12 months, indicating a bullish trend with acceleration. The stock showed high volatility with a 44.57 standard deviation and reached a high of 410.53.
Nano Nuclear Energy Inc (NNE) posted a remarkable 609.76% gain over the same period, confirming a bullish trend but with deceleration. Its volatility was lower at 10.81 standard deviation, and it peaked at 47.84. However, recent months saw a 27.81% decline.
Comparing both, NNE delivered the highest market performance over the year despite recent weakness; ROK presented a steadier acceleration with strong buyer dominance in trading volume.
Target Prices
Analysts present a clear target price consensus for both Rockwell Automation, Inc. and Nano Nuclear Energy Inc.
| Company | Target High | Target Low | Consensus |
|---|---|---|---|
| Rockwell Automation, Inc. | 470 | 380 | 421.57 |
| Nano Nuclear Energy Inc | 50 | 50 | 50 |
The target consensus for Rockwell Automation suggests moderate upside potential compared to its current price of 410.53 USD. Nano Nuclear Energy’s consistent target of 50 USD indicates analysts expect significant appreciation from its current 32.01 USD market price.
Analyst Opinions Comparison
This section compares analysts’ ratings and grades for Rockwell Automation, Inc. (ROK) and Nano Nuclear Energy Inc (NNE):
Rating Comparison
ROK Rating
- Rating: B-, evaluated as Very Favorable overall.
- Discounted Cash Flow Score: 3, rated Moderate.
- ROE Score: 5, rated Very Favorable for profitability.
- ROA Score: 4, rated Favorable for asset utilization.
- Debt To Equity Score: 1, rated Very Unfavorable risk.
- Overall Score: 3, rated Moderate overall performance.
NNE Rating
- Rating: C, evaluated as Very Favorable overall.
- Discounted Cash Flow Score: 2, rated Moderate.
- ROE Score: 1, rated Very Unfavorable for profitability.
- ROA Score: 1, rated Very Unfavorable for asset use.
- Debt To Equity Score: 5, rated Very Favorable risk.
- Overall Score: 2, rated Moderate overall performance.
Which one is the best rated?
Based strictly on the provided data, ROK has higher ratings in overall, discounted cash flow, ROE, and ROA scores, indicating stronger profitability and asset use. NNE scores better only in debt-to-equity, reflecting lower financial risk. Overall, ROK is better rated.
Scores Comparison
Here is a comparison of the Altman Z-Score and Piotroski Score for Rockwell Automation (ROK) and Nano Nuclear Energy (NNE):
ROK Scores
- Altman Z-Score: 5.32, indicating a safe financial zone.
- Piotroski Score: 8, reflecting very strong financial health.
NNE Scores
- Altman Z-Score: 143.56, indicating a safe financial zone.
- Piotroski Score: 2, reflecting very weak financial health.
Which company has the best scores?
Based on the provided data, NNE has a much higher Altman Z-Score, indicating strong financial safety, but a very weak Piotroski Score. ROK shows a balanced profile with a safe Altman Z-Score and a very strong Piotroski Score.
Grades Comparison
Here is a detailed comparison of the grades assigned to Rockwell Automation, Inc. and Nano Nuclear Energy Inc by reputable grading companies:
Rockwell Automation, Inc. Grades
The following table summarizes recent grades from well-known financial institutions:
| Grading Company | Action | New Grade | Date |
|---|---|---|---|
| Wells Fargo | Maintain | Equal Weight | 2026-01-07 |
| Barclays | Maintain | Overweight | 2026-01-07 |
| Goldman Sachs | Upgrade | Neutral | 2025-12-16 |
| Jefferies | Maintain | Buy | 2025-12-10 |
| Citigroup | Maintain | Buy | 2025-12-08 |
| Barclays | Maintain | Overweight | 2025-12-04 |
| Baird | Maintain | Outperform | 2025-11-21 |
| B of A Securities | Maintain | Buy | 2025-11-20 |
| JP Morgan | Maintain | Neutral | 2025-11-11 |
| Morgan Stanley | Maintain | Overweight | 2025-11-10 |
Rockwell Automation’s grades show a consistent pattern of “Buy,” “Overweight,” and “Neutral” ratings, with a recent upgrade from “Sell” to “Neutral” by Goldman Sachs.
Nano Nuclear Energy Inc Grades
The following table presents grades from recognized financial analysts:
| Grading Company | Action | New Grade | Date |
|---|---|---|---|
| HC Wainwright & Co. | Maintain | Buy | 2025-08-19 |
| Ladenburg Thalmann | Downgrade | Sell | 2025-08-18 |
| HC Wainwright & Co. | Maintain | Buy | 2025-08-15 |
| HC Wainwright & Co. | Maintain | Buy | 2025-03-31 |
| HC Wainwright & Co. | Maintain | Buy | 2025-01-29 |
| HC Wainwright & Co. | Maintain | Buy | 2024-11-27 |
| Benchmark | Maintain | Buy | 2024-11-07 |
| Benchmark | Maintain | Buy | 2024-07-15 |
| Benchmark | Maintain | Buy | 2024-06-25 |
Nano Nuclear Energy’s grades are predominantly “Buy,” with one notable “Sell” downgrade by Ladenburg Thalmann.
Which company has the best grades?
Rockwell Automation, Inc. has a broad consensus around “Hold” with many “Buy” and “Overweight” ratings, while Nano Nuclear Energy Inc shows a stronger “Buy” consensus despite a single downgrade. Investors might interpret Rockwell’s mixed grades as moderate confidence, whereas Nano Nuclear’s grades suggest higher conviction tempered by some caution.
Strengths and Weaknesses
Below is a comparison of key strengths and weaknesses for Rockwell Automation, Inc. (ROK) and Nano Nuclear Energy Inc (NNE) based on their latest financial and operational data.
| Criterion | Rockwell Automation, Inc. (ROK) | Nano Nuclear Energy Inc (NNE) |
|---|---|---|
| Diversification | Strong product segmentation with three main revenue streams: Intelligent Devices ($3.76B), Lifecycle Services ($2.2B), Software and Control ($2.38B) | Limited diversification, focused on nuclear energy technology development with no reported revenue segmentation |
| Profitability | Favorable profitability metrics: net margin 10.42%, ROE 23.78%, ROIC 13.71% | Unfavorable profitability: net margin 0%, ROE -18%, ROIC -20.51% |
| Innovation | Consistent investment in software and control solutions supporting industrial automation | Emerging tech with growing ROIC, but still value destroying overall |
| Global presence | Established global player with durable competitive advantage and increasing profitability | Smaller footprint, early-stage with limited global presence |
| Market Share | Significant presence in industrial automation markets with durable economic moat | Niche player in nuclear innovation, market share currently minimal |
Key takeaways: Rockwell Automation demonstrates robust diversification, strong profitability, and a durable competitive advantage, making it a more stable investment. Nano Nuclear Energy shows promise with improving profitability trends but remains a higher risk due to ongoing value destruction and limited market footprint.
Risk Analysis
Below is a comparative table of key risks for Rockwell Automation, Inc. (ROK) and Nano Nuclear Energy Inc (NNE) based on the most recent data from 2025.
| Metric | Rockwell Automation, Inc. (ROK) | Nano Nuclear Energy Inc (NNE) |
|---|---|---|
| Market Risk | Beta 1.52 indicates moderate market volatility. | Beta 7.49 reflects very high market volatility. |
| Debt level | Debt-to-equity ratio neutral at 1.0; moderate leverage. | Very low debt-to-equity of 0.01; minimal leverage. |
| Regulatory Risk | Moderate; industrial automation faces standards and export controls. | High; nuclear technology is highly regulated and subject to stringent approvals. |
| Operational Risk | Established operations with 27K employees; moderate operational complexity. | Early-stage, small team (5 employees); high operational uncertainty. |
| Environmental Risk | Moderate; exposure to eco-industrial sectors but with sustainability focus. | High; nuclear technology involves stringent environmental and safety concerns. |
| Geopolitical Risk | Moderate; global supply chains and markets. | Elevated; nuclear energy sensitive to geopolitical tensions and export restrictions. |
In summary, NNE carries higher regulatory, environmental, geopolitical, and market risks due to its nuclear technology focus, nascent stage, and extreme volatility. ROK shows moderate risk levels with established operations but faces typical industrial market and regulatory challenges. For cautious investors, ROK appears more stable, while NNE offers higher risk and potential reward with significant uncertainties.
Which Stock to Choose?
Rockwell Automation, Inc. (ROK) shows mixed income evolution with favorable profitability and return metrics despite recent declines in net margin and EPS. Its debt levels are moderate and financial ratios are slightly favorable, supported by a very favorable rating and a very strong financial health score.
Nano Nuclear Energy Inc (NNE) displays unfavorable income trends and financial ratios, including negative returns on equity and invested capital. While it has a very favorable overall rating mainly due to low debt, its profitability metrics are weak and financial health scores indicate very weak fundamentals.
Investors with a preference for stability and durable competitive advantages might find ROK’s very favorable rating and value-creating moat more aligned with their profile, whereas those with a higher risk tolerance and interest in potentially high-reward growth, despite unfavorable profitability, could interpret NNE’s profile differently given its volatile price gains and weaker fundamentals.
Disclaimer: Investment carries a risk of loss of initial capital. The past performance is not a reliable indicator of future results. Be sure to understand risks before making an investment decision.
Go Further
I encourage you to read the complete analyses of Rockwell Automation, Inc. and Nano Nuclear Energy Inc to enhance your investment decisions: