In today’s rapidly evolving industrial landscape, Parsons Corporation and Nano Nuclear Energy Inc stand out for their innovative approaches to complex challenges. Parsons, a seasoned leader in defense and critical infrastructure, contrasts with Nano Nuclear Energy, a pioneer in microreactor technology. Both operate within the industrial machinery sector but pursue distinct innovation strategies. This article will help you decide which company offers the most compelling investment opportunity in 2026.
Table of contents
Companies Overview
I will begin the comparison between Parsons Corporation and Nano Nuclear Energy Inc by providing an overview of these two companies and their main differences.
Parsons Overview
Parsons Corporation focuses on integrated solutions and services in defense, intelligence, and critical infrastructure markets across North America, the Middle East, and internationally. Founded in 1944 and headquartered in Centreville, Virginia, it operates through Federal Solutions and Critical Infrastructure segments, offering cybersecurity, geospatial intelligence, missile defense, and infrastructure engineering services. Parsons employs approximately 20,000 people and is listed on the NYSE with a market cap of 7.47B USD.
Nano Nuclear Energy Overview
Nano Nuclear Energy Inc, founded in 2021 and based in New York City, develops microreactor technology including solid-core battery reactors and low-pressure coolant reactors. The company also focuses on nuclear fuel fabrication, transportation, and consultation services. With a team of 5 employees, Nano Nuclear trades on the NASDAQ and has a market cap of 1.33B USD, reflecting its emerging position in the industrial machinery sector.
Key similarities and differences
Both Parsons and Nano Nuclear operate within the industrial machinery sector in the US, emphasizing innovative technologies. Parsons offers diversified defense and infrastructure services with a large workforce and established market presence. In contrast, Nano Nuclear is a smaller, specialized firm developing advanced nuclear reactors and fuel solutions, indicating a focus on niche technology within the energy segment. Their business models differ significantly in scale, scope, and maturity.
Income Statement Comparison
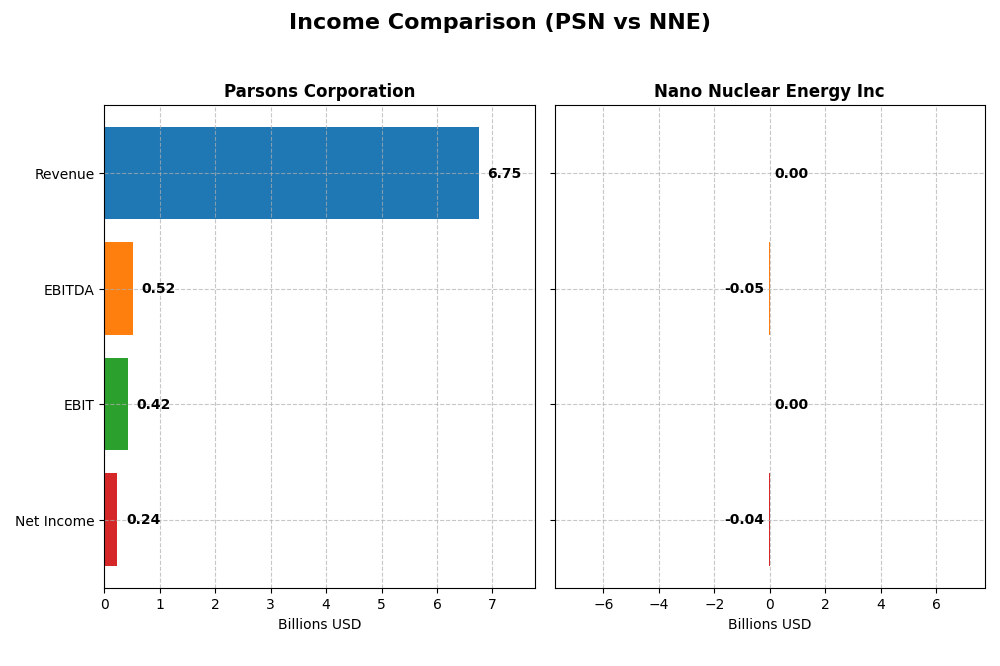
This table presents a side-by-side comparison of key income statement metrics for Parsons Corporation and Nano Nuclear Energy Inc for their most recent fiscal years.
| Metric | Parsons Corporation (PSN) | Nano Nuclear Energy Inc (NNE) |
|---|---|---|
| Market Cap | 7.47B | 1.33B |
| Revenue | 6.75B | 0 |
| EBITDA | 518M | -46M |
| EBIT | 419M | 0 |
| Net Income | 238M | 0 |
| EPS | 2.21 | -1.06 |
| Fiscal Year | 2024 | 2025 |
Income Statement Interpretations
Parsons Corporation
Parsons Corporation demonstrated strong growth in revenue and net income from 2020 to 2024, with revenue rising from $3.9B to $6.75B and net income increasing from $98.5M to $238M. Margins showed resilience, with a gross margin of 20.83% and a stable net margin near 3.5%. The 2024 fiscal year marked a significant growth acceleration, with revenue up 24% and net income up 49%, reflecting improved operational efficiency and profitability.
Nano Nuclear Energy Inc
Nano Nuclear Energy Inc reported no revenue from 2022 through 2025, incurring increasing operating losses, with net income declining to -$40M in 2025. Margins remain unfavorable, as the company is primarily in a development phase with no sales, reflected in zero gross and net margins. Despite losses, certain non-operating gains and rising EPS from negative values indicate some operational improvements, but financial fundamentals remain weak.
Which one has the stronger fundamentals?
Parsons Corporation exhibits stronger fundamentals, driven by consistent revenue growth, positive net income, and favorable margin trends over the reviewed period. Conversely, Nano Nuclear Energy’s financials are characterized by persistent losses and absent revenues, reflecting early-stage development risks. The contrast highlights Parsons’ established profitability against Nano Nuclear’s ongoing investment phase with uncertain near-term returns.
Financial Ratios Comparison
The table below presents a side-by-side comparison of key financial ratios for Parsons Corporation (PSN) and Nano Nuclear Energy Inc (NNE) based on their most recent fiscal year data.
| Ratios | Parsons Corporation (PSN) 2024 | Nano Nuclear Energy Inc (NNE) 2025 |
|---|---|---|
| ROE | 9.7% | -18.0% |
| ROIC | 8.3% | -20.5% |
| P/E | 41.7 | -0.04 |
| P/B | 4.06 | 0.007 |
| Current Ratio | 1.29 | 53.48 |
| Quick Ratio | 1.29 | 53.48 |
| D/E (Debt-to-Equity) | 0.59 | 0.01 |
| Debt-to-Assets | 25.9% | 1.2% |
| Interest Coverage | 8.3 | 0 |
| Asset Turnover | 1.23 | 0 |
| Fixed Asset Turnover | 25.5 | 0 |
| Payout Ratio | 0% | 0% |
| Dividend Yield | 0% | 0% |
Interpretation of the Ratios
Parsons Corporation
Parsons Corporation shows a mixed ratio profile with a slightly favorable global opinion. While its return on equity (9.73%) and net margin (3.48%) are unfavorable, the company benefits from a favorable weighted average cost of capital (6.17%) and strong asset turnover ratios. Parsons does not pay dividends, reflecting either a reinvestment strategy or focus on operational growth without shareholder payouts.
Nano Nuclear Energy Inc
Nano Nuclear Energy displays predominantly unfavorable ratios, with negative returns on equity (-18.0%) and invested capital (-20.51%). Despite very low price-to-book and price-to-earnings ratios, its extremely high current and quick ratios indicate significant liquidity, though the interest coverage is zero. The company does not pay dividends, likely due to ongoing development and reinvestment in its high-growth microreactor technology.
Which one has the best ratios?
Parsons Corporation holds the superior ratio profile, supported by several favorable metrics such as asset turnover and interest coverage, despite some weaknesses in profitability. Nano Nuclear Energy faces greater financial challenges, with mostly unfavorable returns and liquidity ratios, reflecting its early-stage status and high risk.
Strategic Positioning
This section compares the strategic positioning of Parsons Corporation and Nano Nuclear Energy Inc, including Market position, Key segments, and disruption:
Parsons Corporation
- Established player with $7.47B market cap and moderate beta
- Focused on defense, intelligence, critical infrastructure
- Engages in integrated cybersecurity, space, missile defense
Nano Nuclear Energy Inc
- Smaller firm with $1.33B market cap and high beta indicating risk
- Developing microreactor technology and nuclear fuel fabrication
- Exposure to technological disruption from advanced nuclear tech
Parsons Corporation vs Nano Nuclear Energy Inc Positioning
Parsons is diversified across federal and critical infrastructure sectors with established contracts, while Nano Nuclear Energy is concentrated on innovative microreactors and fuel supply. Parsons benefits from scale and stability; Nano Nuclear shows growth potential but higher risk.
Which has the best competitive advantage?
Parsons demonstrates a very favorable moat with value creation and growing ROIC, indicating durable competitive advantage. Nano Nuclear shows slightly unfavorable moat status, shedding value despite increasing profitability, implying a weaker competitive position.
Stock Comparison
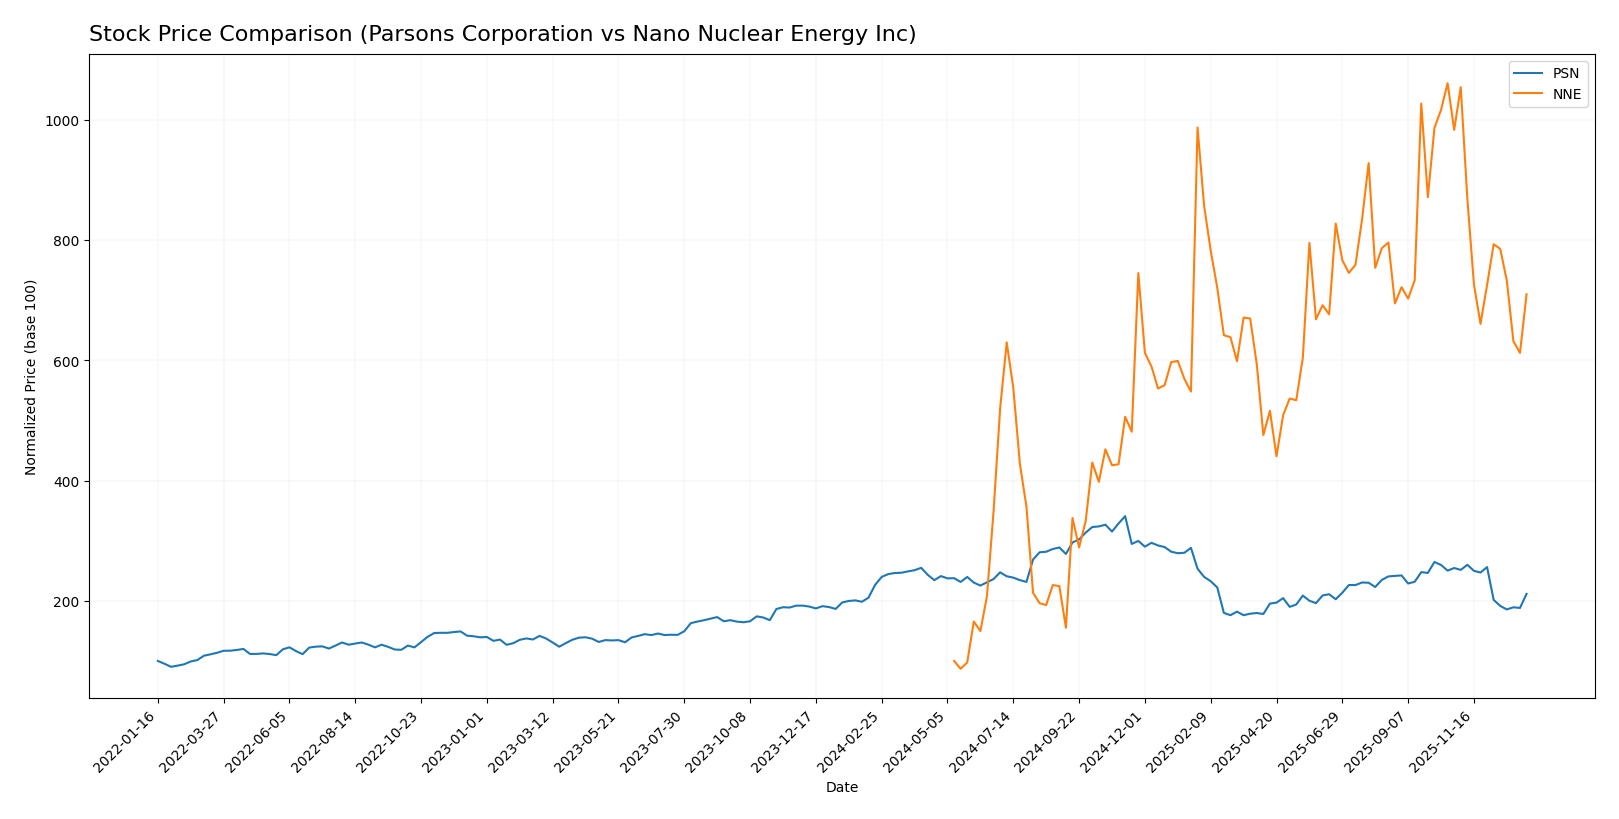
The stock price movements over the past 12 months reveal a clear divergence, with Parsons Corporation experiencing a bearish trend marked by a gradual deceleration, while Nano Nuclear Energy Inc shows a strong bullish trajectory despite recent downward pressure.
Trend Analysis
Parsons Corporation’s stock declined by 6.64% over the past year, indicating a bearish trend with decelerating momentum. The price ranged between 58.22 and 112.69, showing high volatility with a standard deviation of 12.98.
Nano Nuclear Energy Inc’s stock surged by 609.76% over the same period, confirming a bullish trend despite deceleration. The stock exhibited substantial volatility, with prices ranging from 3.92 to 47.84 and a standard deviation of 10.81.
Comparing the two, Nano Nuclear Energy delivered the highest market performance with a strong bullish trend, whereas Parsons Corporation experienced a bearish trend with moderate price decline.
Target Prices
Analysts present a moderate target consensus for Parsons Corporation and a firm target for Nano Nuclear Energy Inc.
| Company | Target High | Target Low | Consensus |
|---|---|---|---|
| Parsons Corporation | 107 | 70 | 85 |
| Nano Nuclear Energy Inc | 50 | 50 | 50 |
The target consensus for Parsons at $85 suggests upside potential versus its current price near $70, indicating cautious optimism. Nano Nuclear Energy’s consistent target at $50 implies expected appreciation from its current price around $32.
Analyst Opinions Comparison
This section compares analysts’ ratings and grades for Parsons Corporation and Nano Nuclear Energy Inc:
Rating Comparison
Parsons Corporation Rating
- Rating: A- indicating a very favorable overall assessment.
- Discounted Cash Flow Score: 5, very favorable valuation.
- ROE Score: 4, favorable profit generation from equity.
- ROA Score: 4, favorable asset utilization efficiency.
- Debt To Equity Score: 2, moderate financial risk.
- Overall Score: 4, favorable financial standing.
Nano Nuclear Energy Inc Rating
- Rating: C reflecting a very unfavorable overall assessment.
- Discounted Cash Flow Score: 2, moderate valuation.
- ROE Score: 1, very unfavorable profit generation.
- ROA Score: 1, very unfavorable asset utilization.
- Debt To Equity Score: 5, very favorable financial risk.
- Overall Score: 2, moderate financial standing.
Which one is the best rated?
Parsons Corporation is better rated overall with an A- rating and favorable scores in DCF, ROE, ROA, and overall financial standing. Nano Nuclear Energy has lower ratings and mostly unfavorable scores except for strong debt-to-equity risk management.
Scores Comparison
Here is a comparison of the Altman Z-Score and Piotroski Score for Parsons Corporation and Nano Nuclear Energy Inc:
Parsons Corporation Scores
- Altman Z-Score: 3.59, in the safe zone indicating low bankruptcy risk.
- Piotroski Score: 6, reflecting average financial strength.
Nano Nuclear Energy Inc Scores
- Altman Z-Score: 143.56, in the safe zone indicating very low bankruptcy risk.
- Piotroski Score: 2, indicating very weak financial strength.
Which company has the best scores?
Based strictly on the provided data, Nano Nuclear Energy Inc has a much higher Altman Z-Score, suggesting stronger bankruptcy safety. Parsons Corporation shows a better Piotroski Score, indicating comparatively stronger financial health.
Grades Comparison
Here is a detailed comparison of the latest grades assigned to Parsons Corporation and Nano Nuclear Energy Inc:
Parsons Corporation Grades
The table below summarizes recent grades from recognized grading companies for Parsons Corporation:
| Grading Company | Action | New Grade | Date |
|---|---|---|---|
| B of A Securities | Maintain | Buy | 2025-12-30 |
| Stifel | Maintain | Buy | 2025-12-23 |
| Jefferies | Maintain | Hold | 2025-12-11 |
| TD Cowen | Upgrade | Buy | 2025-12-10 |
| Baird | Maintain | Outperform | 2025-12-08 |
| Truist Securities | Maintain | Buy | 2025-12-08 |
| Keybanc | Maintain | Overweight | 2025-12-08 |
| Truist Securities | Maintain | Buy | 2025-12-05 |
| William Blair | Upgrade | Outperform | 2025-11-20 |
| Keybanc | Maintain | Overweight | 2025-10-20 |
Parsons Corporation’s grades show a consistent buy and outperform consensus with some upgrades noted recently.
Nano Nuclear Energy Inc Grades
The table below summarizes recent grades from recognized grading companies for Nano Nuclear Energy Inc:
| Grading Company | Action | New Grade | Date |
|---|---|---|---|
| HC Wainwright & Co. | Maintain | Buy | 2025-08-19 |
| Ladenburg Thalmann | Downgrade | Sell | 2025-08-18 |
| HC Wainwright & Co. | Maintain | Buy | 2025-08-15 |
| HC Wainwright & Co. | Maintain | Buy | 2025-03-31 |
| HC Wainwright & Co. | Maintain | Buy | 2025-01-29 |
| HC Wainwright & Co. | Maintain | Buy | 2024-11-27 |
| Benchmark | Maintain | Buy | 2024-11-07 |
| Benchmark | Maintain | Buy | 2024-07-15 |
| Benchmark | Maintain | Buy | 2024-06-25 |
Nano Nuclear Energy Inc’s grades are mainly buy ratings with a single recent downgrade to sell, indicating some divergence in analyst views.
Which company has the best grades?
Parsons Corporation has received a stronger and more consistent set of buy and outperform grades compared to Nano Nuclear Energy Inc, which shows mostly buy ratings but also a notable recent downgrade to sell. This disparity reflects a higher consensus confidence for Parsons, potentially influencing investor sentiment towards greater stability and positive outlook for Parsons.
Strengths and Weaknesses
Below is a comparison of key strengths and weaknesses for Parsons Corporation (PSN) and Nano Nuclear Energy Inc (NNE) based on the latest financial and strategic data.
| Criterion | Parsons Corporation (PSN) | Nano Nuclear Energy Inc (NNE) |
|---|---|---|
| Diversification | Strong, with significant revenue from Critical Infrastructure (2.74B USD) and Federal Solutions (4.01B USD) segments. | Limited data available; business focused on emerging nuclear tech. |
| Profitability | Moderate profitability: ROIC 8.28% (neutral), net margin 3.48% (unfavorable). | Negative profitability: ROIC -20.51%, net margin 0%, ROE -18%. |
| Innovation | Established player with steady ROIC growth (80.5%), showing durable competitive advantage. | Growing ROIC trend (59.2%) but still value destroying, indicating early-stage innovation risks. |
| Global presence | Well-established global infrastructure and federal contracts. | Likely limited global footprint at this stage. |
| Market Share | Solid market share in critical infrastructure and federal sectors. | Small or emerging market share in a niche segment. |
Key takeaways: Parsons Corporation demonstrates a stable and diversified business with a durable competitive advantage, though profitability margins are modest. Nano Nuclear Energy shows promising innovation growth but currently suffers from value destruction and low profitability, reflecting higher investment risk. Careful risk management is advised when considering NNE.
Risk Analysis
Below is a comparative risk table for Parsons Corporation (PSN) and Nano Nuclear Energy Inc (NNE) based on the most recent data from 2024-2025.
| Metric | Parsons Corporation (PSN) | Nano Nuclear Energy Inc (NNE) |
|---|---|---|
| Market Risk | Moderate (Beta 0.66, stable sector) | High (Beta 7.49, volatile microreactor tech) |
| Debt Level | Moderate (D/E 0.59, favorable debt to assets 25.9%) | Very Low (D/E 0.01, 1.22% debt to assets) |
| Regulatory Risk | Elevated (Defense, cybersecurity, infrastructure sectors) | High (Nuclear energy development, regulatory scrutiny) |
| Operational Risk | Moderate (20K employees, diversified projects) | High (Small team, early-stage technology) |
| Environmental Risk | Moderate (Projects include environmental solutions) | High (Nuclear fuel fabrication and microreactors) |
| Geopolitical Risk | Moderate (US and Middle East operations) | Moderate (US-based, but nuclear sector sensitive) |
Synthesizing these risks: Nano Nuclear Energy faces the most significant challenges due to high market volatility, regulatory hurdles in nuclear tech, and operational infancy, despite a very low debt burden. Parsons shows moderate risks with stable financials, but geopolitical and regulatory factors in defense and infrastructure remain impactful. Investors should weigh Nano Nuclear’s potential against its elevated risk profile.
Which Stock to Choose?
Parsons Corporation (PSN) shows a favorable income evolution with revenue growth of 24% in 2024 and a very favorable long-term trend. Its financial ratios are slightly favorable overall, despite some unfavorable metrics like net margin and ROE near 10%. Profitability is moderate with a 3.48% net margin, and debt levels are manageable, supported by a favorable interest coverage and a net debt to EBITDA of 1.87. Its credit rating is very favorable (A-), reflecting solid financial health.
Nano Nuclear Energy Inc (NNE) displays an unfavorable income evolution with zero revenue growth in 2025 and predominantly negative profitability metrics. The company’s financial ratios are mostly unfavorable, including negative ROE and ROIC, although it benefits from very low debt levels and a strong quick ratio. The rating is very favorable (C) mainly due to low leverage, but operational profitability and cash flow remain weak, indicating value destruction despite some improvement in ROIC trends.
For investors, PSN might appear more favorable due to its strong income growth, positive profitability, and very favorable rating, suggesting quality and value creation. In contrast, NNE’s profile could appeal to risk-tolerant investors seeking potential turnaround opportunities, given its improving ROIC trend but overall unfavorable financials. The choice may depend on whether an investor prioritizes stable value creation or speculative growth potential.
Disclaimer: Investment carries a risk of loss of initial capital. The past performance is not a reliable indicator of future results. Be sure to understand risks before making an investment decision.
Go Further
I encourage you to read the complete analyses of Parsons Corporation and Nano Nuclear Energy Inc to enhance your investment decisions: