Home > Comparison > Industrials > PH vs NNE
The strategic rivalry between Parker-Hannifin Corporation and Nano Nuclear Energy Inc shapes the future of industrial machinery. Parker-Hannifin is a capital-intensive industrial giant with diversified segments in motion and control technologies. In contrast, Nano Nuclear Energy is a high-growth microreactor technology startup focused on nuclear innovation. This analysis will assess which corporate trajectory offers superior risk-adjusted returns for a diversified portfolio amid evolving industrial demands.
Table of contents
Companies Overview
Parker-Hannifin and Nano Nuclear Energy stand as pivotal players shaping industrial machinery’s future.
Parker-Hannifin Corporation: Industrial Motion and Control Leader
Parker-Hannifin dominates with motion and control technologies serving mobile, industrial, and aerospace sectors globally. Its revenue stems from diversified industrial components and aerospace systems, focusing on sealing, filtration, and hydraulic controls. In 2026, it emphasizes expanding advanced systems for aerospace and industrial machinery, leveraging deep OEM relationships to cement its market position.
Nano Nuclear Energy Inc: Emerging Microreactor Innovator
Nano Nuclear Energy pioneers microreactor technology with solid-core and low-pressure coolant reactors. Its revenue model revolves around developing ZEUS and ODIN reactors and uranium fuel fabrication. The company’s 2026 strategy targets advancing nuclear fuel supply and consultation services, positioning itself as a cutting-edge energy innovator despite its nascent scale and high market volatility.
Strategic Collision: Similarities & Divergences
Both firms operate in industrial machinery but diverge sharply: Parker-Hannifin relies on a broad, established product portfolio and OEM partnerships, while Nano Nuclear Energy pursues disruptive nuclear innovation. Their primary battleground is technology leadership within industrial applications versus energy innovation. These differences create distinct investment profiles: a stable industrial giant versus a high-beta, early-stage tech player.
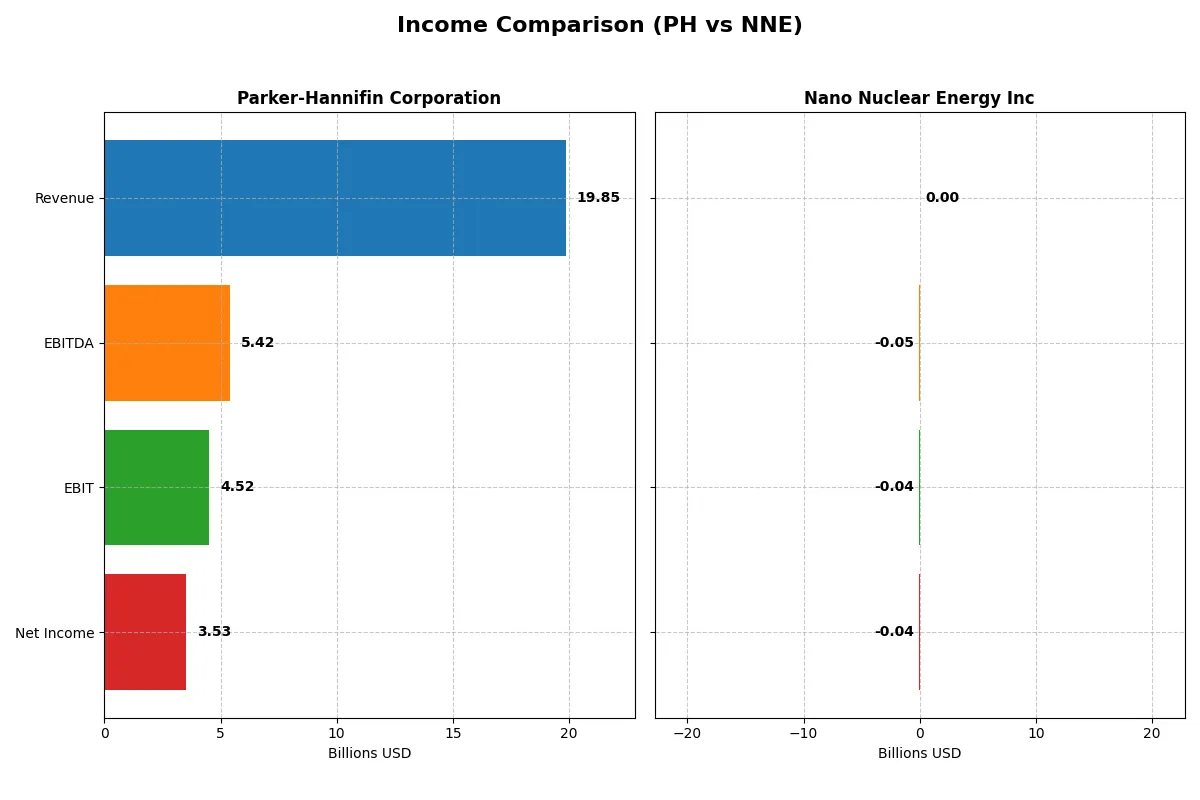
Income Statement Comparison
This data dissects the core profitability and scalability of both corporate engines to reveal who dominates the bottom line:
| Metric | Parker-Hannifin Corporation (PH) | Nano Nuclear Energy Inc (NNE) |
|---|---|---|
| Revenue | 19.85B | 0 |
| Cost of Revenue | 12.54B | 650.7K |
| Operating Expenses | 3.26B | 44.36M |
| Gross Profit | 7.32B | -650.7K |
| EBITDA | 5.42B | -46.22M |
| EBIT | 4.52B | -40.07M |
| Interest Expense | 409M | 0 |
| Net Income | 3.53B | -40.07M |
| EPS | 27.52 | -1.06 |
| Fiscal Year | 2025 | 2025 |
Income Statement Analysis: The Bottom-Line Duel
This income statement comparison reveals the true efficiency of each company’s business engine through their revenue growth, margin strength, and profitability trends.
Parker-Hannifin Corporation Analysis
Parker-Hannifin sustains strong revenue near 19.85B in 2025, with net income climbing to 3.53B. Gross margin holds favorably at 36.85%, and net margin improves to 17.79%, reflecting solid operational efficiency. Despite a slight 0.4% revenue dip last year, EBIT and net income surged over 10% and 24%, signaling robust momentum.
Nano Nuclear Energy Inc Analysis
Nano Nuclear records no revenue in 2025, incurring losses of 40M on zero gross margin. Operating expenses dominate at 44M, dragging EBIT and net income deep into negative territory. While EPS improved year-over-year, the overall income statement remains unfavorable with no top-line growth and persistent losses, highlighting early-stage operational challenges.
Margin Strength vs. Revenue Momentum
Parker-Hannifin clearly outperforms with sustainable revenue and expanding margins, delivering consistent profit growth and operational leverage. Nano Nuclear’s income statement reflects a startup in investment mode, lacking revenue and profitability. For investors, Parker-Hannifin’s profile offers proven efficiency and scale, whereas Nano Nuclear represents high risk without current income generation.
Financial Ratios Comparison
These vital ratios act as a diagnostic tool to expose the underlying fiscal health, valuation premiums, and capital efficiency of the companies compared below:
| Ratios | Parker-Hannifin Corporation (PH) | Nano Nuclear Energy Inc (NNE) |
|---|---|---|
| ROE | 25.81% | -0.02% |
| ROIC | 13.69% | -0.02% |
| P/E | 25.38 | -36.49 |
| P/B | 6.55 | 0.01 |
| Current Ratio | 1.19 | 53.48 |
| Quick Ratio | 0.71 | 53.48 |
| D/E (Debt-to-Equity) | 0.69 | 0.01 |
| Debt-to-Assets | 32.16% | 1.22% |
| Interest Coverage | 9.93 | 0 |
| Asset Turnover | 0.67 | 0 |
| Fixed Asset Turnover | 6.76 | 0 |
| Payout Ratio | 24.38% | 0 |
| Dividend Yield | 0.96% | 0 |
| Fiscal Year | 2025 | 2025 |
Efficiency & Valuation Duel: The Vital Signs
Financial ratios act as a company’s DNA, revealing hidden risks and operational excellence that raw numbers alone cannot expose.
Parker-Hannifin Corporation
Parker-Hannifin shows robust profitability with a 25.8% ROE and a strong 17.8% net margin, signaling efficient operations. Its valuation is stretched, with a P/E of 25.4 and P/B of 6.55, reflecting premium pricing. Shareholders receive modest dividends at 0.96%, balancing income with reinvestment in growth and innovation.
Nano Nuclear Energy Inc
Nano Nuclear Energy suffers from negative returns, with ROE and ROIC near zero, indicating operational struggles. The stock’s valuation appears cheap, with a P/E of -36.5 and P/B at 0.01, but these metrics reflect distress rather than opportunity. No dividends exist; capital is likely devoted to early-stage development and cash preservation.
Premium Valuation vs. Operational Fragility
Parker-Hannifin offers a solid balance of profitability and operational strength despite a stretched valuation. Nano Nuclear Energy’s favorable valuation metrics mask severe operational weaknesses and lack of returns. Investors seeking stability and earnings may prefer Parker-Hannifin, while risk-tolerant profiles might consider Nano Nuclear’s speculative growth potential.
Which one offers the Superior Shareholder Reward?
Parker-Hannifin (PH) pays a consistent dividend yield near 1.2% with a moderate payout ratio around 24%. It backs this with strong free cash flow coverage, enabling steady buybacks that enhance shareholder value. Nano Nuclear Energy (NNE) pays no dividends and burns cash in heavy R&D and capex, reflected by negative free cash flow and volatile margins. Its distribution relies purely on future growth, which remains unproven. I see PH’s balanced dividend and buyback approach as more sustainable. In 2026, PH offers a clearer, lower-risk total return profile than speculative NNE.
Comparative Score Analysis: The Strategic Profile
The radar chart reveals the fundamental DNA and trade-offs of both firms, highlighting their divergent financial strengths and valuation metrics:
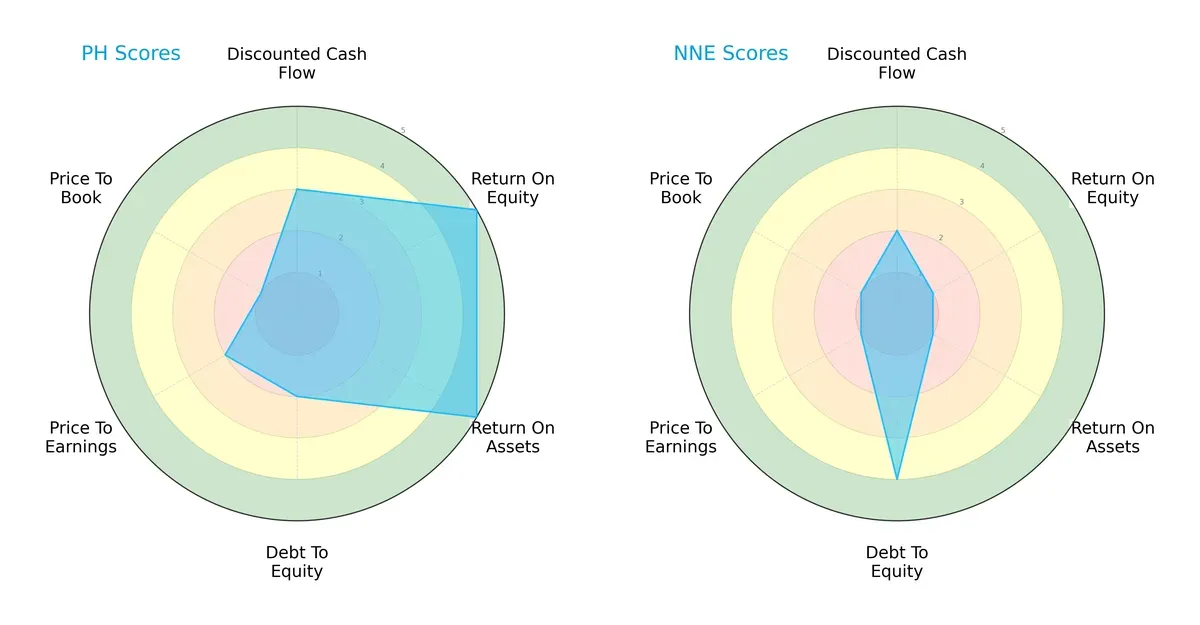
Parker-Hannifin Corporation (PH) shows a balanced profile with very favorable ROE and ROA scores, moderate DCF, and manageable debt levels. Nano Nuclear Energy Inc (NNE) relies on a strong debt-to-equity position but suffers from very unfavorable profitability and valuation scores. PH’s diversified strengths contrast sharply with NNE’s dependence on leverage, signaling PH as the more stable choice.
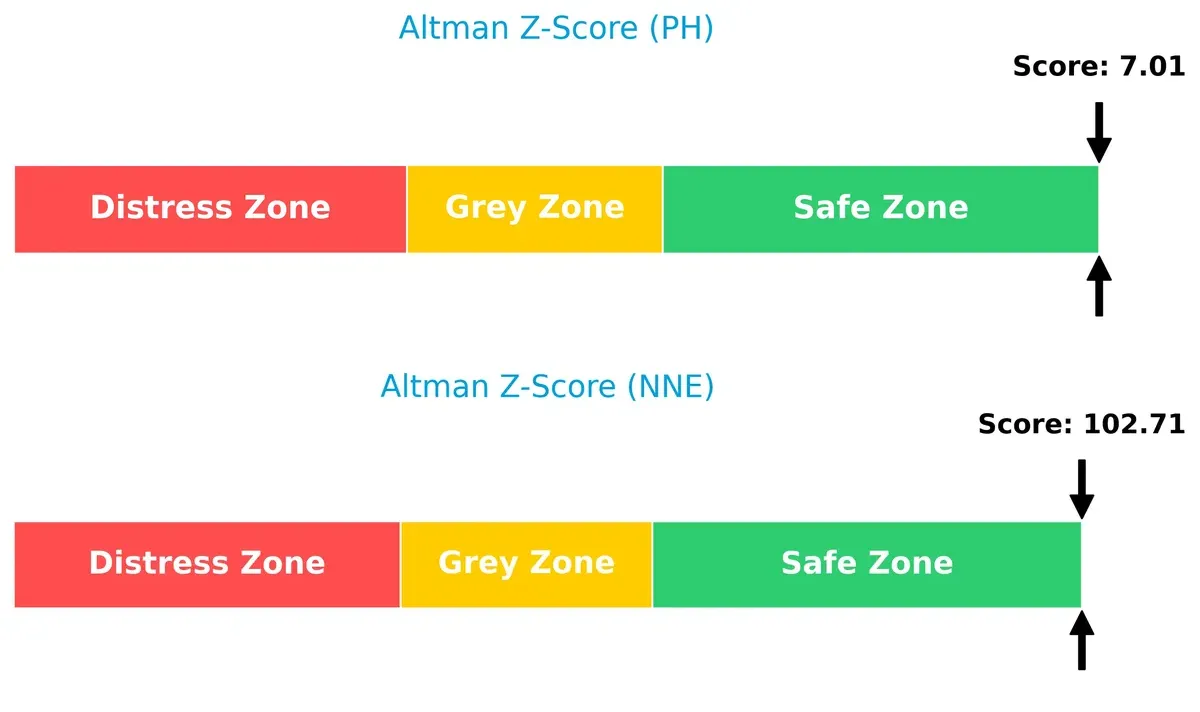
Bankruptcy Risk: Solvency Showdown
The Altman Z-Score gap favors both companies being in a safe zone, but NNE’s extraordinarily high score indicates an exceptionally low bankruptcy risk compared to PH’s strong yet more typical safety margin:
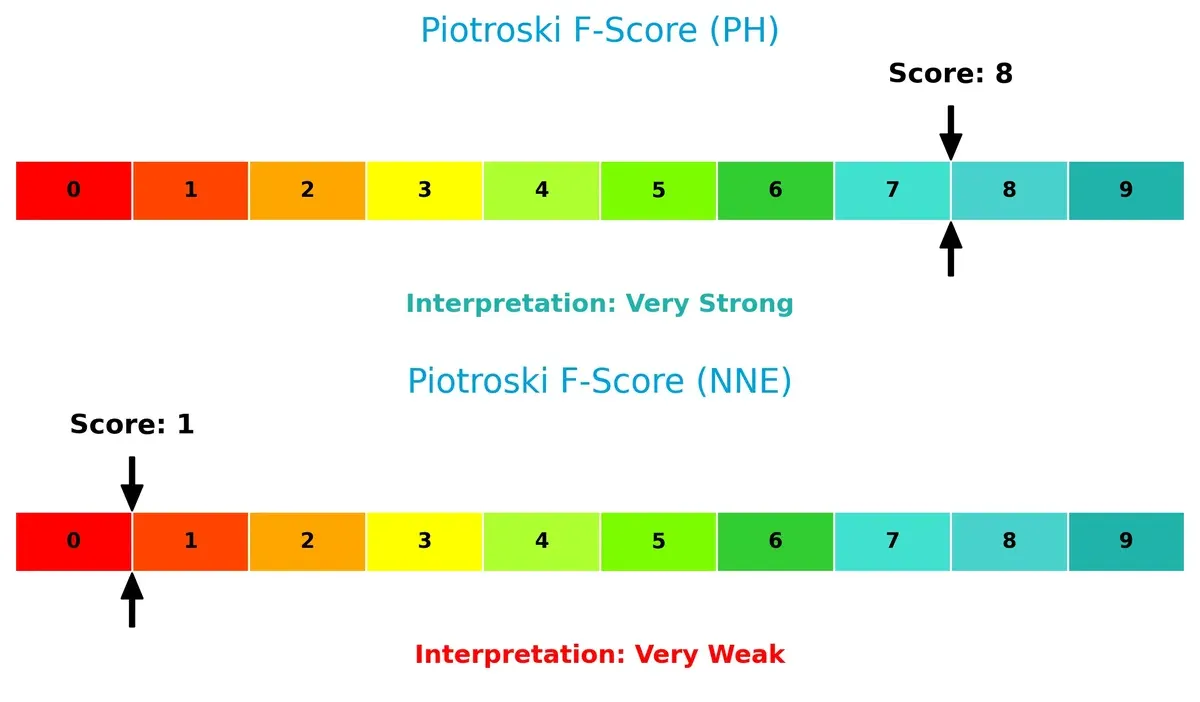
Financial Health: Quality of Operations
Parker-Hannifin scores an 8 on the Piotroski scale, signaling robust financial health and operational quality. Nano Nuclear Energy’s score of 1 raises red flags about internal weaknesses and poor fundamentals:
How are the two companies positioned?
This section dissects the operational DNA of PH and NNE by comparing their revenue distribution and internal dynamics. The goal is to confront their economic moats to identify which model offers the most resilient competitive advantage today.
Revenue Segmentation: The Strategic Mix
This comparison dissects how Parker-Hannifin Corporation and Nano Nuclear Energy Inc diversify their income streams and reveals their primary sector bets:
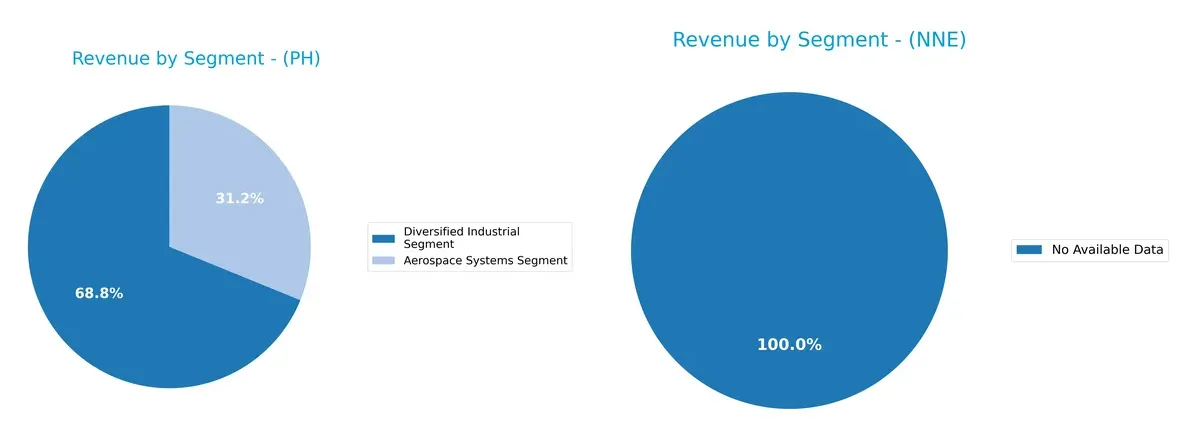
Parker-Hannifin anchors its revenue in two major segments: Diversified Industrial at $13.7B and Aerospace Systems at $6.2B for 2025. This reflects a balanced, yet industrially focused portfolio, reducing concentration risk while leveraging aerospace’s high barriers. Nano Nuclear Energy offers no available data, preventing segmentation analysis. Parker-Hannifin’s mix suggests ecosystem lock-in in diversified industrial markets, contrasted by Nano Nuclear’s unknown positioning, which raises questions on its revenue stability.
Strengths and Weaknesses Comparison
This table compares the Strengths and Weaknesses of Parker-Hannifin Corporation and Nano Nuclear Energy Inc:
PH Strengths
- Diversified revenue from Aerospace and Industrial segments
- Strong profitability with 17.79% net margin and 25.81% ROE
- Favorable interest coverage at 11.04
- Global presence with significant North America, Europe, and Asia Pacific sales
NNE Strengths
- Extremely low debt levels with 0.01 debt-to-equity and 1.22% debt-to-assets
- Favorable price-to-earnings and price-to-book ratios
- Strong quick ratio at 53.48 indicating liquidity
PH Weaknesses
- High price multiples with P/E at 25.38 and P/B of 6.55
- Weak liquidity indicated by quick ratio of 0.71
- Low dividend yield at 0.96%
- Moderate leverage with debt-to-assets at 32.16%
NNE Weaknesses
- Negative profitability with 0% net margin and negative ROE and ROIC
- Zero interest coverage and asset turnover ratios
- Imbalanced liquidity with excessively high current ratio of 53.48
- No dividend yield
Parker-Hannifin demonstrates robust profitability and diversified global operations but faces valuation and liquidity pressures. Nano Nuclear Energy shows strong balance sheet conservatism but struggles with profitability and operational efficiency. These contrasts highlight differing strategic challenges for each company.
The Moat Duel: Analyzing Competitive Defensibility
A structural moat is the only reliable shield protecting long-term profits from relentless competitive erosion. Let’s break down these firms’ moats:
Parker-Hannifin Corporation: Proven Engineering and Scale Advantage
Parker-Hannifin’s moat stems from its intangible assets and scale in motion control technologies. It delivers a very favorable ROIC exceeding WACC by 4.4%, showing efficient capital use. Its diversified industrial and aerospace segments maintain stable margins, supporting sustained profitability. New product innovations could deepen its moat in 2026 by expanding into emerging markets.
Nano Nuclear Energy Inc: Emerging Technology, Nascent Moat
Nano Nuclear’s competitive edge lies in its proprietary microreactor technology, a stark contrast to Parker’s broad industrial base. However, with a negative ROIC gap of -14%, it currently destroys value despite rapid ROIC improvement. The company’s future moat depends on successful commercialization of ZEUS and ODIN reactors amid high tech and regulatory risks.
Moat Strength Showdown: Scale and Diversification vs. Disruptive Innovation
Parker-Hannifin’s deeper, durable moat outclasses Nano Nuclear’s nascent and fragile advantage. Parker’s proven ability to generate excess returns and margin stability better equips it to defend market share as competition intensifies. Nano Nuclear must translate its technology promise into sustainable profitability to build a defensible moat.
Which stock offers better returns?
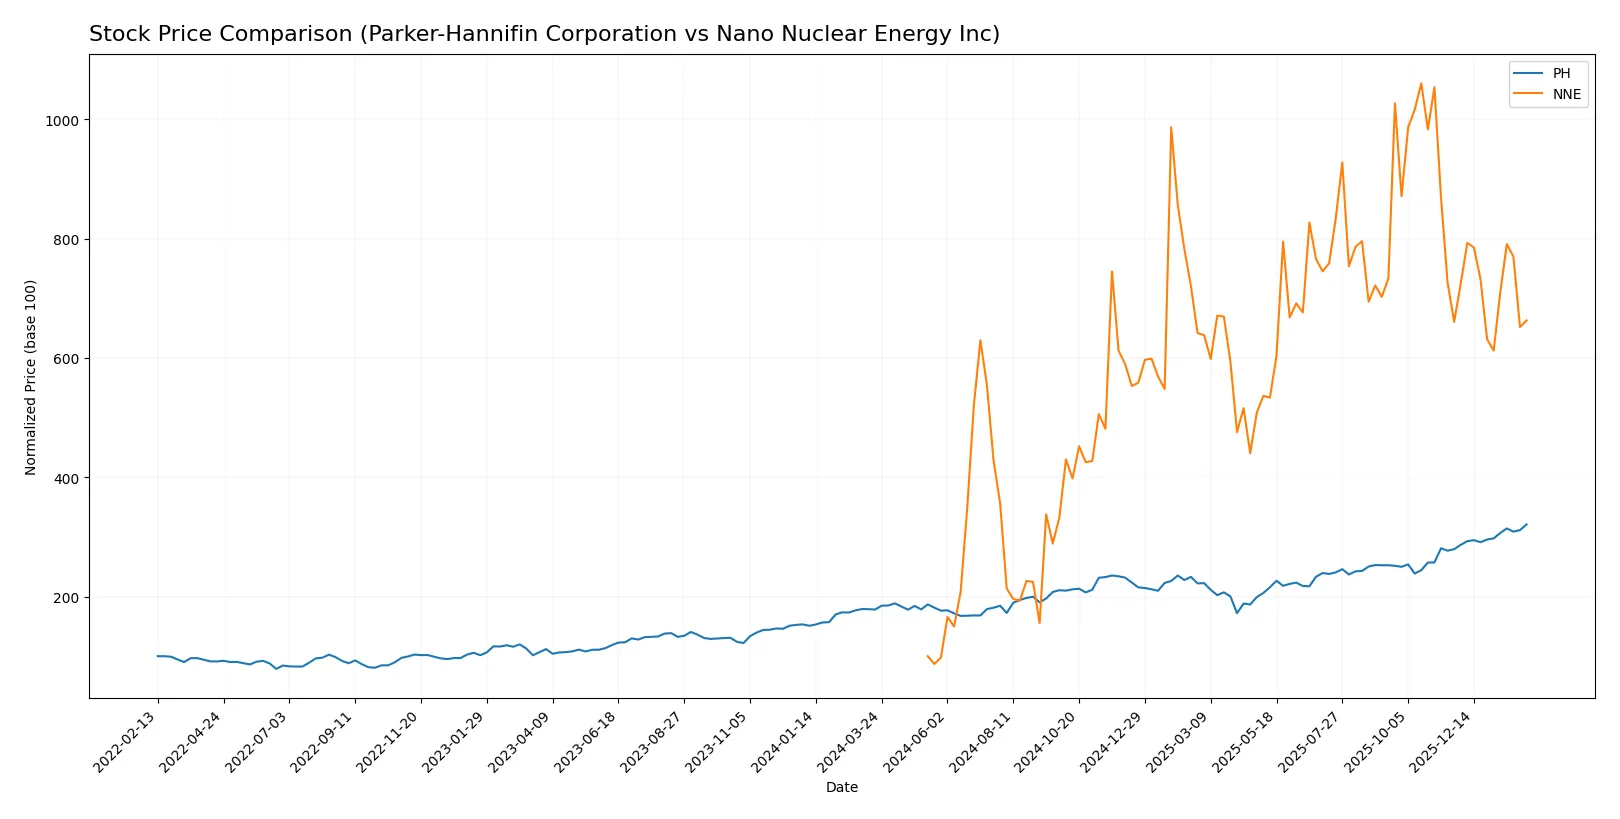
The past year saw Parker-Hannifin’s stock surge sharply, while Nano Nuclear Energy’s price skyrocketed earlier but recently flattened, reflecting contrasting momentum and trading dynamics.
Trend Comparison
Parker-Hannifin’s stock rose 80.11% over the past year, showing a bullish trend with price acceleration and high volatility between $503.3 and $964.33.
Nano Nuclear Energy’s stock gained 562.75% over the past year, a bullish trend with deceleration and low volatility, ranging from $3.92 to $47.84.
Nano Nuclear Energy outperformed Parker-Hannifin with a much higher return, despite recent deceleration and weaker buyer dominance in trading volume.
Target Prices
Analysts present a clear target consensus for both Parker-Hannifin Corporation and Nano Nuclear Energy Inc.
| Company | Target Low | Target High | Consensus |
|---|---|---|---|
| Parker-Hannifin Corporation | 825 | 1,139 | 995.46 |
| Nano Nuclear Energy Inc | 50 | 50 | 50 |
The consensus target for Parker-Hannifin suggests modest upside from the current 964.33 USD price, indicating steady confidence. Nano Nuclear Energy’s target at 50 USD implies significant potential appreciation from its current 29.89 USD share price.

Don’t Let Luck Decide Your Entry Point
Optimize your entry points with our advanced ProRealTime indicators. You’ll get efficient buy signals with precise price targets for maximum performance. Start outperforming now!
How do institutions grade them?
Here are the institutional grades for Parker-Hannifin Corporation and Nano Nuclear Energy Inc:
Parker-Hannifin Corporation Grades
The table below summarizes the recent grades from established grading companies for Parker-Hannifin:
| Grading Company | Action | New Grade | Date |
|---|---|---|---|
| Jefferies | Maintain | Buy | 2026-01-30 |
| Wells Fargo | Maintain | Overweight | 2026-01-30 |
| JP Morgan | Maintain | Overweight | 2026-01-30 |
| Stifel | Maintain | Hold | 2026-01-30 |
| Citigroup | Maintain | Buy | 2026-01-30 |
| Barclays | Maintain | Overweight | 2026-01-30 |
| Stifel | Maintain | Hold | 2026-01-23 |
| JP Morgan | Maintain | Overweight | 2026-01-16 |
| Morgan Stanley | Maintain | Equal Weight | 2026-01-14 |
| Wells Fargo | Maintain | Overweight | 2026-01-07 |
Nano Nuclear Energy Inc Grades
Below are the recent grades from notable grading firms for Nano Nuclear Energy:
| Grading Company | Action | New Grade | Date |
|---|---|---|---|
| HC Wainwright & Co. | Maintain | Buy | 2025-08-19 |
| Ladenburg Thalmann | Downgrade | Sell | 2025-08-18 |
| HC Wainwright & Co. | Maintain | Buy | 2025-08-15 |
| HC Wainwright & Co. | Maintain | Buy | 2025-03-31 |
| HC Wainwright & Co. | Maintain | Buy | 2025-01-29 |
| HC Wainwright & Co. | Maintain | Buy | 2024-11-27 |
| Benchmark | Maintain | Buy | 2024-11-07 |
| Benchmark | Maintain | Buy | 2024-07-15 |
| Benchmark | Maintain | Buy | 2024-06-25 |
Which company has the best grades?
Parker-Hannifin consistently earns positive grades such as Buy and Overweight from top-tier banks, reflecting broad institutional confidence. Nano Nuclear Energy shows mostly Buy ratings but includes a notable Sell downgrade, indicating mixed sentiment. Investors should weigh Parker-Hannifin’s stable, higher-tier consensus against Nano Nuclear’s more volatile outlook.
Risks specific to each company
The following categories identify critical pressure points and systemic threats facing Parker-Hannifin Corporation and Nano Nuclear Energy Inc in the 2026 market environment:
1. Market & Competition
Parker-Hannifin Corporation
- Established leader in diversified industrial and aerospace sectors, facing mature market competition
Nano Nuclear Energy Inc
- Emerging microreactor technology company competing in a nascent, highly innovative nuclear energy market
2. Capital Structure & Debt
Parker-Hannifin Corporation
- Moderate debt-to-equity ratio (0.69), interest coverage strong at 11.04 times
Nano Nuclear Energy Inc
- Very low debt (debt-to-equity 0.01), but zero interest coverage indicates no current earnings to service debt
3. Stock Volatility
Parker-Hannifin Corporation
- Beta of 1.24 shows moderate sensitivity to market swings
Nano Nuclear Energy Inc
- Extremely high beta of 7.49 signals very high risk and stock price volatility
4. Regulatory & Legal
Parker-Hannifin Corporation
- Subject to industrial and aerospace regulations; compliance well established
Nano Nuclear Energy Inc
- Faces potential regulatory hurdles tied to nuclear energy licensing and safety standards
5. Supply Chain & Operations
Parker-Hannifin Corporation
- Long operational history with robust global supply chains in various industries
Nano Nuclear Energy Inc
- Early-stage operations with limited scale and supply chain maturity, increasing operational risk
6. ESG & Climate Transition
Parker-Hannifin Corporation
- Moderate ESG risks; industrial sector faces environmental scrutiny but has transition strategies
Nano Nuclear Energy Inc
- Nuclear energy offers low-carbon benefits but faces public perception challenges and regulatory scrutiny
7. Geopolitical Exposure
Parker-Hannifin Corporation
- Global footprint with exposure to geopolitical risks in aerospace and industrial markets
Nano Nuclear Energy Inc
- Concentrated US operations but nuclear tech development may face geopolitical export controls
Which company shows a better risk-adjusted profile?
Parker-Hannifin’s established market position, solid profitability with a 17.8% net margin, and strong Altman Z-score (7.0) highlight a robust risk-adjusted profile. Conversely, Nano Nuclear Energy faces critical risks from zero profitability, very high stock volatility, and a weak Piotroski score (1). The largest risk for Parker-Hannifin lies in market cyclicality and industrial demand fluctuations. For Nano Nuclear, regulatory and operational immaturity pose the greatest threat. Parker-Hannifin’s stable debt servicing and moderate leverage contrast sharply with Nano Nuclear’s early-stage financial fragility. This disparity underlines Parker-Hannifin as the safer, more risk-adjusted investment in 2026.
Final Verdict: Which stock to choose?
Parker-Hannifin Corporation’s superpower lies in its durable competitive advantage and consistent value creation. Its strong return on invested capital outpaces the cost of capital, signaling efficient capital use and rising profitability. A point of vigilance is its stretched valuation multiples, which might temper near-term upside. It suits portfolios targeting steady, long-term growth with moderate risk tolerance.
Nano Nuclear Energy Inc boasts a strategic moat rooted in its ultra-low leverage and potential for transformative technology. Its safety profile contrasts with Parker-Hannifin’s more established business, given Nano Nuclear’s current value destruction and early-stage financial instability. This stock fits investors seeking speculative growth with a high risk-reward appetite and a tolerance for volatility.
If you prioritize proven profitability and sustainable capital efficiency, Parker-Hannifin outshines as the compelling choice due to its stable cash flows and favorable financial health. However, if you seek asymmetric upside from an emerging energy innovator, Nano Nuclear offers superior speculative potential despite its financial fragility. Each represents distinct investor archetypes navigating different risk landscapes.
Disclaimer: Investment carries a risk of loss of initial capital. The past performance is not a reliable indicator of future results. Be sure to understand risks before making an investment decision.
Go Further
I encourage you to read the complete analyses of Parker-Hannifin Corporation and Nano Nuclear Energy Inc to enhance your investment decisions: