Investors often seek companies that combine innovation with strong market presence, making Nordson Corporation and Nano Nuclear Energy Inc intriguing contenders. Both operate within the industrial machinery sector but focus on vastly different technological advancements—Nordson in precision dispensing systems and Nano Nuclear in cutting-edge microreactor technology. This comparison explores their growth potential and innovation strategies to help you decide which company offers the most compelling investment opportunity in 2026.
Table of contents
Companies Overview
I will begin the comparison between Nordson Corporation and Nano Nuclear Energy Inc by providing an overview of these two companies and their main differences.
Nordson Corporation Overview
Nordson Corporation engineers, manufactures, and markets systems to dispense, apply, and control adhesives, coatings, polymers, and other fluids worldwide. Operating through Industrial Precision Solutions and Advanced Technology Solutions segments, it serves various industries including packaging, manufacturing, and electronics. Founded in 1935 and headquartered in Westlake, Ohio, Nordson is an established player in industrial machinery with a market cap of about 14.6B USD.
Nano Nuclear Energy Inc Overview
Nano Nuclear Energy Inc is a microreactor technology company focused on developing solid-core and low-pressure coolant reactors, along with uranium fuel fabrication and nuclear consultation services. Founded in 2021 and based in New York City, it is a much smaller player with only 5 employees and a market cap of roughly 1.3B USD. Nano Nuclear operates in the industrial machinery sector with a focus on innovative nuclear energy technologies.
Key similarities and differences
Both companies operate within the industrial machinery sector and are listed on NASDAQ. Nordson is a diversified manufacturer of fluid dispensing and coating systems with a long history and broad industrial applications. In contrast, Nano Nuclear Energy is a young, specialized firm concentrating on advanced nuclear microreactors and fuel supply. Their business models differ significantly in scale, focus, and technology, with Nordson mature and product-diverse, and Nano Nuclear innovative but early-stage.
Income Statement Comparison
The table below presents a factual comparison of key income statement metrics for Nordson Corporation and Nano Nuclear Energy Inc for the most recent fiscal year available.
| Metric | Nordson Corporation (NDSN) | Nano Nuclear Energy Inc (NNE) |
|---|---|---|
| Market Cap | 14.6B | 1.33B |
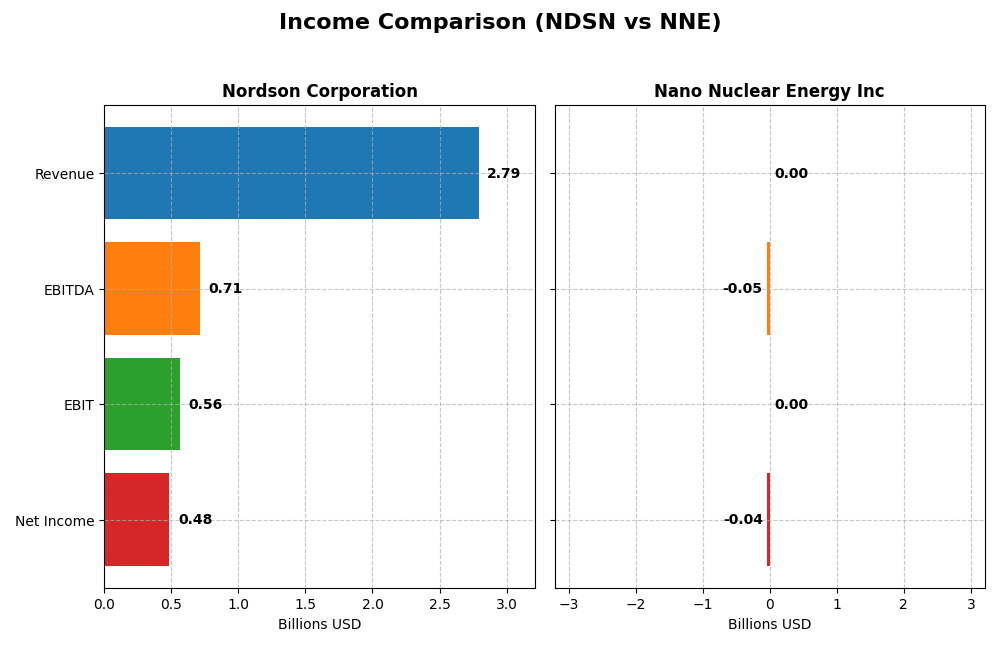
| Revenue | 2.79B | 0 |
| EBITDA | 712M | -46.2M |
| EBIT | 561M | 0 |
| Net Income | 484M | -40.1M |
| EPS | 8.56 | -1.06 |
| Fiscal Year | 2025 | 2025 |
Income Statement Interpretations
Nordson Corporation
Nordson Corporation’s revenue grew steadily from $2.36B in 2021 to $2.79B in 2025, marking an 18.18% increase over five years. Net income also rose, albeit more modestly, to $484M in 2025. Margins remain strong, with a gross margin near 55%, though EBIT margin declined slightly in the last year. The 2025 performance showed slower EBIT growth but EPS improved by 4.93%.
Nano Nuclear Energy Inc
Nano Nuclear Energy reported zero revenue throughout 2022-2025, reflecting its early-stage development status. Its net income was negative each year, with a loss of $40M in 2025. Margins remain unfavorable due to the lack of sales, though the company experienced notable improvements in EPS growth and EBIT in 2025, driven by reduced expenses and some non-operating income.
Which one has the stronger fundamentals?
Nordson Corporation exhibits stronger fundamentals with consistent revenue and net income growth, solid margins, and a favorable overall income statement evaluation. In contrast, Nano Nuclear Energy’s lack of revenue and persistent net losses indicate weaker financial footing, despite some operational improvements. The contrast highlights Nordson’s established profitability versus Nano Nuclear’s developmental stage challenges.
Financial Ratios Comparison
The table below presents a side-by-side comparison of key financial ratios for Nordson Corporation (NDSN) and Nano Nuclear Energy Inc (NNE) based on their most recent fiscal year data.
| Ratios | Nordson Corporation (NDSN) FY 2025 | Nano Nuclear Energy Inc (NNE) FY 2025 |
|---|---|---|
| ROE | 15.9% | -18.0% |
| ROIC | 10.5% | -20.5% |
| P/E | 27.1 | -0.04 |
| P/B | 4.31 | 0.007 |
| Current Ratio | 1.64 | 53.5 |
| Quick Ratio | 1.05 | 53.5 |
| D/E | 0.69 | 0.013 |
| Debt-to-Assets | 35.4% | 1.2% |
| Interest Coverage | 7.04 | 0 |
| Asset Turnover | 0.47 | 0 |
| Fixed Asset Turnover | 4.70 | 0 |
| Payout ratio | 37.0% | 0 |
| Dividend yield | 1.36% | 0 |
Interpretation of the Ratios
Nordson Corporation
Nordson Corporation shows generally strong profitability ratios with a favorable net margin of 17.35% and a return on equity of 15.92%, indicating efficient capital use. Liquidity appears solid with a current ratio of 1.64. However, valuation multiples like P/E at 27.1 and P/B at 4.31 are less attractive. The company pays a dividend, with a modest yield of 1.36%, supported by free cash flow coverage, suggesting a balanced shareholder return approach.
Nano Nuclear Energy Inc
Nano Nuclear Energy Inc presents weak profitability ratios, including a negative return on equity of -18.0% and a net margin of 0%, reflecting operational challenges. Liquidity ratios are unusual, with an extremely high current ratio of 53.48, but interest coverage is zero, signaling financial stress. The company does not pay dividends, likely due to ongoing development and reinvestment priorities, consistent with its early-stage status and negative returns.
Which one has the best ratios?
Nordson Corporation holds the advantage with a predominantly favorable ratio profile, strong profitability, and consistent liquidity, despite some valuation concerns. Nano Nuclear Energy Inc struggles with profitability and coverage ratios, reflecting its developmental phase and financial risks. Therefore, Nordson’s ratios are comparatively more robust and stable in this evaluation.
Strategic Positioning
This section compares the strategic positioning of Nordson Corporation and Nano Nuclear Energy Inc, focusing on market position, key segments, and exposure to technological disruption:
Nordson Corporation
- Large market cap of 14.6B with established industrial machinery presence and moderate competitive pressure.
- Diversified segments: Industrial Precision Solutions, Advanced Technology Systems, Medical and Fluid Solutions driving revenue.
- Exposure through advanced dispensing and coating systems; incremental innovation in industrial tech rather than radical disruption.
Nano Nuclear Energy Inc
- Smaller market cap of 1.3B, emerging microreactor technology firm facing high volatility and competitive uncertainty.
- Concentrated on nuclear microreactors, uranium fuel fabrication, and nuclear consultation services.
- Operates in a disruptive nuclear microreactor space with new solid-core and low-pressure coolant technologies.
Nordson Corporation vs Nano Nuclear Energy Inc Positioning
Nordson shows a diversified industrial product strategy across multiple mature segments, offering stable revenue streams. Nano Nuclear Energy’s focus on innovative nuclear microreactors targets a niche, high-potential market but involves greater technological and market risks.
Which has the best competitive advantage?
Nordson’s MOAT is slightly favorable with consistent value creation despite declining profitability. Nano Nuclear Energy has a slightly unfavorable MOAT, currently destroying value but improving profitability, reflecting early-stage growth challenges.
Stock Comparison
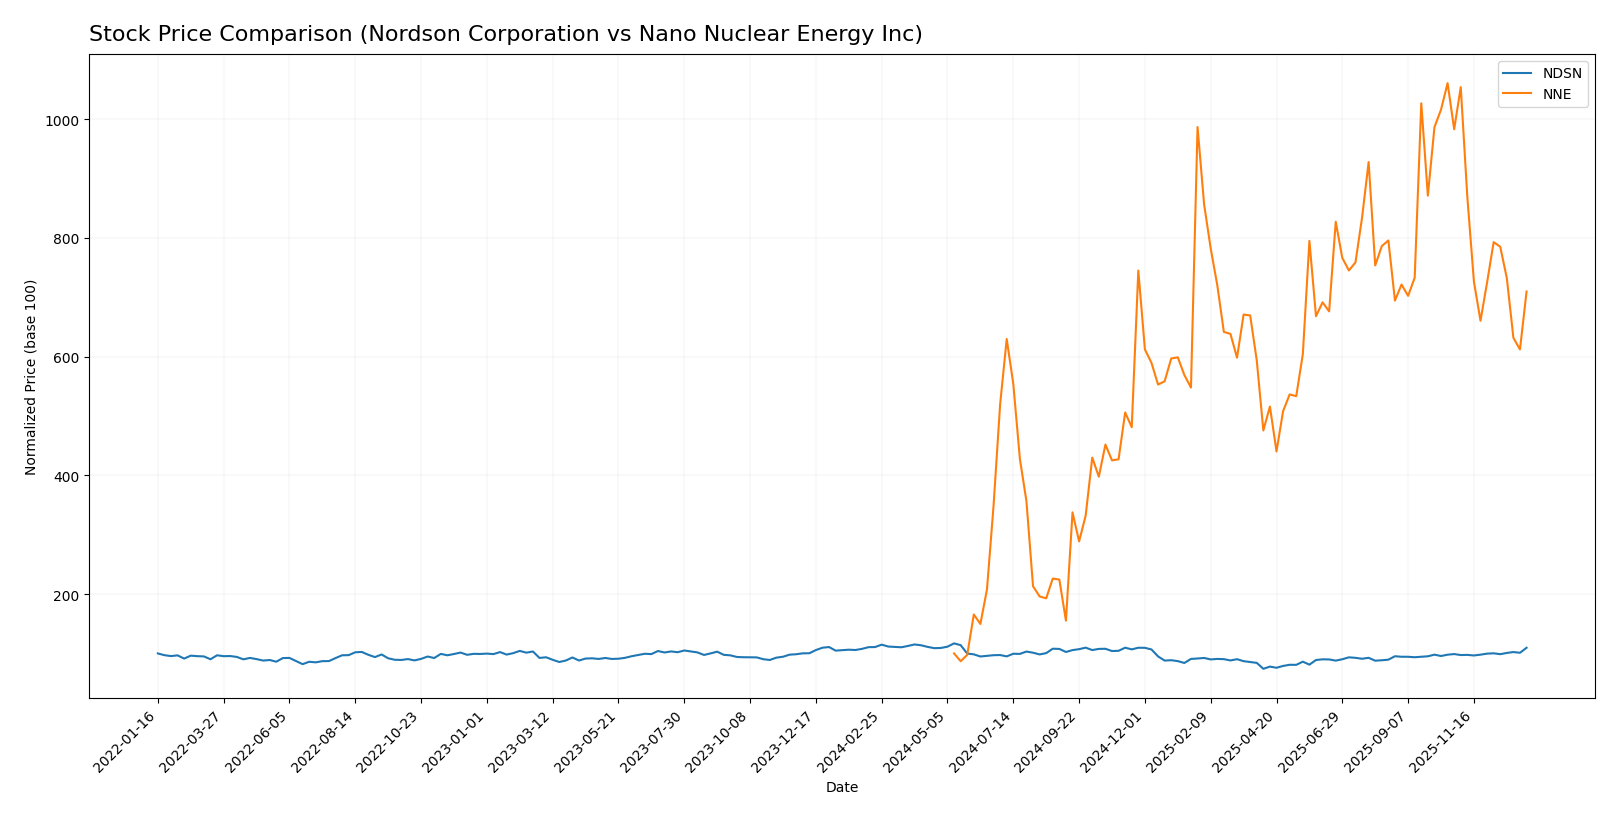
The stock price movements of Nordson Corporation and Nano Nuclear Energy Inc over the past year reveal contrasting trends, with notable shifts in investor sentiment and trading volumes that highlight their differing market dynamics.
Trend Analysis
Nordson Corporation’s stock experienced a slight bearish trend over the past 12 months with a -1.08% price change, showing acceleration and high volatility with a standard deviation of 23.45. The stock reached a high of 278.89 and a low of 176.73.
Nano Nuclear Energy Inc demonstrated a strong bullish trend over the same period with a 609.76% gain, though the upward momentum showed signs of deceleration. The stock’s volatility was moderate, with a standard deviation of 10.81, and prices ranged from 3.92 to 47.84.
Comparing both stocks, Nano Nuclear Energy Inc delivered the highest market performance with a significant price increase, while Nordson Corporation’s stock showed a modest decline despite recent positive momentum.
Target Prices
The consensus analyst target prices reflect moderate upside potential for these industrial machinery companies.
| Company | Target High | Target Low | Consensus |
|---|---|---|---|
| Nordson Corporation | 295 | 240 | 274.17 |
| Nano Nuclear Energy Inc | 50 | 50 | 50 |
Nordson’s target consensus at $274.17 is moderately above its current price of $261.22, suggesting modest upside. Nano Nuclear Energy’s consensus target of $50 significantly exceeds its current price of $32.01, indicating higher expected growth but also higher risk.
Analyst Opinions Comparison
This section compares analysts’ ratings and grades for Nordson Corporation and Nano Nuclear Energy Inc:
Rating Comparison
Nordson Corporation Rating
- Rating: B, considered very favorable by analysts.
- Discounted Cash Flow Score: Moderate at 3, indicating fair valuation.
- ROE Score: Favorable at 4, reflecting efficient profit generation.
- ROA Score: Favorable at 4, showing effective asset utilization.
- Debt To Equity Score: Moderate at 2, suggesting average financial risk.
- Overall Score: Moderate at 3, summarizing a balanced financial standing.
Nano Nuclear Energy Inc Rating
- Rating: C, also considered very favorable by analysts.
- Discounted Cash Flow Score: Moderate at 2, showing slightly lower valuation confidence.
- ROE Score: Very unfavorable at 1, indicating poor equity returns.
- ROA Score: Very unfavorable at 1, indicating inefficient asset use.
- Debt To Equity Score: Very favorable at 5, indicating strong balance sheet.
- Overall Score: Moderate at 2, reflecting a less strong financial position.
Which one is the best rated?
Nordson Corporation holds a better overall rating (B versus C) and stronger profitability scores (ROE and ROA) compared to Nano Nuclear Energy Inc. However, Nano Nuclear Energy’s superior debt-to-equity score indicates lower financial risk.
Scores Comparison
Here is a comparison of the Altman Z-Score and Piotroski Score for Nordson Corporation and Nano Nuclear Energy Inc:
NDSN Scores
- Altman Z-Score: 4.90, indicating a safe zone with low bankruptcy risk.
- Piotroski Score: 7, categorized as strong financial health.
NNE Scores
- Altman Z-Score: 143.56, firmly in the safe zone, extremely low bankruptcy risk.
- Piotroski Score: 2, considered very weak financial strength.
Which company has the best scores?
NNE has a much higher Altman Z-Score than NDSN, indicating stronger bankruptcy safety. However, NDSN’s Piotroski Score is significantly higher, reflecting better overall financial strength compared to NNE’s very weak rating.
Grades Comparison
Here is a detailed comparison of the recent grades assigned to Nordson Corporation and Nano Nuclear Energy Inc:
Nordson Corporation Grades
This table summarizes recent grades from recognized financial analysts for Nordson Corporation:
| Grading Company | Action | New Grade | Date |
|---|---|---|---|
| DA Davidson | Maintain | Buy | 2025-12-12 |
| Baird | Maintain | Neutral | 2025-12-12 |
| DA Davidson | Maintain | Buy | 2025-12-11 |
| Keybanc | Maintain | Overweight | 2025-12-11 |
| Oppenheimer | Maintain | Outperform | 2025-08-25 |
| Baird | Maintain | Neutral | 2025-08-22 |
| Keybanc | Maintain | Overweight | 2025-07-15 |
| Baird | Maintain | Neutral | 2025-05-30 |
| Oppenheimer | Upgrade | Outperform | 2025-05-30 |
| Keybanc | Maintain | Overweight | 2025-04-08 |
Nordson Corporation shows a generally positive grade trend with multiple “Buy,” “Overweight,” and “Outperform” ratings maintained or upgraded by reputable firms.
Nano Nuclear Energy Inc Grades
This table summarizes recent grades from recognized financial analysts for Nano Nuclear Energy Inc:
| Grading Company | Action | New Grade | Date |
|---|---|---|---|
| HC Wainwright & Co. | Maintain | Buy | 2025-08-19 |
| Ladenburg Thalmann | Downgrade | Sell | 2025-08-18 |
| HC Wainwright & Co. | Maintain | Buy | 2025-08-15 |
| HC Wainwright & Co. | Maintain | Buy | 2025-03-31 |
| HC Wainwright & Co. | Maintain | Buy | 2025-01-29 |
| HC Wainwright & Co. | Maintain | Buy | 2024-11-27 |
| Benchmark | Maintain | Buy | 2024-11-07 |
| Benchmark | Maintain | Buy | 2024-07-15 |
| Benchmark | Maintain | Buy | 2024-06-25 |
Nano Nuclear Energy Inc maintains mostly “Buy” ratings, though there is one recent notable downgrade to “Sell” by Ladenburg Thalmann.
Which company has the best grades?
Nordson Corporation has received consistently positive grades, including multiple “Buy,” “Outperform,” and “Overweight” ratings, reflecting confidence from several reputable analysts. Nano Nuclear Energy Inc shows a majority “Buy” consensus but with a recent downgrade to “Sell,” indicating some analyst caution. Investors may weigh these grading patterns when assessing potential risk and return.
Strengths and Weaknesses
Below is a comparative overview of key strengths and weaknesses of Nordson Corporation (NDSN) and Nano Nuclear Energy Inc (NNE) based on their latest financial and operational data.
| Criterion | Nordson Corporation (NDSN) | Nano Nuclear Energy Inc (NNE) |
|---|---|---|
| Diversification | Well-diversified product segments: Industrial Precision Solutions (1.48B), Medical & Fluid Solutions (695M), Advanced Technology Systems (510M) | Limited diversification; primarily focused on emerging nuclear technology |
| Profitability | Strong profitability with 17.35% net margin, 15.92% ROE, and positive ROIC (10.49%) | Negative profitability: net margin 0%, ROE -18%, ROIC -20.5% indicates ongoing losses |
| Innovation | Consistent investment in advanced technology systems segment, maintaining competitive edge | Innovation potential high but unproven; currently value destructive with growing ROIC trend |
| Global presence | Established global market presence supporting stable revenues | Smaller scale with limited global footprint at this stage |
| Market Share | Significant market share in industrial and medical systems segments globally | Early-stage company with minimal current market share |
Key takeaways: Nordson exhibits solid diversification and profitability, making it a relatively stable investment despite a slight decline in ROIC trend. Nano Nuclear Energy shows promising innovation growth but currently destroys value and carries higher risk due to lack of profitability and market presence. Investors should weigh stability against growth potential cautiously.
Risk Analysis
Below is a risk comparison table for Nordson Corporation (NDSN) and Nano Nuclear Energy Inc (NNE) based on the most recent 2025 data:
| Metric | Nordson Corporation (NDSN) | Nano Nuclear Energy Inc (NNE) |
|---|---|---|
| Market Risk | Moderate (Beta 1.03) | High (Beta 7.49) |
| Debt Level | Moderate (D/E 0.69) | Low (D/E 0.01) |
| Regulatory Risk | Moderate | High (Nuclear industry) |
| Operational Risk | Moderate | High (Early-stage tech) |
| Environmental Risk | Moderate | High (Nuclear safety concerns) |
| Geopolitical Risk | Moderate | High (Nuclear fuel and tech) |
Nordson (NDSN) shows moderate market and operational risks but benefits from financial stability and a safe Altman Z-score, indicating low bankruptcy risk. Nano Nuclear (NNE) faces high market volatility, regulatory scrutiny, and environmental risks typical for nuclear startups, despite low debt—its financials remain unfavorable with a weak Piotroski score, highlighting significant investment risk.
Which Stock to Choose?
Nordson Corporation (NDSN) shows a generally favorable income evolution with stable revenue growth of 18.18% over five years, positive profitability metrics including a 17.35% net margin, and a solid return on equity of 15.92%. Its debt level is moderate with a debt-to-equity ratio of 0.69, and the company holds a very favorable overall rating of B. The economic moat is slightly favorable, indicating value creation despite a declining ROIC trend.
Nano Nuclear Energy Inc (NNE) presents unfavorable income results with zero revenue growth and negative profitability indicated by a -18% ROE and -20.5% ROIC. The company’s debt is very low, reflected in a 0.01 debt-to-equity ratio, and it benefits from a very favorable rating of C in terms of financial scores. However, it is considered to be shedding value, with a slightly unfavorable moat status despite improving profitability trends.
For investors, the choice might depend on risk tolerance and investment strategy. Those favoring established profitability and value creation could find NDSN’s stable income and moderate debt profile more aligned with quality investing. Conversely, risk-tolerant investors interested in early-stage growth opportunities with improving profitability trends might see potential in NNE, though its unfavorable income and financial ratios suggest higher risk.
Disclaimer: Investment carries a risk of loss of initial capital. The past performance is not a reliable indicator of future results. Be sure to understand risks before making an investment decision.
Go Further
I encourage you to read the complete analyses of Nordson Corporation and Nano Nuclear Energy Inc to enhance your investment decisions: