Home > Comparison > Financial Services > SPGI vs MSCI
The strategic rivalry between S&P Global Inc. and MSCI Inc. shapes today’s financial data and analytics landscape. S&P Global operates as a diversified, capital-intensive powerhouse across multiple market intelligence divisions. MSCI focuses on high-margin, specialized investment decision tools and ESG analytics. This head-to-head reflects a contrast between broad market solutions and niche innovation. This analysis will identify which trajectory offers superior risk-adjusted returns for a well-diversified portfolio in financial services.
Table of contents
Companies Overview
S&P Global Inc. and MSCI Inc. dominate the financial data and analytics landscape with distinct market roles and strategic priorities.
S&P Global Inc.: A Financial Information Powerhouse
S&P Global Inc. commands the market as a leading provider of credit ratings and benchmarks. It generates revenue through six diversified divisions, including credit ratings, indices, and commodity insights. In 2026, its strategic focus centers on delivering comprehensive data and workflow solutions across capital markets, emphasizing ESG, regulatory compliance, and automotive mobility analytics.
MSCI Inc.: Investment Decision Support Specialist
MSCI Inc. stands out as a provider of investment decision tools, catering to asset owners and managers globally. Its core revenue streams come from indexes, analytics, ESG, and private asset data. The company’s 2026 strategy revolves around expanding ESG and climate-related offerings, enhancing risk management analytics, and supporting private capital markets with detailed real estate and transaction insights.
Strategic Collision: Similarities & Divergences
Both companies operate within financial data services but diverge in philosophy: S&P Global pursues a broad, multi-sector data ecosystem, while MSCI emphasizes specialized investment decision support with a focus on ESG and risk analytics. Their primary battleground is in investment analytics and ESG solutions, where they compete for institutional clients’ trust. S&P offers scale and diversification; MSCI provides depth and niche expertise, defining distinct investment profiles.
Income Statement Comparison
This data dissects the core profitability and scalability of both corporate engines to reveal who dominates the bottom line:
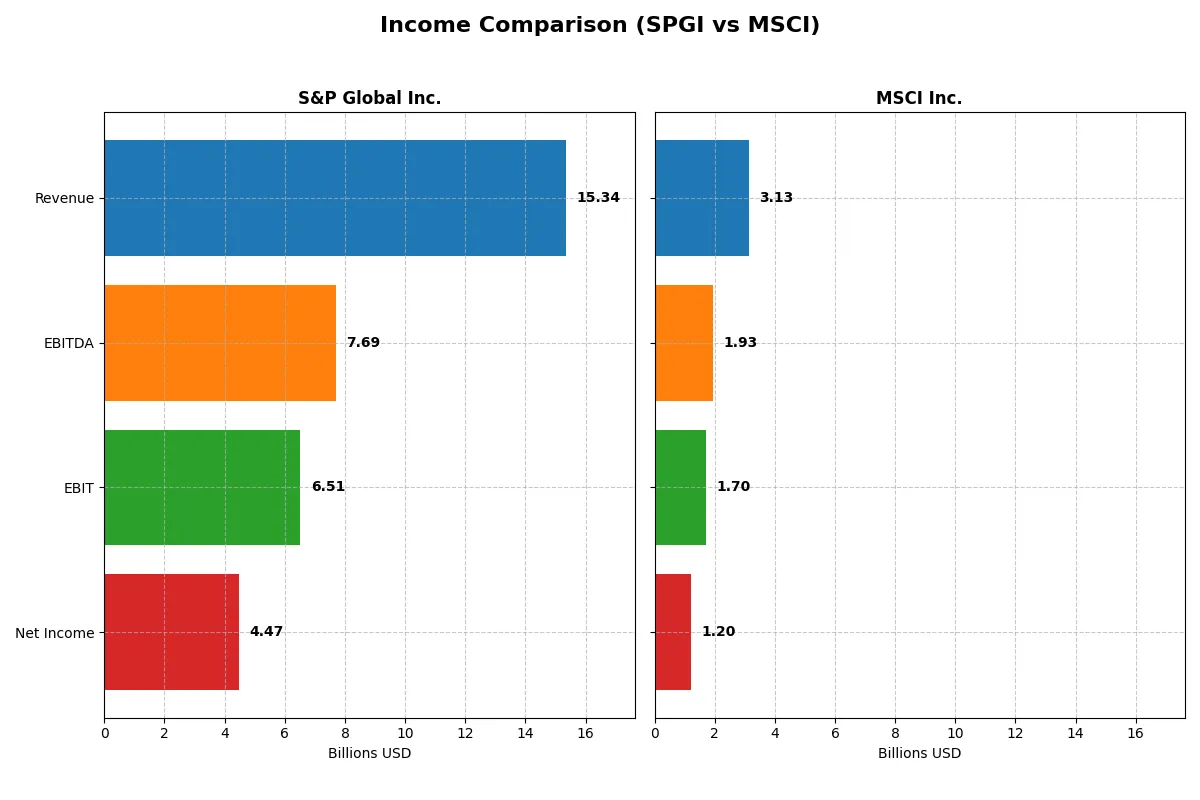
| Metric | S&P Global Inc. (SPGI) | MSCI Inc. (MSCI) |
|---|---|---|
| Revenue | 15.3B | 3.1B |
| Cost of Revenue | 9.2B | 550M |
| Operating Expenses | 0 | 871M |
| Gross Profit | 6.2B | 2.6B |
| EBITDA | 7.7B | 1.9B |
| EBIT | 6.5B | 1.7B |
| Interest Expense | 287M | 210M |
| Net Income | 4.5B | 1.2B |
| EPS | 14.67 | 15.58 |
| Fiscal Year | 2025 | 2025 |
Income Statement Analysis: The Bottom-Line Duel
This income statement comparison reveals which company operates with superior efficiency and profit generation over recent years.
S&P Global Inc. Analysis
S&P Global’s revenue climbed steadily from 8.3B in 2021 to 15.3B in 2025, with net income rising from 3B to 4.5B. Gross margin fluctuated but remained healthy near 40%, while net margin stabilized around 29%. The 2025 figures show strong momentum with a 7.9% revenue increase and a 7.5% net margin gain, reflecting solid operational control and expanding profitability.
MSCI Inc. Analysis
MSCI’s revenue grew from 2B in 2021 to 3.1B in 2025, with net income increasing from 726M to 1.2B. The company boasts an impressive gross margin above 82% and a net margin near 38%, underscoring exceptional cost efficiency. In 2025, MSCI reported a 9.7% revenue increase, although net margin slightly declined by 1.2%, indicating strong top-line growth but margin pressure.
Margin Strength vs. Growth Scale
S&P Global delivers robust revenue growth and expanding net income, driven by consistent margin improvements. MSCI excels in margin dominance with higher profitability ratios but faces slight net margin softness despite faster revenue growth. For investors, S&P Global’s profile suits those valuing balanced expansion, while MSCI appeals to those prioritizing margin leadership and efficiency.
Financial Ratios Comparison
These vital ratios act as a diagnostic tool to expose underlying fiscal health, valuation premiums, and capital efficiency across companies:
| Ratios | S&P Global Inc. (SPGI) | MSCI Inc. (MSCI) |
|---|---|---|
| ROE | 14.3% | -45.3% |
| ROIC | 9.2% | 35.6% |
| P/E | 35.6 | 36.8 |
| P/B | 5.10 | -16.7 |
| Current Ratio | 0.82 | 0.90 |
| Quick Ratio | 0.82 | 0.90 |
| D/E | 0.43 | -2.38 |
| Debt-to-Assets | 22.2% | 111% |
| Interest Coverage | 22.6 | 8.16 |
| Asset Turnover | 0.25 | 0.55 |
| Fixed Asset Turnover | 55.2 | 15.7 |
| Payout ratio | 26.2% | 46.3% |
| Dividend yield | 0.73% | 1.26% |
| Fiscal Year | 2025 | 2025 |
Efficiency & Valuation Duel: The Vital Signs
Ratios serve as a company’s DNA, exposing hidden risks and operational strengths that raw financials might conceal.
S&P Global Inc.
S&P Global displays solid profitability with a 14.31% ROE and a strong 29.15% net margin, signaling operational efficiency. However, its valuation appears stretched, with a high P/E of 35.63 and P/B at 5.1. Dividend yield is modest at 0.73%, reflecting a cautious capital return approach amid neutral capital allocation metrics.
MSCI Inc.
MSCI shows a mixed profile: a high 38.36% net margin and robust 35.6% ROIC contrast with a deeply negative ROE at -45.29%, indicating financial or accounting distortions. Its P/E is also elevated at 36.82, suggesting expensive stock pricing. MSCI offers a higher dividend yield of 1.26%, with reinvestment focused on growth despite some balance sheet leverage concerns.
Premium Valuation vs. Operational Complexity
Both companies carry premium valuations above 35x P/E, but S&P Global’s positive ROE and steadier capital structure offer more balanced risk-reward. MSCI’s profitability is offset by its negative equity returns and high financial leverage. Investors seeking operational stability may prefer S&P, while those accepting complexity might consider MSCI’s growth potential.
Which one offers the Superior Shareholder Reward?
I compare S&P Global Inc. (SPGI) and MSCI Inc. (MSCI) on dividend yield, payout ratio, and buyback intensity. SPGI yields ~0.73% with a 26% payout ratio, supported by strong free cash flow (FCF) coverage near 97%. MSCI offers a higher yield at ~1.26%, but a more aggressive 46% payout ratio, risking sustainability. Both sustain buybacks, yet SPGI’s conservative payout and solid FCF imply better distribution durability. MSCI’s leverage and negative equity metrics raise caution despite its higher yield. I conclude SPGI delivers a more balanced, sustainable shareholder reward in 2026.
Comparative Score Analysis: The Strategic Profile
The radar chart reveals the fundamental DNA and trade-offs of both S&P Global Inc. and MSCI Inc., highlighting their financial strengths and valuation challenges:
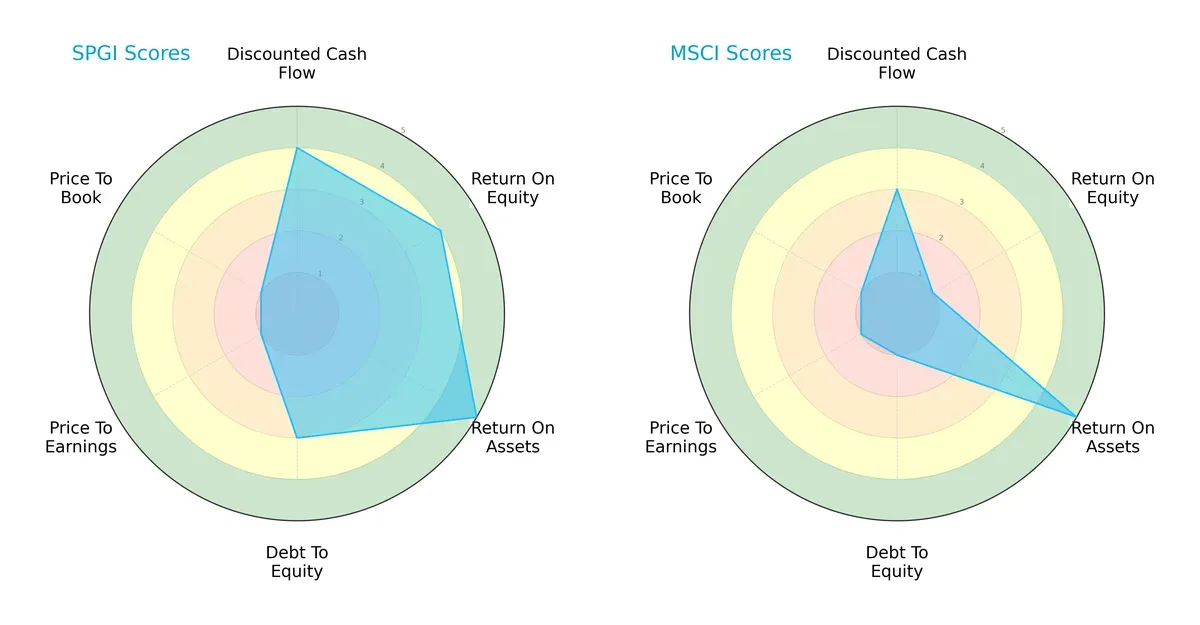
S&P Global Inc. shows a balanced profile with strong ROE (4) and ROA (5) scores, indicating efficient profitability and asset use. It manages debt moderately (3) but suffers from very unfavorable valuation metrics (PE and PB scores at 1). MSCI Inc. excels in asset utilization (ROA 5) but has poor equity returns (ROE 1) and high financial risk (debt-to-equity 1). Both face valuation headwinds, but S&P Global’s broader strengths suggest a more stable investment foundation.
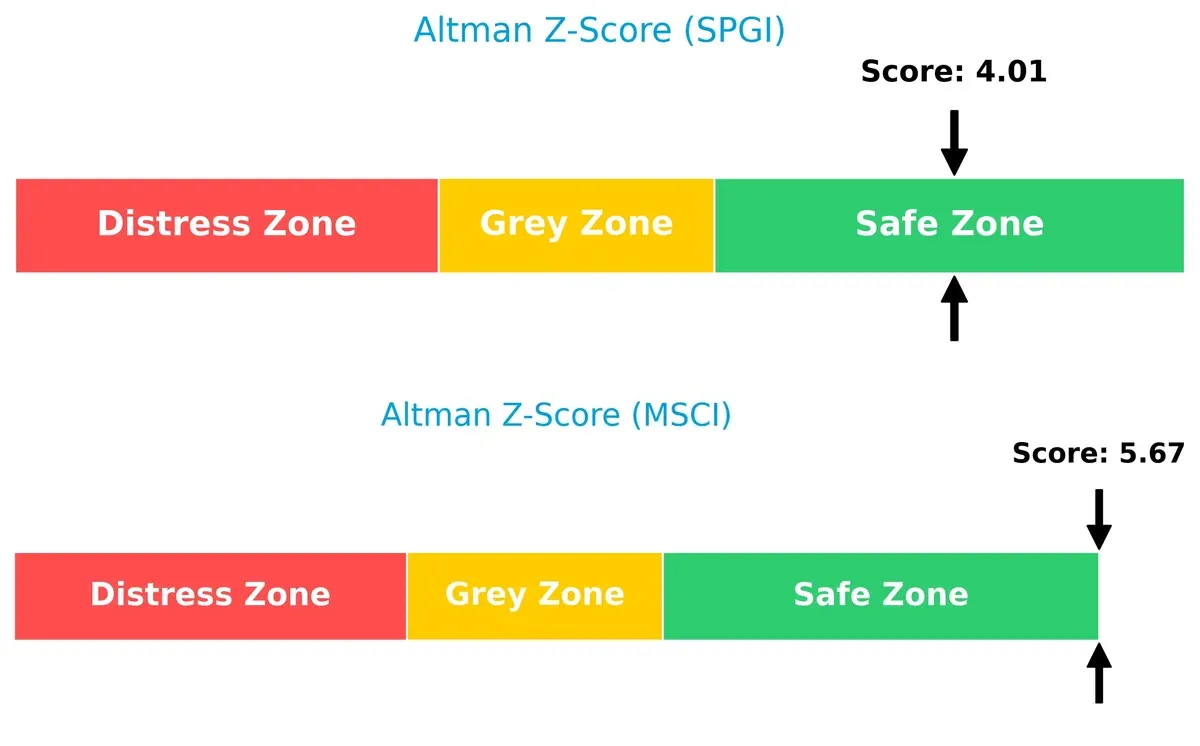
Bankruptcy Risk: Solvency Showdown
S&P Global’s Altman Z-Score of 4.01 and MSCI’s 5.67 place both firms firmly in the safe zone, signaling a low bankruptcy risk and solid long-term survival prospects in today’s volatile macro environment:
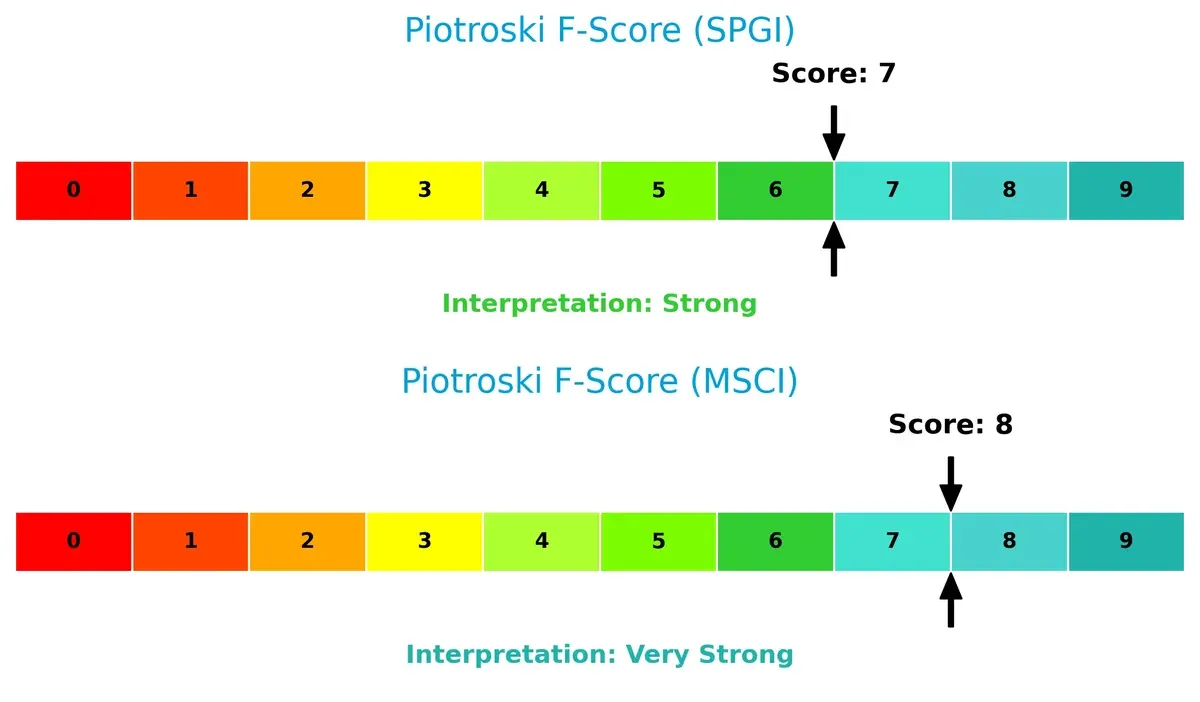
Financial Health: Quality of Operations
MSCI scores an 8 on the Piotroski scale, outperforming S&P Global’s 7, indicating MSCI’s internal financial operations are currently more robust. This suggests MSCI maintains stronger profitability and liquidity metrics, though both companies remain in strong financial health:
How are the two companies positioned?
This section dissects SPGI and MSCI’s operational DNA by comparing revenue distribution and internal strengths and weaknesses. The goal is to confront their economic moats and identify which model offers the most resilient, sustainable competitive advantage today.
Revenue Segmentation: The Strategic Mix
This visual comparison dissects how S&P Global Inc. and MSCI Inc. diversify their income streams and where their primary sector bets lie:
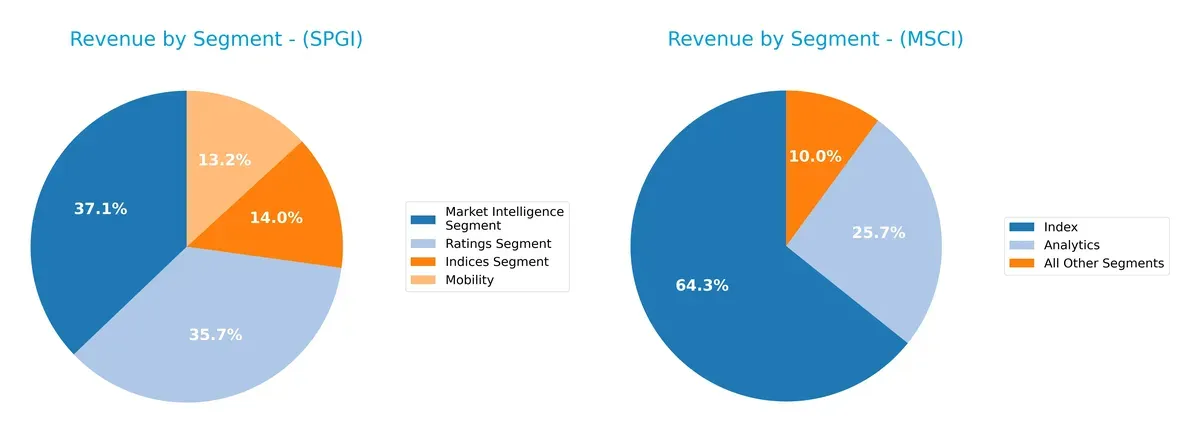
S&P Global anchors revenue in Market Intelligence at $4.9B and Ratings at $4.7B, showing a balanced, multi-segment portfolio. MSCI relies heavily on its Index segment at $1.8B, with Analytics and smaller segments trailing. S&P’s diverse mix reduces concentration risk, strengthening ecosystem lock-in. MSCI’s dominance in Index revenue highlights infrastructure control but carries higher exposure to single-segment shifts.
Strengths and Weaknesses Comparison
This table compares the strengths and weaknesses of S&P Global Inc. and MSCI Inc. based on diversification, profitability, financials, innovation, global presence, and market share:
S&P Global Inc. Strengths
- Diversified revenue streams across four main segments
- Favorable net margin at 29.15%
- Strong interest coverage at 22.7
- Solid debt to assets ratio at 22.19%
- Extensive global presence with significant US and Europe sales
- High fixed asset turnover at 55.17
MSCI Inc. Strengths
- Highest net margin at 38.36%
- Strong ROIC at 35.6% exceeding WACC
- Favorable PB ratio despite negative value
- Interest coverage at 8.12 remains sound
- Global revenue diversified across Americas, EMEA, Asia
- Balanced asset turnover at 0.55
S&P Global Inc. Weaknesses
- Unfavorable current ratio at 0.82 indicates liquidity risk
- High PE and PB ratios suggest overvaluation
- Low asset turnover at 0.25 limits asset efficiency
- Dividend yield low at 0.73%
- ROE and ROIC only neutral, near WACC
- Heavy reliance on US market for revenue
MSCI Inc. Weaknesses
- Negative ROE at -45.29% signals profitability issues
- Debt to assets exceeds 100%, posing financial risk
- Slightly unfavorable current ratio at 0.9
- PE ratio above 36 signals high valuation
- Dividend yield moderate at 1.26%
- Lower fixed asset turnover at 15.66
Both companies display strong profitability and global reach but face liquidity and valuation pressures. S&P Global shows more asset efficiency; MSCI posts superior ROIC but suffers from negative ROE and high leverage. These factors shape each firm’s strategic priorities in risk management and growth.
The Moat Duel: Analyzing Competitive Defensibility
A structural moat is the only reliable barrier protecting long-term profits from relentless competition erosion. Let’s examine the moats of two financial data giants:
S&P Global Inc.: Intangible Assets & Brand Authority
S&P Global’s moat stems from its trusted brand and proprietary credit ratings. Yet, its declining ROIC signals deteriorating capital efficiency. Expansion into new markets could stabilize margins but risks remain.
MSCI Inc.: Network Effects & Data Analytics
MSCI leverages strong network effects through its indexes and analytics platforms. Its growing ROIC and margin expansion reflect robust competitive positioning. ESG and private assets offer promising growth avenues in 2026.
Moat Strength Showdown: Intangible Assets vs. Network Effects
MSCI’s rapidly growing ROIC and scalable platform reveal a deeper, more sustainable moat than S&P Global’s eroding profitability. MSCI stands better poised to defend and expand its market share.
Which stock offers better returns?
The past year shows both S&P Global Inc. and MSCI Inc. in bearish territory with notable price declines and distinct trading dynamics shaping their paths.
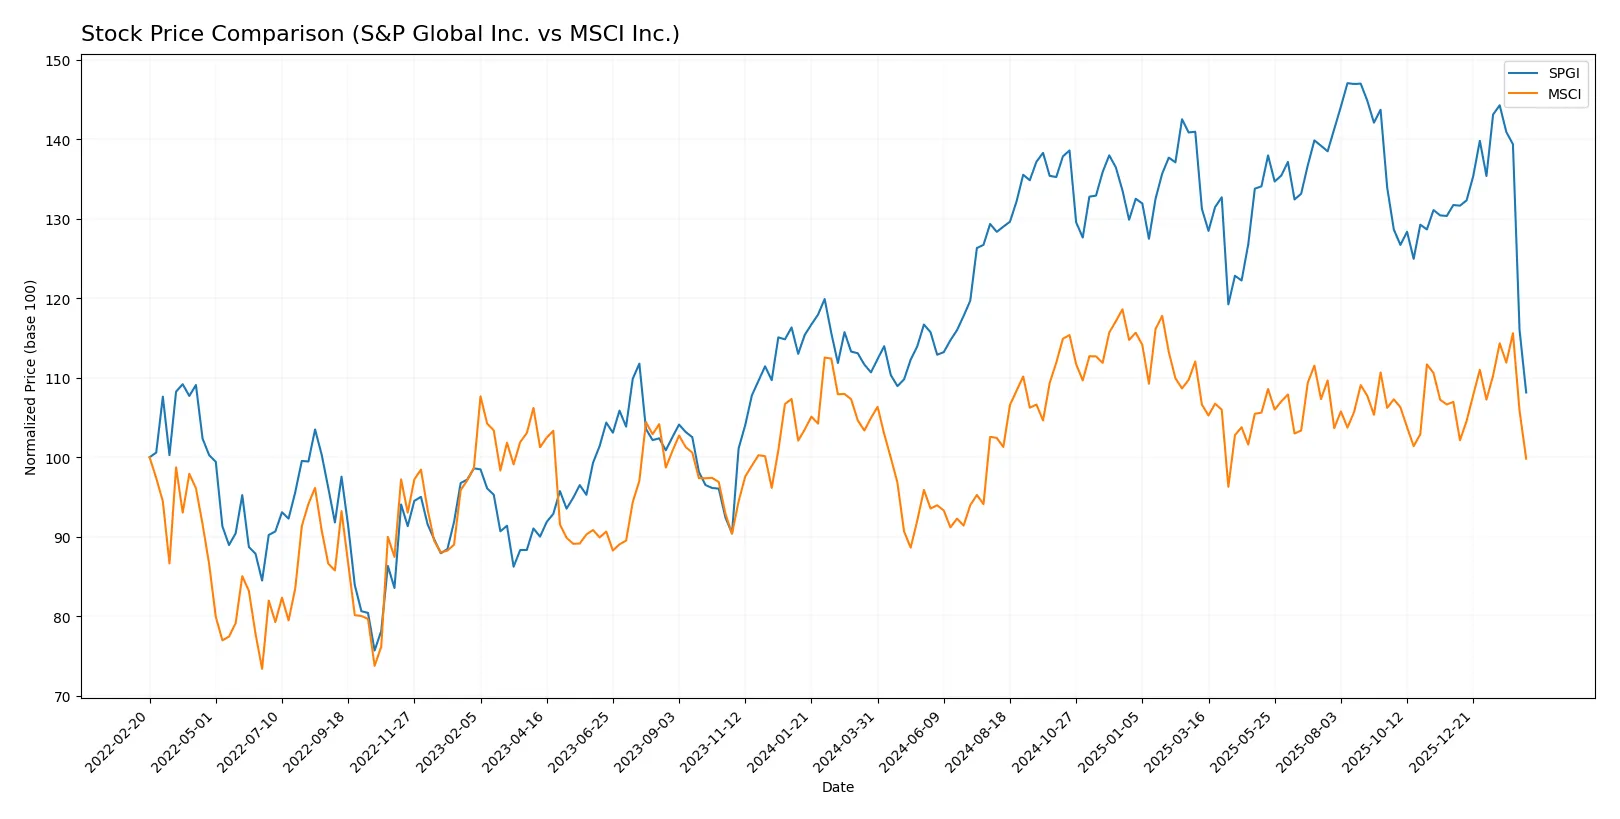
Trend Comparison
S&P Global Inc. exhibits a -2.29% decline over the past 12 months, marking a bearish trend with a deceleration in price drop and a high volatility level of 36.86. The recent three-month phase worsened, showing a -17.9% drop and seller dominance.
MSCI Inc. also faces a bearish trend with a -4.89% fall over 12 months but shows acceleration in decline, supported by a volatility of 35.55. Its recent period reflects a milder -6.68% drop with neutral buyer-seller balance.
Comparing both, MSCI’s stock shows a larger overall loss and accelerating weakness, while S&P Global’s trend decelerates. MSCI delivered the lower market performance over the past year.
Target Prices
Analysts show confident upside potential for both S&P Global Inc. and MSCI Inc. based on their target price consensus.
| Company | Target Low | Target High | Consensus |
|---|---|---|---|
| S&P Global Inc. | 482 | 627 | 544.75 |
| MSCI Inc. | 618 | 715 | 664.5 |
The target consensus for S&P Global Inc. sits 33% above its current 410 price, signaling strong growth expectations. MSCI’s consensus price stands 26% above today’s 526, reflecting robust analyst optimism.

Don’t Let Luck Decide Your Entry Point
Optimize your entry points with our advanced ProRealTime indicators. You’ll get efficient buy signals with precise price targets for maximum performance. Start outperforming now!
How do institutions grade them?
S&P Global Inc. Grades
The table below summarizes recent institutional grades for S&P Global Inc.:
| Grading Company | Action | New Grade | Date |
|---|---|---|---|
| BMO Capital | Maintain | Outperform | 2026-02-12 |
| Mizuho | Maintain | Outperform | 2026-02-12 |
| Stifel | Maintain | Buy | 2026-02-11 |
| Evercore ISI Group | Maintain | Outperform | 2026-02-11 |
| RBC Capital | Maintain | Outperform | 2026-02-11 |
| Goldman Sachs | Maintain | Buy | 2026-02-11 |
| Wells Fargo | Maintain | Overweight | 2026-02-11 |
| Goldman Sachs | Maintain | Buy | 2026-02-09 |
| Morgan Stanley | Maintain | Overweight | 2026-01-13 |
| Evercore ISI Group | Maintain | Outperform | 2026-01-08 |
MSCI Inc. Grades
The table below summarizes recent institutional grades for MSCI Inc.:
| Grading Company | Action | New Grade | Date |
|---|---|---|---|
| Wells Fargo | Maintain | Equal Weight | 2026-01-29 |
| Evercore ISI Group | Maintain | Outperform | 2026-01-29 |
| Wells Fargo | Maintain | Equal Weight | 2026-01-14 |
| Wells Fargo | Maintain | Equal Weight | 2025-10-29 |
| UBS | Maintain | Buy | 2025-10-29 |
| Barclays | Maintain | Overweight | 2025-10-29 |
| JP Morgan | Maintain | Overweight | 2025-10-29 |
| Evercore ISI Group | Maintain | Outperform | 2025-10-14 |
| JP Morgan | Maintain | Overweight | 2025-09-10 |
| Wells Fargo | Maintain | Equal Weight | 2025-07-23 |
Which company has the best grades?
S&P Global Inc. consistently receives higher ratings such as “Outperform,” “Buy,” and “Overweight.” MSCI Inc. shows more “Equal Weight” ratings with fewer “Buy” or “Outperform” grades. Investors may interpret S&P Global’s stronger consensus grades as greater institutional confidence.
Risks specific to each company
The following categories identify the critical pressure points and systemic threats facing both firms in the 2026 market environment:
1. Market & Competition
S&P Global Inc.
- Faces intense competition in credit ratings and analytics with pressure on pricing from new entrants and technology disruption.
MSCI Inc.
- Operates in a niche of investment decision tools but faces rising competition in ESG analytics and index licensing.
2. Capital Structure & Debt
S&P Global Inc.
- Maintains a conservative debt-to-equity ratio of 0.43 and favorable interest coverage at 22.7, indicating strong financial stability.
MSCI Inc.
- Exhibits a concerning debt-to-assets ratio above 110%, signaling potential over-leverage and higher financial risk despite decent interest coverage.
3. Stock Volatility
S&P Global Inc.
- Beta of 1.20 suggests moderate sensitivity to market swings, reflecting stable investor confidence.
MSCI Inc.
- Slightly higher beta of 1.28 indicates greater stock price volatility and exposure to market fluctuations.
4. Regulatory & Legal
S&P Global Inc.
- Subject to regulatory scrutiny in credit rating standards and data privacy laws, with potential compliance costs rising.
MSCI Inc.
- Faces increasing regulatory demands, especially in ESG disclosures and index licensing, which could impact operating costs.
5. Supply Chain & Operations
S&P Global Inc.
- Relies on technology infrastructure and data accuracy; risks include cyberattacks and service disruptions.
MSCI Inc.
- Depends heavily on data quality and integration; operational risks stem from technology failures and client data consolidation.
6. ESG & Climate Transition
S&P Global Inc.
- Growing ESG offerings but must continuously innovate to meet evolving investor demands and regulatory expectations.
MSCI Inc.
- ESG segment is a core growth driver but exposes MSCI to risks related to accuracy of climate data and potential greenwashing allegations.
7. Geopolitical Exposure
S&P Global Inc.
- Global footprint exposes it to geopolitical tensions affecting financial markets and commodity insights.
MSCI Inc.
- Geopolitical risks impact global investment flows and ESG regulations, influencing demand for MSCI’s products.
Which company shows a better risk-adjusted profile?
S&P Global’s most impactful risk lies in competitive pressure coupled with modest liquidity ratios, though its conservative leverage and strong interest coverage provide a solid buffer. MSCI’s biggest concern is its stretched capital structure, raising financial distress risk despite strong profitability and asset returns. Overall, S&P Global demonstrates a better risk-adjusted profile, supported by a safer Altman Z-Score and solid Piotroski Score. MSCI’s negative debt/equity and high leverage are red flags warranting caution.
Final Verdict: Which stock to choose?
S&P Global Inc. excels as a cash machine with solid operational cash flow and consistent income growth. Its point of vigilance lies in its below-par liquidity ratio, which may pressure short-term resilience. It fits well in aggressive growth portfolios seeking exposure to established market data leaders.
MSCI Inc. commands a strategic moat through its high return on invested capital and strong income margins. It offers a more favorable value creation profile but carries elevated debt risk compared to S&P Global. MSCI suits growth-at-a-reasonable-price (GARP) investors valuing durable competitive advantages with measured risk.
If you prioritize robust value creation and a sustainable competitive moat, MSCI outshines due to its expanding profitability and efficient capital use. However, if you seek stable cash generation with less financial leverage, S&P Global offers better stability despite its liquidity caution. Each stock appeals to distinct investor profiles balancing growth and risk tolerance.
Disclaimer: Investment carries a risk of loss of initial capital. The past performance is not a reliable indicator of future results. Be sure to understand risks before making an investment decision.
Go Further
I encourage you to read the complete analyses of S&P Global Inc. and MSCI Inc. to enhance your investment decisions: