Home > Comparison > Financial Services > NDAQ vs MSCI
The strategic rivalry between Nasdaq, Inc. and MSCI Inc. shapes the trajectory of the financial data and stock exchanges sector. Nasdaq operates as a technology-driven exchange operator with diversified marketplace services, while MSCI focuses on investment decision support through indices, analytics, and ESG solutions. This analysis explores their contrasting operational models and competitive positioning to identify which company offers superior risk-adjusted returns for a diversified portfolio.

Table of contents
Companies Overview
Nasdaq, Inc. and MSCI Inc. stand as pivotal players shaping financial data and investment decision tools markets worldwide.
Nasdaq, Inc.: Market Infrastructure Innovator
Nasdaq, Inc. dominates as a technology company serving capital markets globally. It generates revenue through trading, clearing, market data sales, and SaaS solutions for anti-financial crime compliance. In 2021, its strategic focus emphasized expanding Market Technology and Market Services, enhancing surveillance and clearing capabilities across asset classes.
MSCI Inc.: Investment Analytics Leader
MSCI Inc. excels as a provider of investment decision support tools for global asset managers. Its revenue streams stem from indexes, analytics, ESG products, and private asset insights. In 2021, MSCI concentrated on advancing ESG and Climate solutions, addressing investor demand for sustainability data and integrated risk management services.
Strategic Collision: Similarities & Divergences
Both firms leverage data-driven financial services but diverge philosophically: Nasdaq offers a broad exchange ecosystem, while MSCI delivers specialized analytics and ESG insights. Their primary battleground is institutional investment decision support, with Nasdaq focused on trading infrastructure and MSCI on performance benchmarking. These distinctions yield contrasting investment profiles—Nasdaq as a market operator and MSCI as an analytics powerhouse.
Income Statement Comparison
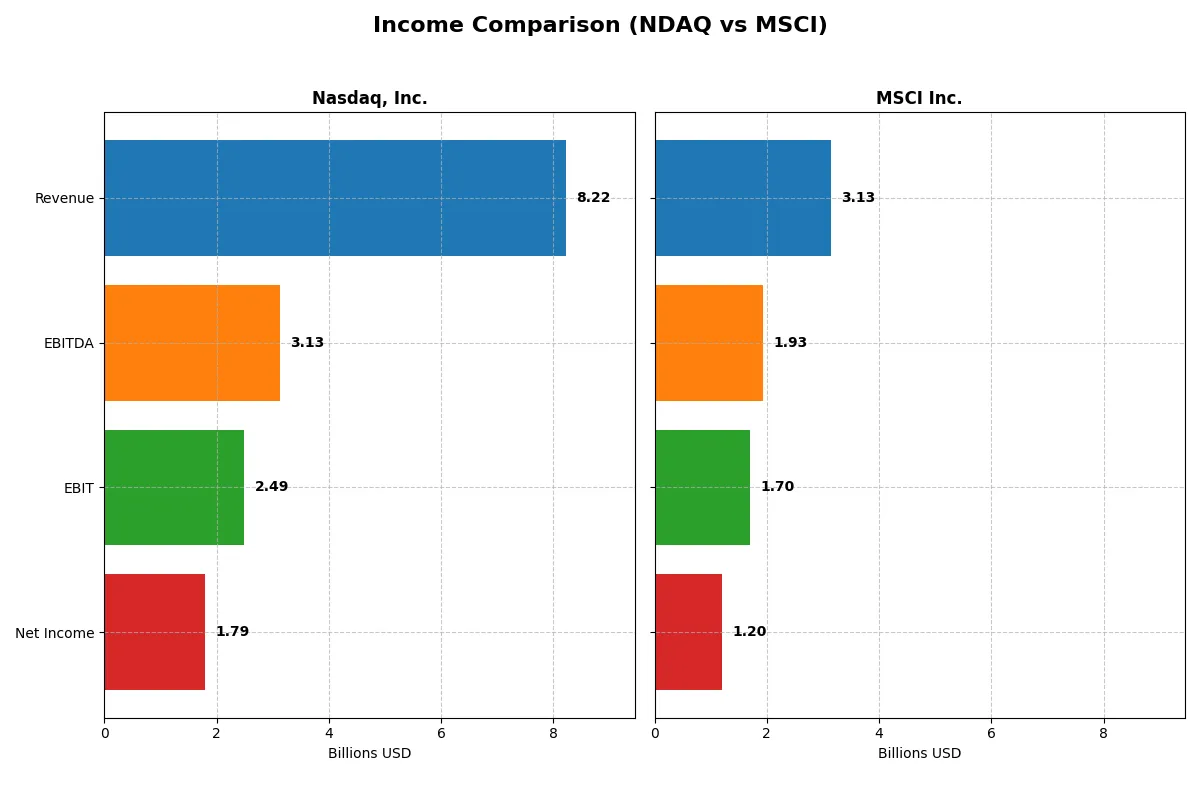
This data dissects the core profitability and scalability of both corporate engines to reveal who dominates the bottom line:
| Metric | Nasdaq, Inc. (NDAQ) | MSCI Inc. (MSCI) |
|---|---|---|
| Revenue | 8.22B | 3.13B |
| Cost of Revenue | 4.28B | 550M |
| Operating Expenses | 1.61B | 871M |
| Gross Profit | 3.94B | 2.58B |
| EBITDA | 3.13B | 1.93B |
| EBIT | 2.49B | 1.70B |
| Interest Expense | 88M | 210M |
| Net Income | 1.79B | 1.20B |
| EPS | 3.13 | 15.58 |
| Fiscal Year | 2025 | 2025 |
Income Statement Analysis: The Bottom-Line Duel
The income statement comparison reveals the true operational efficiency and profitability momentum of these two financial market leaders in 2025.
Nasdaq, Inc. Analysis
Nasdaq’s revenue grew steadily to $8.22B in 2025, up 11% from 2024, with net income surging 60% to $1.79B. Its gross margin stands at a solid 47.9%, and net margin improved to 21.8%, reflecting efficient cost control despite a slight uptick in operating expenses. The company’s momentum in profitability and EPS growth signals strong operational leverage.
MSCI Inc. Analysis
MSCI posted $3.13B in revenue for 2025, up nearly 10% year-over-year, with net income rising 8% to $1.20B. Its gross margin is robust at 82.4%, and net margin remains healthy at 38.4%, though net margin slipped slightly from the prior year. MSCI sustains excellent cost discipline and margin stability, supported by solid revenue growth and favorable EPS expansion.
Margin Strength vs. Scale Growth
Nasdaq demonstrates sharper net income and EPS growth with improving margins, capitalizing on operational efficiencies as revenue expands. MSCI leads in margin dominance and higher profitability ratios but shows less recent net margin improvement. Investors seeking strong margin profiles may favor MSCI, while those targeting accelerating profit growth might lean toward Nasdaq’s momentum.
Financial Ratios Comparison
These vital ratios act as a diagnostic tool to expose the underlying fiscal health, valuation premiums, and capital efficiency of the companies compared below:
| Ratios | Nasdaq, Inc. (NDAQ) | MSCI Inc. (MSCI) |
|---|---|---|
| ROE | 14.63% | -45.29% |
| ROIC | 8.26% | 35.60% |
| P/E | 30.98 | 36.82 |
| P/B | 4.53 | -16.68 |
| Current Ratio | 1.01 | 0.90 |
| Quick Ratio | 1.01 | 0.90 |
| D/E | 0.81 | -2.38 |
| Debt-to-Assets | 31.97% | 110.65% |
| Interest Coverage | 26.49 | 8.16 |
| Asset Turnover | 0.26 | 0.55 |
| Fixed Asset Turnover | 6.99 | 15.66 |
| Payout ratio | 33.59% | 46.29% |
| Dividend yield | 1.08% | 1.26% |
| Fiscal Year | 2025 | 2025 |
Efficiency & Valuation Duel: The Vital Signs
Financial ratios form the DNA of a company, unveiling hidden risks and highlighting operational strengths essential for investment decisions.
Nasdaq, Inc.
Nasdaq posts a solid 14.6% ROE and a 21.8% net margin, signaling consistent profitability. Its P/E of 31 and P/B of 4.53 suggest a somewhat stretched valuation. The company balances shareholder returns with a modest 1.08% dividend yield, reflecting steady income alongside reinvestment in growth.
MSCI Inc.
MSCI shows an impressive 38.4% net margin and a strong 35.6% ROIC, indicating operational efficiency. However, its negative ROE and unusually low P/B hint at accounting complexities. The P/E of 36.8 marks an expensive stock. MSCI offers a 1.26% dividend yield, balancing payouts with sustained R&D investments.
Premium Valuation vs. Operational Safety
MSCI delivers higher operational returns but carries valuation and ROE concerns, increasing risk. Nasdaq trades cheaper, with more consistent shareholder returns and financial stability. Investors favoring growth with caution might lean toward Nasdaq’s steadier profile, while risk-tolerant investors may consider MSCI’s operational upside.
Which one offers the Superior Shareholder Reward?
I compare Nasdaq, Inc. (NDAQ) and MSCI Inc. (MSCI) on distribution philosophy, dividend yield, payout ratio, and buyback intensity. Nasdaq yields 1.08% with a 33.6% payout, supported by steady free cash flow (3.49/share). Its buybacks are moderate but consistent. MSCI offers a comparable 1.26% yield, a higher 46.3% payout ratio, and robust free cash flow (20.08/share), alongside aggressive buybacks. Nasdaq’s conservative payout ensures sustainability amid moderate leverage (debt/equity 0.81). MSCI’s higher leverage and payout ratio pose risks but reward growth investors craving total return. In 2026, I favor MSCI for superior total shareholder return, balancing strong cash generation and buyback intensity despite leverage risks.
Comparative Score Analysis: The Strategic Profile
The radar chart reveals the fundamental DNA and trade-offs of Nasdaq, Inc. and MSCI Inc., highlighting their core financial strengths and weaknesses:
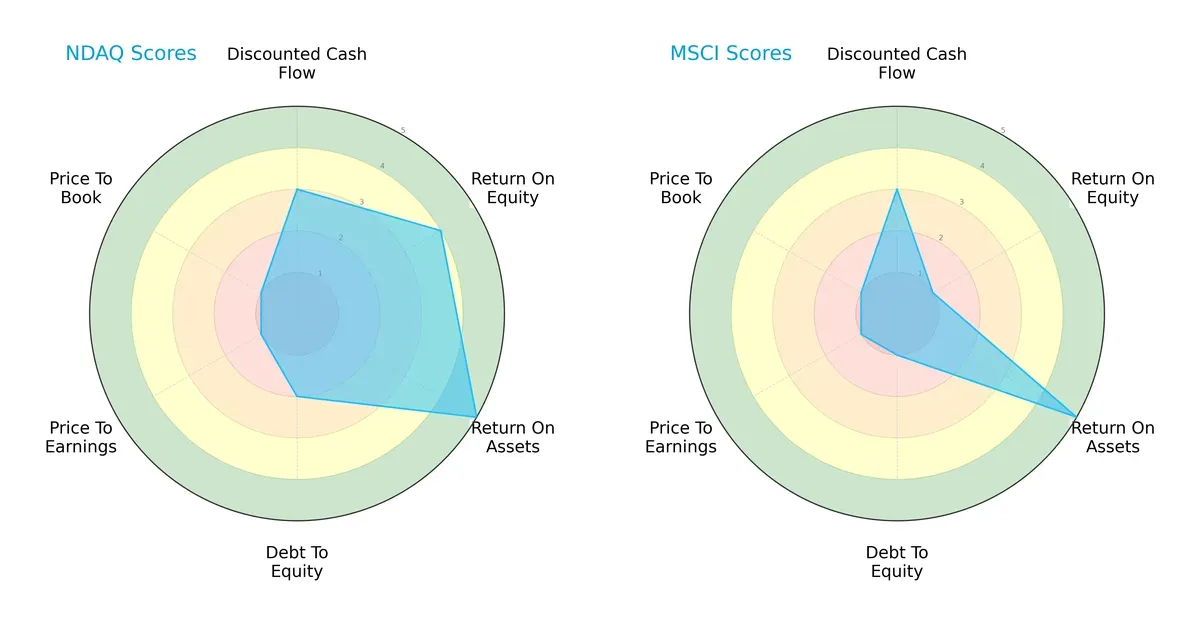
Nasdaq shows a balanced profile with solid ROE (4) and ROA (5) scores, reflecting efficient profitability and asset use. However, its debt-to-equity (2) and valuation metrics (PE and PB at 1) signal financial leverage risks and overvaluation concerns. MSCI excels in asset utilization (ROA 5) but lags in ROE (1) and carries higher financial risk with a debt-to-equity score of 1. Both firms face valuation challenges, but Nasdaq’s diversified strengths give it a more stable footing.
Bankruptcy Risk: Solvency Showdown
The Altman Z-Score gap between Nasdaq (2.41, grey zone) and MSCI (5.67, safe zone) signals diverging solvency outlooks in this cycle:
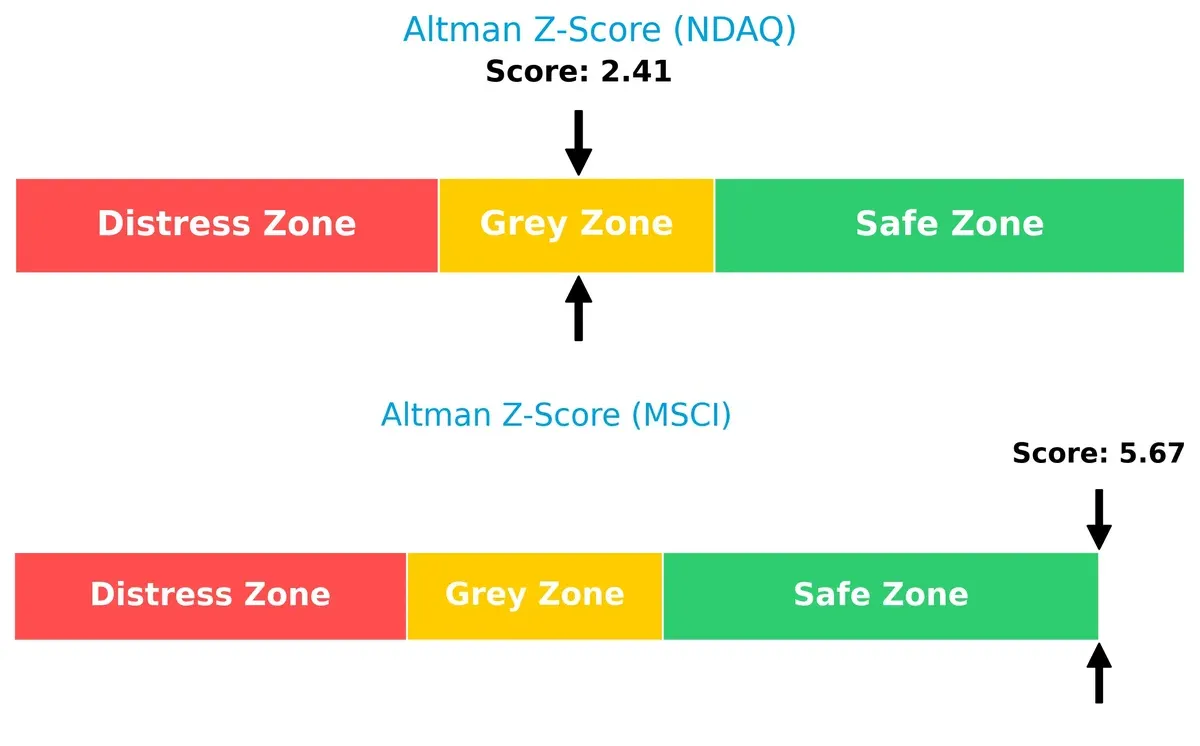
MSCI’s high Z-Score places it firmly in the safe zone, indicating strong long-term survival odds. Nasdaq’s grey-zone score warns of moderate bankruptcy risk, demanding cautious monitoring amid market volatility.
Financial Health: Quality of Operations
Nasdaq’s perfect Piotroski F-Score (9) edges out MSCI’s strong score (8), reflecting superior operational quality and financial robustness:

Nasdaq demonstrates peak financial health with no red flags, while MSCI, though very strong, shows slightly less internal metric strength. Investors should prize Nasdaq’s operational excellence as a competitive advantage.
How are the two companies positioned?
This section dissects Nasdaq and MSCI’s operational DNA by comparing their revenue distribution by segment and internal dynamics. The goal is to confront their economic moats to identify the more resilient, sustainable competitive advantage in today’s market.
Revenue Segmentation: The Strategic Mix
This visual comparison dissects how Nasdaq, Inc. and MSCI Inc. diversify their income streams and where their primary sector bets lie:
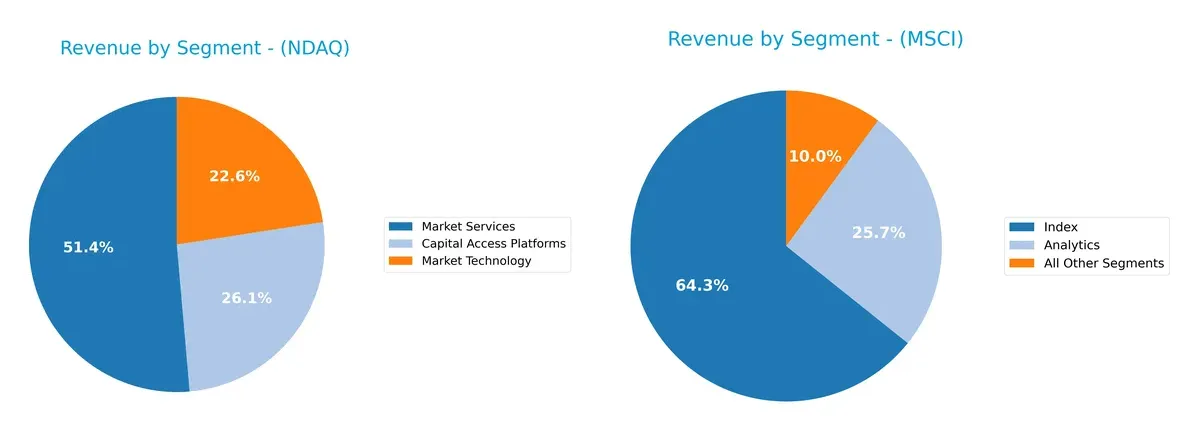
Nasdaq anchors its revenue with Market Services at $4.2B in 2025, supported by Capital Access Platforms and Market Technology, showing moderate diversification. MSCI, by contrast, pivots heavily on its Index segment at $1.79B, with Analytics and other segments trailing. Nasdaq’s broader mix suggests a strategic push into ecosystem lock-in, while MSCI’s concentration signals reliance on data dominance but exposes it to higher segment-specific risk.
Strengths and Weaknesses Comparison
This table compares the strengths and weaknesses of Nasdaq and MSCI based on diversification, profitability, financials, innovation, global presence, and market share:
Nasdaq Strengths
- Diverse revenue streams across Capital Access, Market Technology, and Market Services
- Favorable net margin at 21.77%
- Strong interest coverage at 28.34
- Favorable fixed asset turnover at 6.99
- Significant US revenue dominance with growing Non-US sales
MSCI Strengths
- Highest net margin at 38.36%
- Strong ROIC of 35.6% indicating efficient capital allocation
- Favorable debt-to-equity ratio at -2.38
- Favorable fixed asset turnover at 15.66
- Broad global footprint with balanced revenue across Americas, EMEA, and Asia
Nasdaq Weaknesses
- Unfavorable valuation multiples with PE of 30.98 and PB of 4.53
- Neutral ROE at 14.63% suggests average shareholder returns
- Low asset turnover at 0.26 indicates less efficient use of assets
- Current ratio at 1.01 only neutral, signaling tight liquidity
MSCI Weaknesses
- Negative ROE at -45.29% indicates shareholder value erosion
- Unfavorable debt-to-assets at 110.65% signals high leverage risk
- Unfavorable current ratio at 0.9 implies liquidity concerns
- PE ratio of 36.82 is expensive relative to earnings
Both Nasdaq and MSCI show slightly favorable overall financial health but face distinct challenges. Nasdaq’s strengths lie in diversified revenues and strong liquidity, while MSCI excels in profitability and capital efficiency but struggles with leverage and shareholder returns. These contrasts highlight different strategic priorities for sustaining growth and managing financial risk.
The Moat Duel: Analyzing Competitive Defensibility
A structural moat is the only reliable shield protecting long-term profits from relentless competition erosion. Let’s dissect how Nasdaq and MSCI defend their turf:
Nasdaq, Inc.: Diversified Market Infrastructure Moat
Nasdaq’s moat stems from intangible assets and network effects in market technology and exchange services. Despite stable margins, its ROIC lags below WACC with a declining trend, signaling eroding profitability. Expansion into anti-financial crime SaaS may deepen its moat if execution succeeds in 2026.
MSCI Inc.: High-Margin Analytics and Indexing Moat
MSCI’s moat is anchored in intangible assets and high switching costs from proprietary indexes and analytics tools. It consistently earns ROIC far above WACC with a robust upward trend. Its growing ESG and climate data offerings position MSCI to broaden its moat amid rising regulatory demands.
Market Infrastructure Moat vs. Proprietary Analytics Moat
MSCI holds a deeper, more sustainable moat than Nasdaq, demonstrated by superior ROIC and margin profiles. MSCI’s expanding product suite and capital-efficient growth better equip it to defend and extend market share in 2026. Nasdaq’s moat appears more vulnerable without reversing its profitability decline.
Which stock offers better returns?
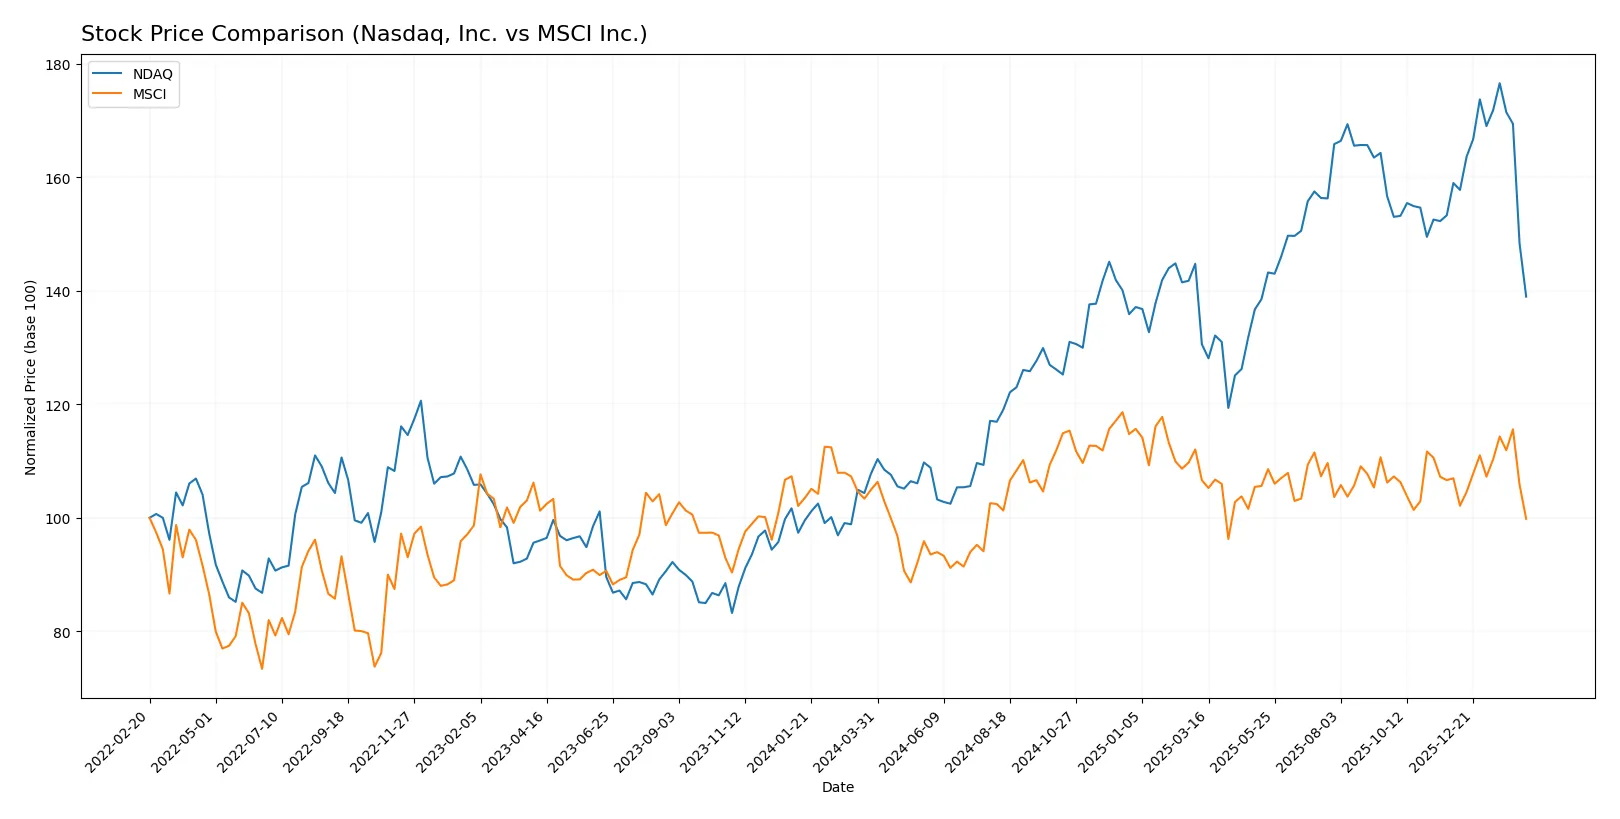
The past year reveals contrasting price dynamics: Nasdaq, Inc. rallies strongly before slowing, while MSCI Inc. experiences a steady decline despite accelerating volatility.
Trend Comparison
Nasdaq, Inc. posted a bullish 28.95% gain over 12 months, with price acceleration slowing. It hit a high of 100.98 and a low of 58.6, showing moderate volatility (11.69 std dev).
MSCI Inc. declined 4.89% over the same period, marking a bearish trend. Volatility surged (35.55 std dev), with accelerating downward momentum and prices ranging from 467.04 to 625.1.
Nasdaq, Inc. outperformed MSCI Inc. over 12 months, delivering stronger returns despite recent deceleration, while MSCI’s trend remained negative with rising volatility.
Target Prices
Analysts set a bullish consensus on Nasdaq, Inc. and MSCI Inc., reflecting strong growth potential.
| Company | Target Low | Target High | Consensus |
|---|---|---|---|
| Nasdaq, Inc. | 100 | 120 | 111.8 |
| MSCI Inc. | 618 | 715 | 664.5 |
The target consensus prices exceed current trading levels—Nasdaq at $79.47 and MSCI at $526.06—indicating substantial upside potential. Analyst expectations suggest market confidence in both companies’ strategic positioning.

Don’t Let Luck Decide Your Entry Point
Optimize your entry points with our advanced ProRealTime indicators. You’ll get efficient buy signals with precise price targets for maximum performance. Start outperforming now!
How do institutions grade them?
Nasdaq, Inc. Grades
The following table summarizes recent institutional grades for Nasdaq, Inc.:
| Grading Company | Action | New Grade | Date |
|---|---|---|---|
| Barclays | Maintain | Overweight | 2026-01-30 |
| Morgan Stanley | Maintain | Overweight | 2026-01-30 |
| RBC Capital | Maintain | Outperform | 2026-01-30 |
| TD Cowen | Maintain | Hold | 2026-01-30 |
| JP Morgan | Maintain | Overweight | 2026-01-30 |
| Morgan Stanley | Maintain | Overweight | 2026-01-15 |
| TD Cowen | Maintain | Hold | 2026-01-14 |
| UBS | Maintain | Buy | 2026-01-12 |
| JP Morgan | Maintain | Overweight | 2026-01-12 |
| Barclays | Maintain | Overweight | 2026-01-08 |
MSCI Inc. Grades
The following table summarizes recent institutional grades for MSCI Inc.:
| Grading Company | Action | New Grade | Date |
|---|---|---|---|
| Wells Fargo | Maintain | Equal Weight | 2026-01-29 |
| Evercore ISI Group | Maintain | Outperform | 2026-01-29 |
| Wells Fargo | Maintain | Equal Weight | 2026-01-14 |
| Wells Fargo | Maintain | Equal Weight | 2025-10-29 |
| UBS | Maintain | Buy | 2025-10-29 |
| Barclays | Maintain | Overweight | 2025-10-29 |
| JP Morgan | Maintain | Overweight | 2025-10-29 |
| Evercore ISI Group | Maintain | Outperform | 2025-10-14 |
| JP Morgan | Maintain | Overweight | 2025-09-10 |
| Wells Fargo | Maintain | Equal Weight | 2025-07-23 |
Which company has the best grades?
Nasdaq, Inc. holds consistently stronger grades with multiple Overweight and Outperform ratings, whereas MSCI Inc. primarily receives Equal Weight and Overweight grades. This suggests Nasdaq may be viewed more favorably by analysts, potentially impacting investor confidence and portfolio positioning.
Risks specific to each company
The following categories identify the critical pressure points and systemic threats facing both firms in the 2026 market environment:
1. Market & Competition
Nasdaq, Inc.
- Faces intense competition in exchange technology and market data sectors; innovation pace is crucial.
MSCI Inc.
- Competes in specialized investment analytics and ESG data; differentiation depends on proprietary indices and tools.
2. Capital Structure & Debt
Nasdaq, Inc.
- Maintains a neutral debt-to-equity ratio of 0.81, indicating balanced leverage and manageable financial risk.
MSCI Inc.
- Exhibits unfavorable debt metrics with debt-to-assets over 110%, signaling potential over-leverage and higher financial risk.
3. Stock Volatility
Nasdaq, Inc.
- Beta near 1.02 suggests stock moves closely with the market, indicating moderate volatility.
MSCI Inc.
- Beta at 1.28 implies higher sensitivity to market swings and increased stock price volatility risk.
4. Regulatory & Legal
Nasdaq, Inc.
- Subject to stringent financial market regulations worldwide; compliance costs are significant but well-managed.
MSCI Inc.
- Faces evolving ESG and data privacy regulations; regulatory changes could impact product offerings and data licensing.
5. Supply Chain & Operations
Nasdaq, Inc.
- Operational exposure primarily to technology infrastructure; resilience depends on cloud and cybersecurity robustness.
MSCI Inc.
- Relies on data acquisition and analytics platforms; operational risks include data integrity and platform uptime.
6. ESG & Climate Transition
Nasdaq, Inc.
- Growing focus on green finance products positions company well but requires ongoing ESG integration.
MSCI Inc.
- ESG and climate analytics are core business segments; must innovate continuously to maintain leadership amid rising investor demand.
7. Geopolitical Exposure
Nasdaq, Inc.
- Global market presence exposes Nasdaq to trade tensions and geopolitical uncertainties affecting capital flows.
MSCI Inc.
- International client base creates vulnerability to regulatory divergence and geopolitical instability in key regions.
Which company shows a better risk-adjusted profile?
Nasdaq’s most impactful risk is moderate stock volatility and competitive pressure in a fast-evolving market tech sector. MSCI’s largest threat lies in over-leveraged capital structure and elevated stock volatility. Despite MSCI’s strong profitability, Nasdaq demonstrates a better risk-adjusted profile with balanced leverage, steadier market sensitivity, and robust operational resilience. Recent debt-to-assets data for MSCI signals elevated risk that warrants cautious monitoring.
Final Verdict: Which stock to choose?
Nasdaq, Inc. stands out as a robust cash generator with solid income growth and operational efficiency. Its key point of vigilance is a slightly weakening return on invested capital, signaling challenges in sustaining value creation. It fits well within an Aggressive Growth portfolio seeking momentum and income upside.
MSCI Inc. boasts a formidable strategic moat with exceptional capital efficiency and a growing ROIC, reflecting a durable competitive advantage. While it carries a higher risk profile than Nasdaq, it offers greater stability in profitability. MSCI suits a GARP (Growth at a Reasonable Price) strategy focused on sustainable value creation.
If you prioritize steady income growth and operational momentum, Nasdaq, Inc. is the compelling choice due to its cash flow strength and bullish trend. However, if you seek durable competitive advantage and superior capital returns, MSCI offers better stability and a very favorable moat despite recent valuation pressures. Both present analytical scenarios worth considering depending on your risk tolerance and investment horizon.
Disclaimer: Investment carries a risk of loss of initial capital. The past performance is not a reliable indicator of future results. Be sure to understand risks before making an investment decision.
Go Further
I encourage you to read the complete analyses of Nasdaq, Inc. and MSCI Inc. to enhance your investment decisions: