Home > Comparison > Financial Services > MCO vs MSCI
The strategic rivalry between Moody’s Corporation and MSCI Inc. shapes the landscape of financial data and analytics. Moody’s operates as a capital-intensive risk assessment powerhouse, while MSCI excels as a diversified provider of investment decision tools and ESG analytics. This head-to-head highlights a clash between deep credit expertise and broad-based index innovation. This analysis will identify which trajectory offers superior risk-adjusted returns for a diversified portfolio in the evolving financial services sector.

Table of contents
Companies Overview
Moody’s Corporation and MSCI Inc. stand as pivotal players in financial data and analytics, shaping global investment decisions.
Moody’s Corporation: Global Risk Assessment Leader
Moody’s Corporation dominates as a global risk assessment firm. Its core revenue stems from credit rating services and risk management solutions across 140 countries. In 2026, Moody’s sharpens its focus on expanding Moody’s Analytics, enhancing subscription-based research and software to deepen market penetration and diversify its analytical product suite.
MSCI Inc.: Investment Decision Support Innovator
MSCI Inc. leads as a provider of investment decision support tools. It generates revenue through indexes, risk analytics, ESG data, and private asset insights. MSCI’s 2026 strategy emphasizes ESG and climate-related offerings, aligning with growing investor demand for sustainability-focused portfolio management and regulatory compliance tools.
Strategic Collision: Similarities & Divergences
Both firms serve institutional investors with data-driven insights but differ in approach. Moody’s relies on a credit rating-centric model, while MSCI integrates broad investment analytics, including ESG and indexes. Their battleground centers on portfolio risk evaluation and sustainable investing. Moody’s offers a stable, diversified income profile; MSCI provides growth through innovation in ESG and private asset analytics.
Income Statement Comparison
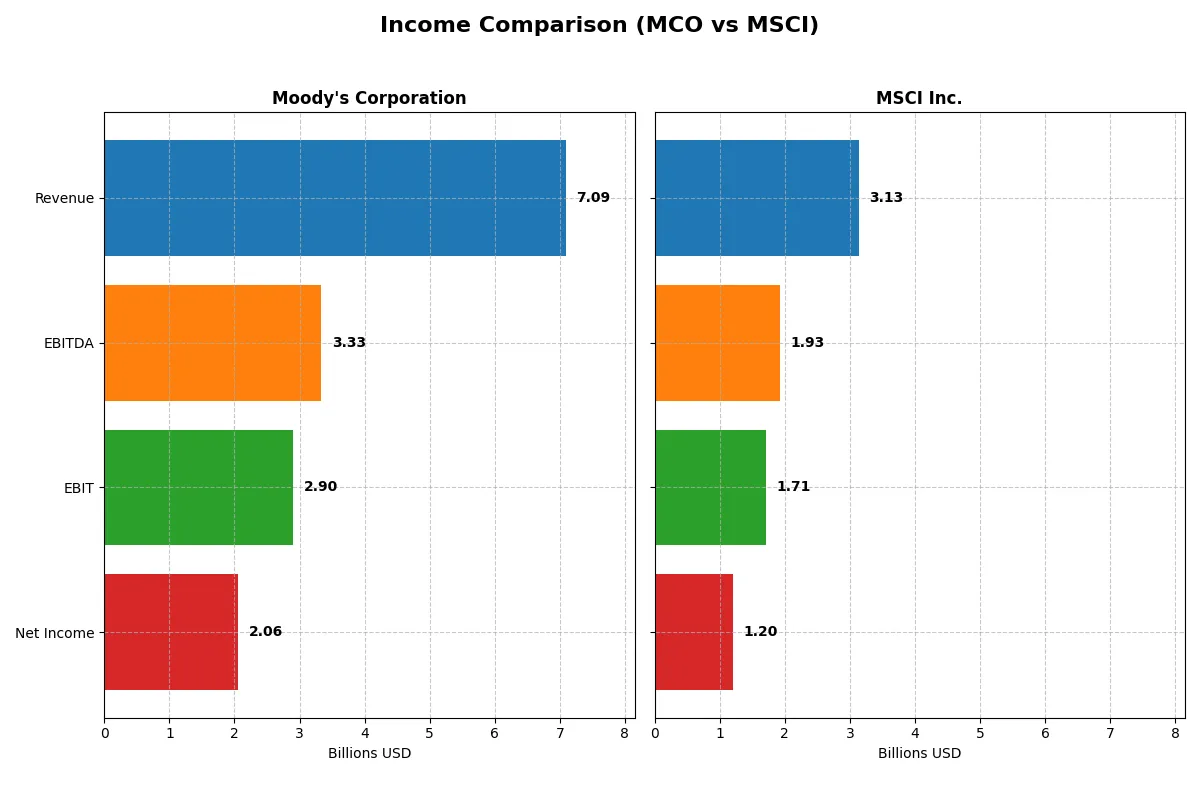
This data dissects the core profitability and scalability of both corporate engines to reveal who dominates the bottom line:
| Metric | Moody’s Corporation (MCO) | MSCI Inc. (MSCI) |
|---|---|---|
| Revenue | 7.09B | 2.86B |
| Cost of Revenue | 2.38B | 514M |
| Operating Expenses | 1.74B | 813M |
| Gross Profit | 4.71B | 2.34B |
| EBITDA | 3.33B | 1.75B |
| EBIT | 2.90B | 1.54B |
| Interest Expense | 204M | 185.5M |
| Net Income | 2.06B | 1.11B |
| EPS | 11.32 | 14.09 |
| Fiscal Year | 2024 | 2024 |
Income Statement Analysis: The Bottom-Line Duel
This income statement comparison will reveal which company converts top-line growth into bottom-line efficiency most effectively.
Moody’s Corporation Analysis
Moody’s revenue grew 19.8% from 2023 to 2024, reaching $7.1B, with net income rising 28.1% to $2.06B. The company maintains strong margins: a gross margin of 66.4% and a net margin of 29.0%, signaling solid cost control. Its 2024 EBIT margin surged to 41.0%, reflecting operational momentum and disciplined expense management.
MSCI Inc. Analysis
MSCI posted a 9.8% revenue increase in 2025 to $3.13B, with net income climbing 8.4% to $1.20B. It boasts superior margin health, with a gross margin of 82.4% and net margin at 38.4%, outperforming typical sector benchmarks. The 2025 EBIT margin of 54.7% underscores MSCI’s operational efficiency despite a slight recent dip in net margin growth.
Margin Strength vs. Revenue Expansion
Moody’s leads in absolute revenue and net income, growing steadily with healthy margins. MSCI, while smaller, delivers higher profitability ratios and stronger long-term growth in net income and EPS. For investors prioritizing scale and consistent margin improvement, Moody’s stands out. Those favoring leaner operations and margin dominance may find MSCI’s profile more compelling.
Financial Ratios Comparison
These vital ratios act as a diagnostic tool to expose the underlying fiscal health, valuation premiums, and capital efficiency of the companies compared below:
| Ratios | Moody’s Corporation (MCO) | MSCI Inc. (MSCI) |
|---|---|---|
| ROE | 57.7% | -118.0% |
| ROIC | 17.8% | 0% |
| P/E | 41.8 | 42.6 |
| P/B | 24.1 | -50.2 |
| Current Ratio | 1.43 | 0.85 |
| Quick Ratio | 1.43 | 0.85 |
| D/E | 2.17 | 0 |
| Debt-to-Assets | 50.0% | 85.5% |
| Interest Coverage | 14.6 | 8.2 |
| Asset Turnover | 0.46 | 0.52 |
| Fixed Asset Turnover | 8.13 | 15.0 |
| Payout ratio | 30.1% | 45.9% |
| Dividend yield | 0.72% | 1.08% |
| Fiscal Year | 2024 | 2024 |
Efficiency & Valuation Duel: The Vital Signs
Financial ratios act as the company’s DNA, revealing hidden risks and operational excellence beneath headline figures.
Moody’s Corporation
Moody’s delivers stellar profitability with a 57.7% ROE and a robust 29% net margin, signaling operational dominance. However, its valuation appears stretched, with a high P/E of 41.8 and P/B of 24.1. Dividend yield is modest at 0.72%, reflecting a cautious shareholder return stance amid solid cash flow generation.
MSCI Inc.
MSCI posts an impressive 38.4% net margin but shows zero ROE and ROIC data, raising concerns about capital efficiency. Its P/E of 36.8 indicates expensive stock pricing, while the absence of debt improves risk profile. A dividend yield of 1.26% provides moderate income, supported by investment in R&D and growth initiatives.
Premium Valuation vs. Operational Safety
Moody’s offers superior profitability but at a premium valuation with moderate shareholder yield. MSCI’s profile shows mixed signals with expensive pricing but less debt and better dividend yield. Investors prioritizing operational strength may prefer Moody’s; those favoring income and lower leverage might lean toward MSCI.
Which one offers the Superior Shareholder Reward?
I see Moody’s (MCO) delivers a modest 0.72% dividend yield with a sustainable 30% payout ratio backed by strong free cash flow coverage (3.03x). Its buyback program adds meaningful shareholder value, complementing dividends. MSCI offers a higher 1.26% yield but pays out 46% of earnings, raising sustainability concerns despite robust margins. MSCI’s buybacks are sizable, enhancing total returns but leverage metrics suggest tighter financial flexibility. Historically, Moody’s conservative distribution and balanced capital allocation promote steadier long-term growth. In 2026, I favor Moody’s for a superior total return profile driven by a more sustainable payout and disciplined buybacks.
Comparative Score Analysis: The Strategic Profile
The radar chart reveals the fundamental DNA and trade-offs of Moody’s Corporation and MSCI Inc., highlighting their strategic strengths and weaknesses across key financial metrics:
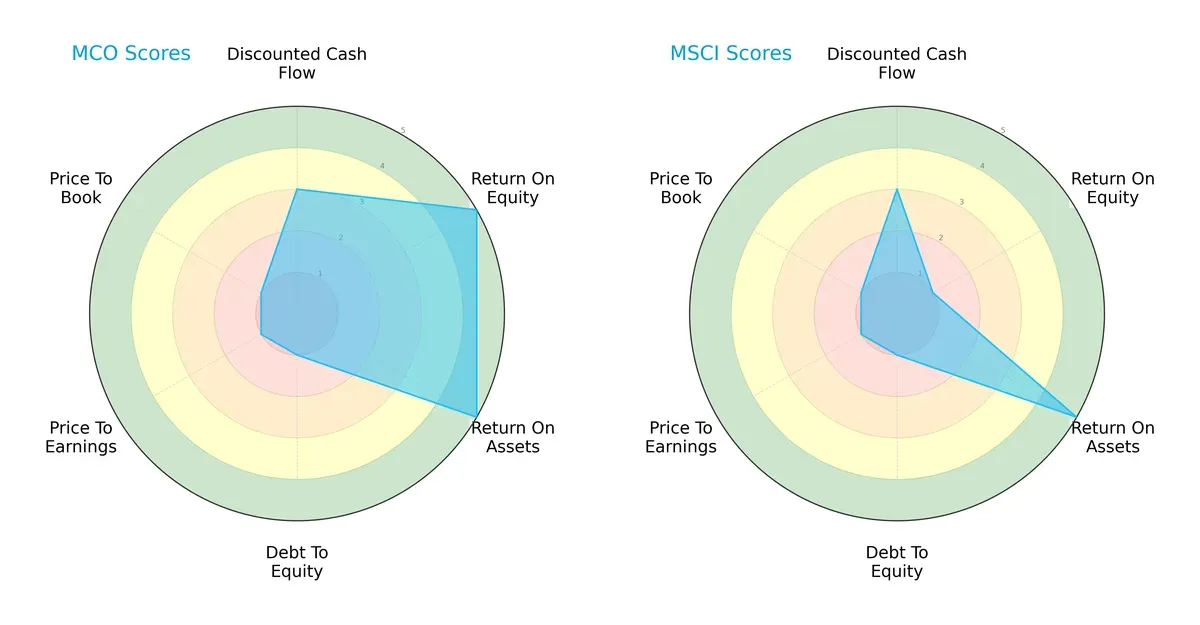
Moody’s Corporation shows a balanced profile with very favorable ROE and ROA scores (5 each), indicating superior profitability and asset efficiency. However, it struggles with financial leverage and valuation, scoring very unfavorable (1) on debt-to-equity, P/E, and P/B ratios. MSCI Inc. matches Moody’s in asset efficiency but scores very unfavorable on ROE (1), suggesting weaker equity returns. Both firms share weak valuation and leverage metrics. Moody’s edges ahead on profitability; MSCI lacks balance and relies more on asset utilization.
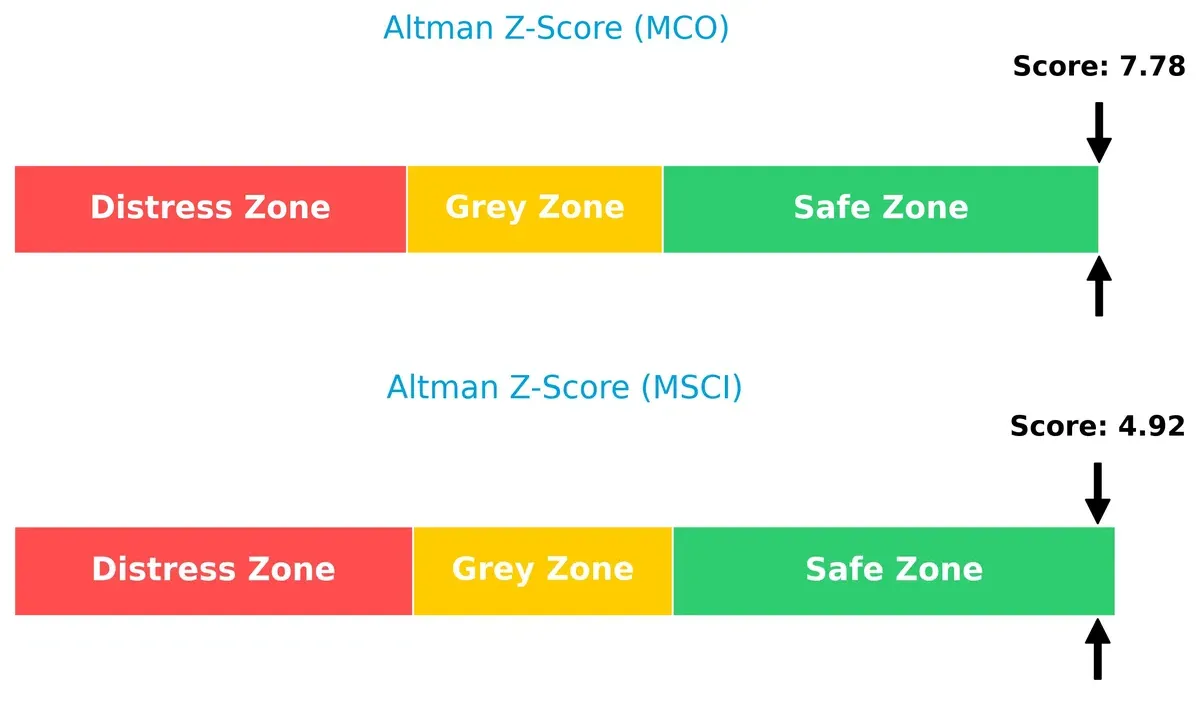
Bankruptcy Risk: Solvency Showdown
Moody’s Altman Z-Score of 7.78 significantly outpaces MSCI’s 4.92, implying Moody’s enjoys a stronger buffer against bankruptcy risks in this cycle:
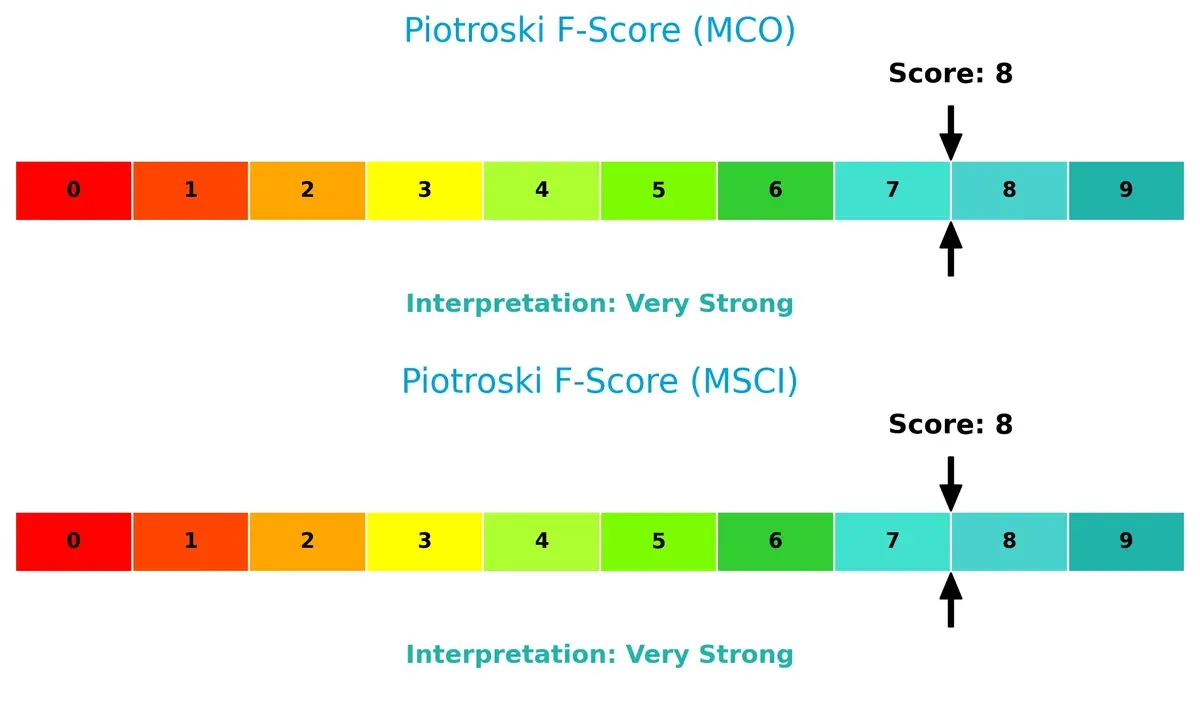
Financial Health: Quality of Operations
Both Moody’s and MSCI score an 8 on the Piotroski F-Score, reflecting very strong operational health and no immediate red flags in internal financial metrics:
How are the two companies positioned?
This section dissects the operational DNA of Moody’s and MSCI by comparing their revenue distribution and internal strengths and weaknesses. The goal is to confront their economic moats to identify which business model offers the most resilient, sustainable competitive advantage today.
Revenue Segmentation: The Strategic Mix
This comparison dissects how Moody’s Corporation and MSCI Inc. diversify their income streams and highlights their primary sector focus:
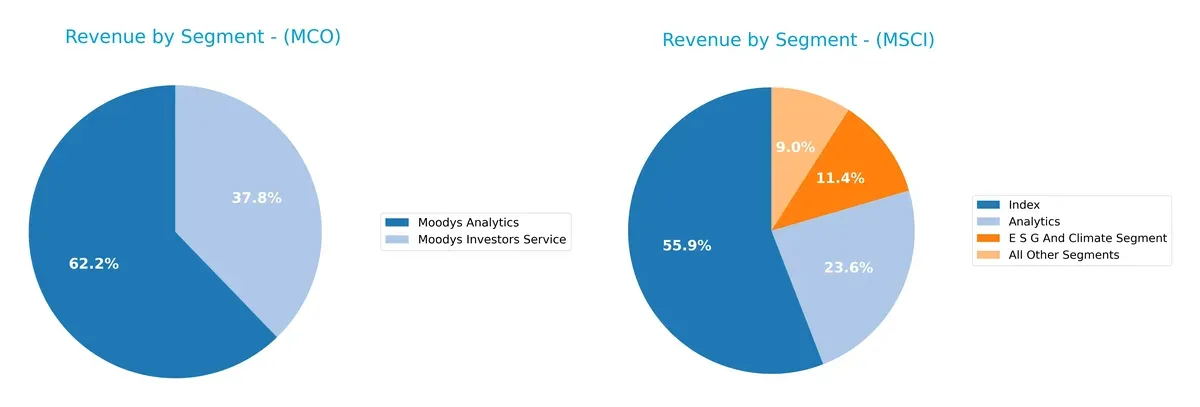
Moody’s revenue splits mainly between Analytics at $4.41B and Investors Service at $2.68B, showing a balanced two-segment model. MSCI pivots on its Index segment, generating $1.60B, nearly double its Analytics at $675M, with meaningful contributions from ESG and other segments. Moody’s diversified approach reduces concentration risk, while MSCI’s reliance on Index underscores infrastructure dominance but elevates exposure to market cycles.
Strengths and Weaknesses Comparison
This table compares the Strengths and Weaknesses of Moody’s Corporation and MSCI Inc.:
Moody’s Corporation Strengths
- Strong profitability with 29.03% net margin and 57.73% ROE
- Favorable quick ratio and interest coverage
- Diversified revenue streams in Analytics and Investors Service segments
- Significant global presence with strong EMEA and Asia Pacific revenues
MSCI Inc. Strengths
- Higher net margin at 38.36%
- Favorable debt metrics with zero debt-to-assets and debt-to-equity
- Solid interest coverage ratio of 8.16
- Diversified revenues across Index, Analytics, and ESG segments
- Broad geographic exposure including Americas and EMEA
Moody’s Corporation Weaknesses
- High valuation multiples with PE at 41.82 and PB at 24.14
- Unfavorable WACC and debt-to-equity ratio at 2.17
- Lower asset turnover at 0.46
- Dividend yield is low at 0.72%
- Debt level near 50% of assets is a caution
MSCI Inc. Weaknesses
- Zero reported ROE and ROIC indicate weak profitability measures
- Unfavorable current and quick ratios at 0
- Unfavorable asset and fixed asset turnover at 0
- PE ratio relatively high at 36.82
- Limited financial data transparency with unavailable WACC
Moody’s exhibits strong profitability and global diversification but faces valuation and leverage concerns. MSCI shows robust margins and clean balance sheet metrics, yet lacks key profitability ratios and liquidity strength. Both companies display differentiated strategic focuses through their segment and geographic diversification.
The Moat Duel: Analyzing Competitive Defensibility
A structural moat alone protects long-term profits from relentless competitive erosion. Let’s examine how Moody’s and MSCI defend their turf:
Moody’s Corporation: Intangible Assets and Regulatory Entrenchment
Moody’s moat stems from powerful intangible assets—trusted credit ratings and regulatory reliance. This manifests in strong ROIC above WACC, sustaining robust margins near 30%. New analytics products and global expansion in 2026 could deepen this advantage but watch regulatory changes.
MSCI Inc.: Network Effects and Data Ecosystem Lock-in
MSCI’s competitive edge lies in dominant index and ESG data networks, locking in institutional clients. Margins soar above 38%, with impressive revenue growth fueling expansion into climate analytics. However, MSCI’s ROIC trend shows decline, signaling caution despite growth opportunities.
Moat Depth: Intangible Assets vs. Network Effects
Moody’s exhibits a wider moat with consistent value creation and regulatory barriers. MSCI commands a strong network effect but faces ROIC erosion that may weaken its moat over time. Moody’s is better positioned to defend its market share amid rising global competition.
Which stock offers better returns?
Over the past year, both Moody’s Corporation and MSCI Inc. have shown strong upward price movements with accelerating trends and dominant buyer activity, reflecting robust trading dynamics.
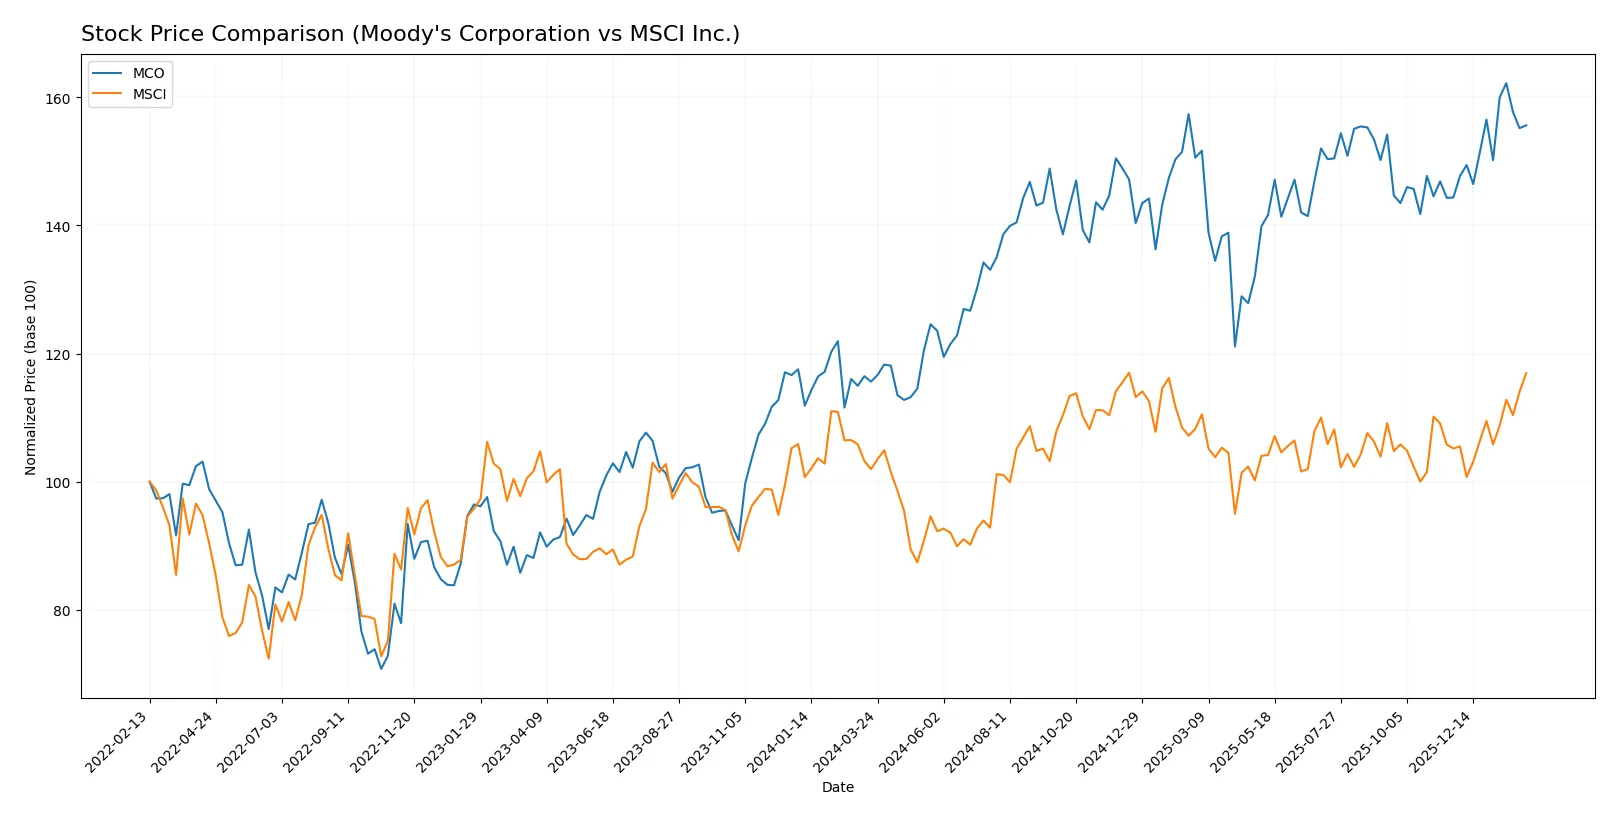
Trend Comparison
Moody’s Corporation’s stock rose 34.59% over the past 12 months, showing a bullish trend with accelerating momentum and a high volatility level of 39.49%. The price ranged from 374.67 to 538.92.
MSCI Inc. posted a 14.69% gain over the same period, also bullish with acceleration. Volatility is slightly lower at 36.04%, with price highs at 625.1 and lows at 467.04.
Comparing both, Moody’s delivered the stronger market performance with a more significant price increase and higher volatility than MSCI over the last year.
Target Prices
Analysts present a bullish consensus for Moody’s Corporation and MSCI Inc., indicating potential upside from current prices.
| Company | Target Low | Target High | Consensus |
|---|---|---|---|
| Moody’s Corporation | 507 | 620 | 561.3 |
| MSCI Inc. | 618 | 715 | 664.5 |
Moody’s target consensus at 561.3 suggests a modest upside from the current 517.05 price. MSCI’s 664.5 consensus implies a stronger rally potential above the current 624.75 price.

Don’t Let Luck Decide Your Entry Point
Optimize your entry points with our advanced ProRealTime indicators. You’ll get efficient buy signals with precise price targets for maximum performance. Start outperforming now!
How do institutions grade them?
Below is a summary of institutional grades assigned to Moody’s Corporation and MSCI Inc.:
Moody’s Corporation Grades
This table lists recent grades Moody’s Corporation received from key financial institutions.
| Grading Company | Action | New Grade | Date |
|---|---|---|---|
| Wells Fargo | Maintain | Overweight | 2026-01-14 |
| Morgan Stanley | Maintain | Equal Weight | 2026-01-13 |
| Daiwa Capital | Upgrade | Outperform | 2026-01-13 |
| Evercore ISI Group | Maintain | Outperform | 2026-01-08 |
| Stifel | Upgrade | Buy | 2026-01-05 |
| Goldman Sachs | Upgrade | Buy | 2025-12-16 |
| Mizuho | Maintain | Neutral | 2025-10-28 |
| Stifel | Maintain | Hold | 2025-10-23 |
| Wells Fargo | Maintain | Overweight | 2025-10-23 |
| JP Morgan | Maintain | Overweight | 2025-10-23 |
MSCI Inc. Grades
This table summarizes recent grades MSCI Inc. received from major analysts and banks.
| Grading Company | Action | New Grade | Date |
|---|---|---|---|
| Evercore ISI Group | Maintain | Outperform | 2026-01-29 |
| Wells Fargo | Maintain | Equal Weight | 2026-01-29 |
| Wells Fargo | Maintain | Equal Weight | 2026-01-14 |
| JP Morgan | Maintain | Overweight | 2025-10-29 |
| UBS | Maintain | Buy | 2025-10-29 |
| Barclays | Maintain | Overweight | 2025-10-29 |
| Wells Fargo | Maintain | Equal Weight | 2025-10-29 |
| Evercore ISI Group | Maintain | Outperform | 2025-10-14 |
| JP Morgan | Maintain | Overweight | 2025-09-10 |
| Wells Fargo | Maintain | Equal Weight | 2025-07-23 |
Which company has the best grades?
Moody’s Corporation shows more upgrades to Buy and Outperform grades than MSCI, which mostly maintains current ratings. This could influence investor sentiment favorably toward Moody’s, indicating stronger recent institutional conviction.
Risks specific to each company
The following categories identify critical pressure points and systemic threats facing Moody’s Corporation (MCO) and MSCI Inc. in the 2026 market environment:
1. Market & Competition
Moody’s Corporation
- Faces intense competition in credit ratings and analytics; market leadership challenged by fintech innovations.
MSCI Inc.
- Strong in index and ESG analytics but vulnerable to rapid innovation and new market entrants.
2. Capital Structure & Debt
Moody’s Corporation
- High debt-to-equity ratio (2.17) signals leverage risk despite strong interest coverage.
MSCI Inc.
- Minimal or no reported debt, indicating conservative capital structure and lower financial risk.
3. Stock Volatility
Moody’s Corporation
- Beta of 1.44 shows above-market volatility, reflecting sensitivity to market swings.
MSCI Inc.
- Beta of 1.30 indicates moderate volatility but still above average for stable financial firms.
4. Regulatory & Legal
Moody’s Corporation
- Ratings business exposed to regulatory scrutiny globally; reputational risk remains elevated.
MSCI Inc.
- ESG and index services face evolving regulations, increasing compliance complexity and costs.
5. Supply Chain & Operations
Moody’s Corporation
- Relies on data quality and technology platforms; operational disruptions could impair service delivery.
MSCI Inc.
- Technology and data integration critical; operational risks tied to system upgrades and client data accuracy.
6. ESG & Climate Transition
Moody’s Corporation
- ESG integration in analytics growing but behind MSCI’s specialized ESG segment.
MSCI Inc.
- Leads in ESG and climate risk analytics, but rapid regulatory changes pose adaptation challenges.
7. Geopolitical Exposure
Moody’s Corporation
- Global footprint exposes it to geopolitical tensions affecting credit markets and sovereign ratings.
MSCI Inc.
- Global client base and data sourcing vulnerable to geopolitical disruptions and trade restrictions.
Which company shows a better risk-adjusted profile?
Moody’s faces the greatest risk from its leveraged capital structure, while MSCI’s most significant risk lies in regulatory and operational complexities linked to ESG leadership. Moody’s higher leverage introduces financial risk despite robust profitability, whereas MSCI’s conservative debt profile and strong ESG positioning offer a more balanced risk-adjusted profile. Notably, Moody’s debt-to-equity ratio near 2.2 contrasts sharply with MSCI’s near-zero debt, justifying heightened caution on Moody’s financial resilience.
Final Verdict: Which stock to choose?
Moody’s Corporation’s superpower lies in its unyielding ability to generate robust returns on invested capital, creating tangible value despite a slight decline in profitability. Its moderate leverage and premium valuation demand vigilance. Moody’s suits investors seeking aggressive growth fueled by strong operational efficiency.
MSCI Inc. boasts a strategic moat rooted in its high-margin, recurring revenue model and exceptional gross profitability. While it offers a safer balance sheet profile than Moody’s, some key metrics lack full transparency, requiring cautious interpretation. MSCI fits well within GARP portfolios aiming for steady growth with a defensive tilt.
If you prioritize aggressive growth backed by proven value creation and operational strength, Moody’s outshines with its superior ROIC and cash flow generation. However, if you seek more stability combined with a durable revenue moat, MSCI offers better stability and recurring income potential, albeit at a premium and with some metric uncertainties.
Disclaimer: Investment carries a risk of loss of initial capital. The past performance is not a reliable indicator of future results. Be sure to understand risks before making an investment decision.
Go Further
I encourage you to read the complete analyses of Moody’s Corporation and MSCI Inc. to enhance your investment decisions: