Home > Comparison > Technology > MSI vs ZBRA
The strategic rivalry between Motorola Solutions, Inc. and Zebra Technologies Corporation shapes the future of the communication equipment sector. Motorola Solutions operates as a capital-intensive provider of mission-critical communications and integrated security systems. In contrast, Zebra Technologies excels as a high-margin specialist in asset intelligence and enterprise mobility solutions. This analysis will explore which company’s operational model delivers superior risk-adjusted returns for a diversified technology portfolio.
Table of contents
Companies Overview
Motorola Solutions and Zebra Technologies dominate the communication equipment sector with distinct approaches and scale.
Motorola Solutions, Inc.: Mission-Critical Communications Leader
Motorola Solutions commands the mission-critical communications market through its dual segments: Products and Systems Integration, and Software and Services. It generates revenue primarily by selling infrastructure, devices, and video security systems to government and commercial clients. In 2026, the company focuses heavily on expanding its software and cybersecurity services to enhance public safety and enterprise command centers.
Zebra Technologies Corporation: Enterprise Asset Intelligence Specialist
Zebra Technologies excels in enterprise asset intelligence, providing automatic identification and data capture solutions globally. Its revenue stems from printers, scanners, RFID products, and cloud-based software subscriptions tailored to industries like retail and healthcare. The company’s 2026 strategy targets growth in real-time location systems and robotics automation to boost supply chain visibility and efficiency.
Strategic Collision: Similarities & Divergences
Both firms operate in communication equipment but diverge in business philosophy. Motorola emphasizes closed, integrated solutions for secure, mission-critical uses, while Zebra pursues an open, data-driven ecosystem enhancing asset visibility. Their primary battleground lies in public safety versus enterprise logistics. Motorola offers a defensive investment profile with steady government contracts, whereas Zebra targets growth through innovation and industry diversification.
Income Statement Comparison
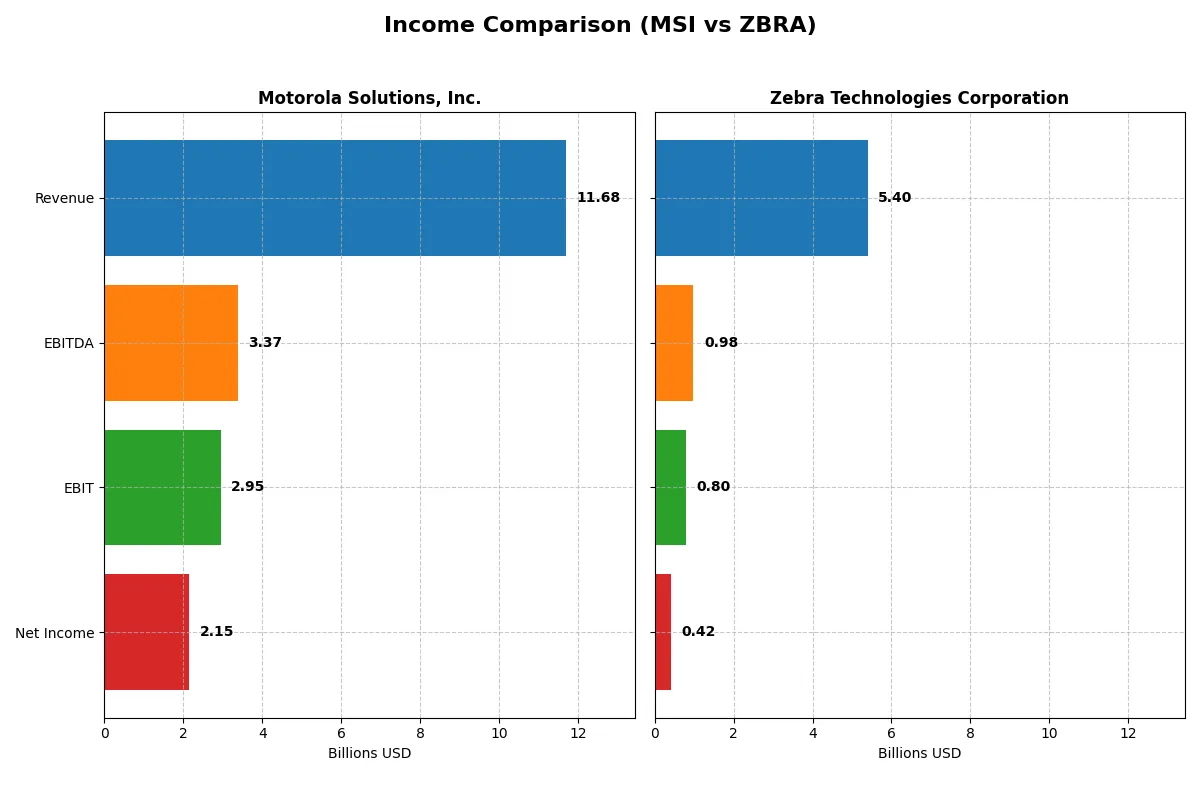
This data dissects the core profitability and scalability of both corporate engines to reveal who dominates the bottom line:
| Metric | Motorola Solutions, Inc. (MSI) | Zebra Technologies Corporation (ZBRA) |
|---|---|---|
| Revenue | 11.7B | 5.4B |
| Cost of Revenue | 5.6B | 2.9B |
| Operating Expenses | 2.8B | 1.7B |
| Gross Profit | 6.0B | 2.5B |
| EBITDA | 3.4B | 985M |
| EBIT | 2.9B | 800M |
| Interest Expense | 302M | 108M |
| Net Income | 2.2B | 419M |
| EPS | 12.93 | 8.24 |
| Fiscal Year | 2025 | 2025 |
Income Statement Analysis: The Bottom-Line Duel
This income statement comparison uncovers which company converts revenue into profit more efficiently and sustains healthier margins.
Motorola Solutions, Inc. Analysis
Motorola Solutions grew revenue steadily from $8.2B in 2021 to $11.7B in 2025, with net income surging from $1.25B to $2.15B. Its gross margin stays robust at 51.7%, while net margin improved to 18.4%, signaling strong operational efficiency and momentum in 2025. EBIT margin of 25.2% confirms solid profitability.
Zebra Technologies Corporation Analysis
Zebra’s revenue fluctuated, peaking at $5.8B in 2022 but dropping to $5.4B by 2025. Net income halved from $837M in 2021 to $419M in 2025, reflecting margin pressure. Its gross margin of 45.9% and net margin of 7.8% lag behind MSI. The latest year shows weaker profitability and declining EPS, indicating operational challenges.
Margin Power vs. Revenue Scale
Motorola Solutions dominates with superior margin expansion and consistent revenue growth, doubling net income over five years. Zebra struggles with shrinking profitability and stagnant revenues. For investors, Motorola’s profile offers clearer earnings resilience and operational strength, while Zebra faces headwinds limiting its fundamental appeal.
Financial Ratios Comparison
These vital ratios act as a diagnostic tool to expose the underlying fiscal health, valuation premiums, and capital efficiency of the companies compared:
| Ratios | Motorola Solutions, Inc. (MSI) | Zebra Technologies Corporation (ZBRA) |
|---|---|---|
| ROE | 89.4% | 11.7% |
| ROIC | 16.1% | 8.8% |
| P/E | 29.6 | 29.5 |
| P/B | 26.5 | 3.44 |
| Current Ratio | 1.04 | 0.97 |
| Quick Ratio | 0.87 | 0.58 |
| D/E (Debt-to-Equity) | 4.19 | 0.78 |
| Debt-to-Assets | 52.1% | 33.1% |
| Interest Coverage | 9.76 | 7.41 |
| Asset Turnover | 0.60 | 0.63 |
| Fixed Asset Turnover | 6.69 | 10.40 |
| Payout ratio | 33.8% | 0% |
| Dividend yield | 1.14% | 0% |
| Fiscal Year | 2025 | 2025 |
Efficiency & Valuation Duel: The Vital Signs
Financial ratios act as a company’s DNA, exposing hidden risks and operational strengths essential for informed investment decisions.
Motorola Solutions, Inc.
Motorola Solutions delivers robust profitability with an 89.38% ROE and an 18.44% net margin, signaling operational excellence. Its valuation appears stretched, with a high P/E of 29.65 and a P/B of 26.5. The firm supports shareholders through a modest 1.14% dividend yield, balancing returns with reinvestment in R&D.
Zebra Technologies Corporation
Zebra shows moderate profitability, with an 11.68% ROE and a 7.77% net margin, reflecting steady but less dynamic operations. The stock is similarly expensive, trading at a P/E near 29.45 but with a far lower P/B of 3.44. Zebra does not pay dividends, focusing capital on growth and innovation instead.
Premium Valuation vs. Operational Safety
Motorola exhibits superior profitability and a stronger operational moat but at a stretched valuation. Zebra’s metrics suggest more conservative returns with a weaker margin profile and higher financial risk. Investors prioritizing profitability may favor Motorola; those seeking growth without dividends might lean toward Zebra.
Which one offers the Superior Shareholder Reward?
Motorola Solutions (MSI) offers a balanced shareholder reward through a 1.14% dividend yield and a 34% payout ratio, underpinned by strong free cash flow coverage (90%). Its steady buyback program enhances total returns. Zebra Technologies (ZBRA) pays no dividend but aggressively reinvests in growth and maintains a robust buyback profile, supporting capital appreciation. I find MSI’s dividend-plus-buyback approach more sustainable in 2026, given its consistent cash flows and moderate leverage. ZBRA’s reinvestment strategy suits growth investors but carries higher risk without dividend income. For total return seekers prioritizing steady income and capital return, MSI edges ahead in 2026.
Comparative Score Analysis: The Strategic Profile
The radar chart reveals the fundamental DNA and trade-offs of Motorola Solutions, Inc. and Zebra Technologies Corporation:
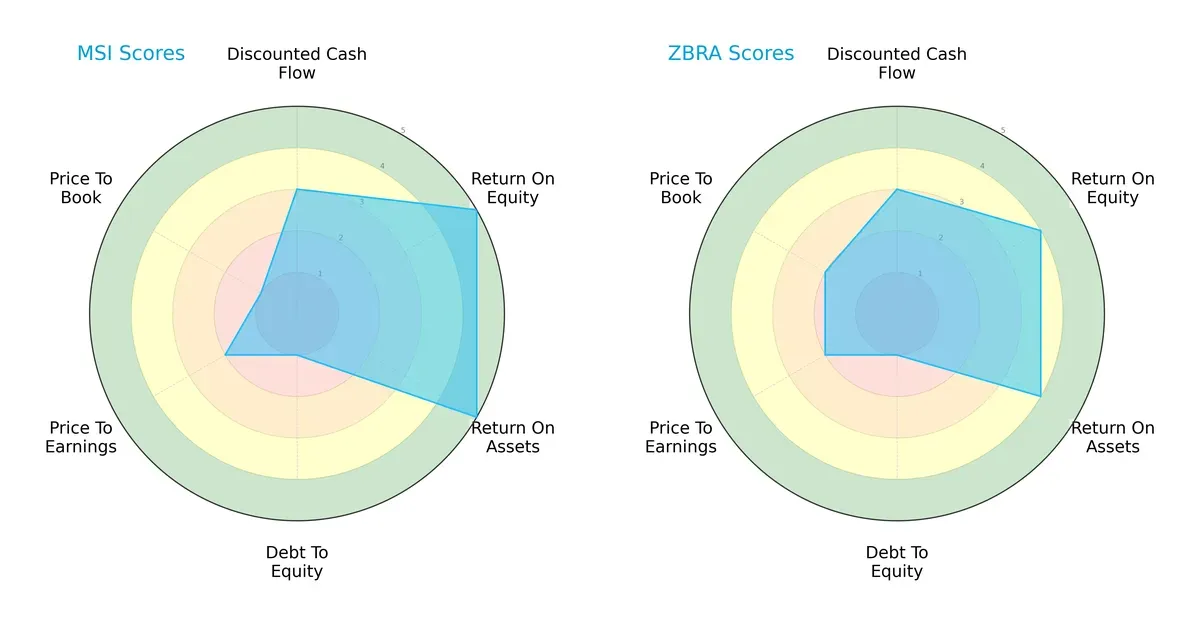
Motorola exhibits superior returns with ROE and ROA scores of 5 versus Zebra’s 4, signaling more efficient profit generation and asset use. Both share moderate DCF scores of 3, indicating similar valuation expectations. Each suffers from weak debt profiles (score 1), raising financial risk concerns. Zebra holds a slight edge in price-to-book valuation (score 2 vs. 1), suggesting marginally better market pricing. Overall, Motorola’s profile is less balanced, relying heavily on operational efficiency, while Zebra presents a steadier valuation mix.
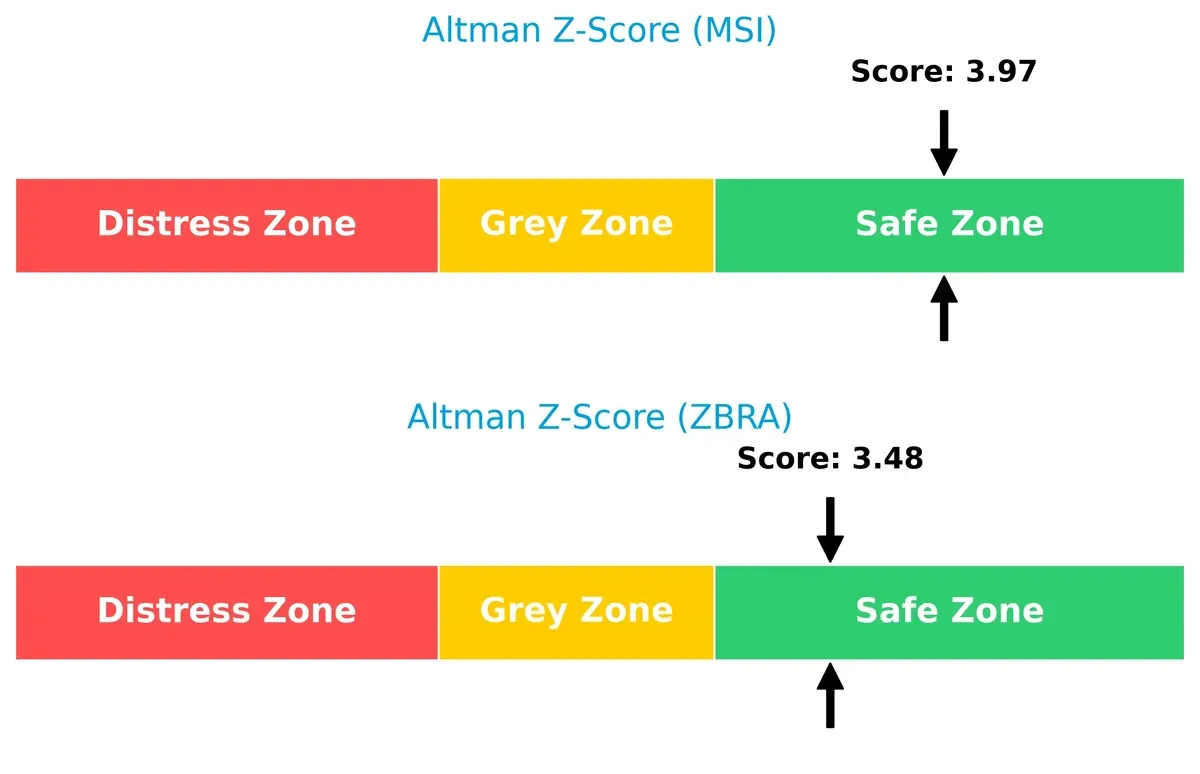
Bankruptcy Risk: Solvency Showdown
Motorola’s Altman Z-Score of 3.97 edges out Zebra’s 3.48, both safely above the distress threshold, indicating strong solvency. This gap suggests Motorola is better positioned to withstand economic downturns and credit stress in the current cycle:
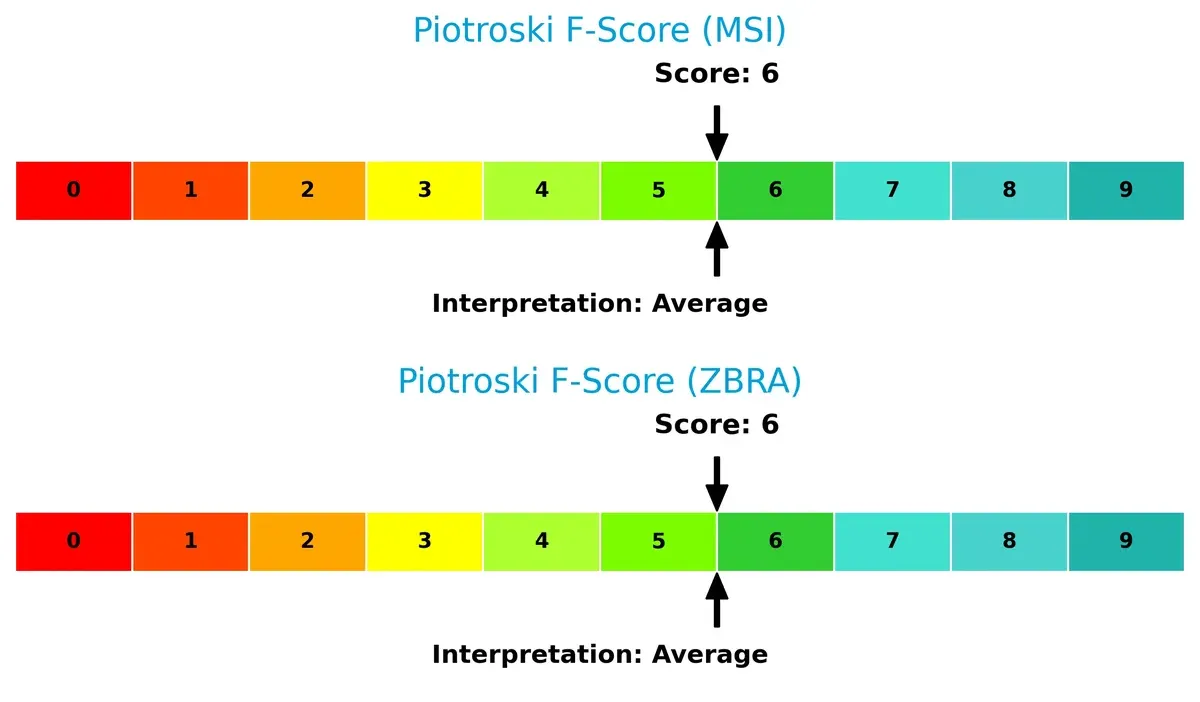
Financial Health: Quality of Operations
Both companies score a Piotroski F-Score of 6, reflecting average financial health with no glaring internal red flags. Neither firm demonstrates peak operational quality, signaling moderate risk for value-focused investors:
How are the two companies positioned?
This section dissects the operational DNA of MSI and ZBRA by comparing their revenue distribution and internal dynamics. The goal is to confront their economic moats to reveal which model offers the most resilient competitive advantage today.
Revenue Segmentation: The Strategic Mix
This visual comparison dissects how Motorola Solutions, Inc. and Zebra Technologies Corporation diversify income streams and where their primary sector bets lie:
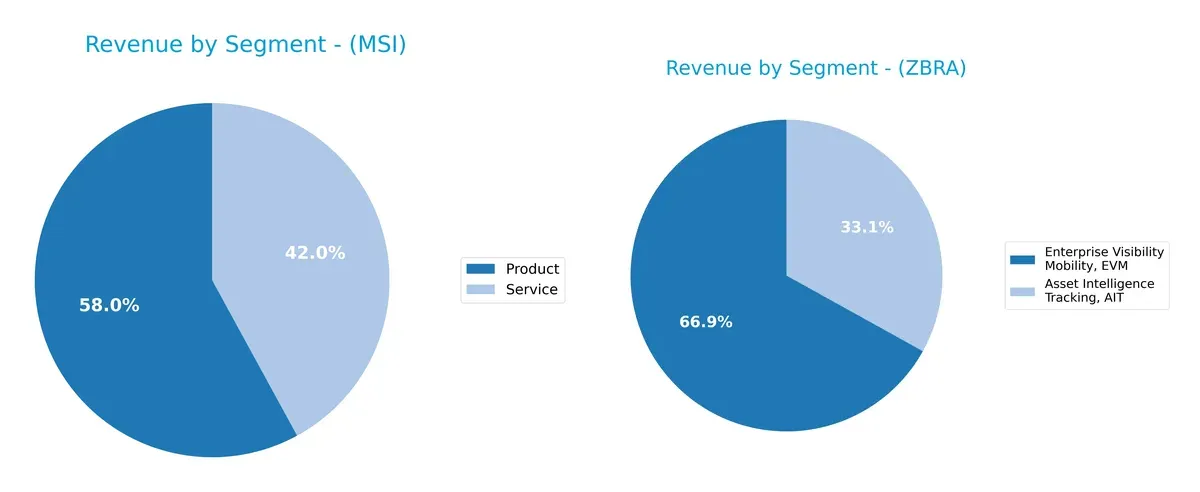
Motorola Solutions anchors revenue in two main segments: Products at $6.77B and Services at $4.91B, showing a balanced but concentrated mix. Zebra Technologies pivots on Enterprise Visibility Mobility ($3.33B) and Asset Intelligence Tracking ($1.65B), revealing a narrower segmentation. Motorola’s dual focus supports ecosystem lock-in, while Zebra’s concentration risks reliance on core mobility solutions amid evolving tech demands.
Strengths and Weaknesses Comparison
This table compares the Strengths and Weaknesses of Motorola Solutions, Inc. (MSI) and Zebra Technologies Corporation (ZBRA):
MSI Strengths
- Strong profitability with 18.44% net margin
- High ROE at 89.38% and ROIC at 16.11%
- Favorable interest coverage at 9.76
- Diverse revenue from products and services totaling over 11B USD
- Significant North America and international presence with 8.36B and 2.72B USD respectively
- Favorable fixed asset turnover at 6.69
ZBRA Strengths
- Favorable fixed asset turnover at 10.4
- Positive interest coverage at 7.41
- Diverse revenue streams with Asset Intelligence and Enterprise Visibility Mobility segments
- Global footprint including Asia Pacific, EMEA, and Americas with notable 2.69B USD North America revenue
- Moderate leverage with debt-to-assets at 33.12%
- Neutral net margin and ROIC, maintaining operational stability
MSI Weaknesses
- High debt-to-equity at 4.19 and debt-to-assets at 52.11% indicating leverage risk
- Overvalued valuation multiples with PE at 29.65 and PB at 26.5
- Neutral liquidity ratios with current ratio of 1.04 and quick ratio of 0.87
- Asset turnover moderate at 0.6, potentially limiting efficiency gains
ZBRA Weaknesses
- Unfavorable liquidity with current ratio at 0.97 and quick ratio at 0.58
- Higher WACC at 10.01% raising capital costs
- Zero dividend yield limits income appeal
- Lower profitability metrics with 7.77% net margin and 11.68% ROE
- Unfavorable valuation multiples despite lower PB at 3.44
MSI exhibits robust profitability and a broad revenue base but carries high leverage and stretched valuation metrics. ZBRA maintains operational steadiness with favorable asset efficiency but faces liquidity challenges and weaker profitability, reflecting distinct strategic trade-offs.
The Moat Duel: Analyzing Competitive Defensibility
A structural moat is the sole shield guarding long-term profits from relentless competitive erosion. Here’s how Motorola Solutions and Zebra Technologies compare:
Motorola Solutions, Inc.: Intangible Assets and Integrated Systems Moat
Motorola’s moat stems from mission-critical communications and integrated software services. It sustains high ROIC (8.4% above WACC) and margin stability. New software upgrades and expanded public safety contracts in 2026 could deepen this moat.
Zebra Technologies Corporation: Asset Intelligence and Specialized Hardware Moat
Zebra relies on specialized asset tracking and mobility solutions. Unlike Motorola, its ROIC trails WACC by over 1%, signaling value destruction. Its opportunity lies in expanding cloud robotics and real-time location systems amid market disruption.
Integrated Public Safety vs. Asset Tracking Innovation
Motorola’s wider moat combines hardware and software to create high barriers. Zebra’s niche tech faces profitability challenges and a shrinking ROIC. Motorola stands better equipped to defend and grow its market share in 2026.
Which stock offers better returns?
The past year shows contrasting price movements: Motorola Solutions, Inc. surged over 30%, while Zebra Technologies Corporation declined near 9%, reflecting divergent market sentiment and trading dynamics.
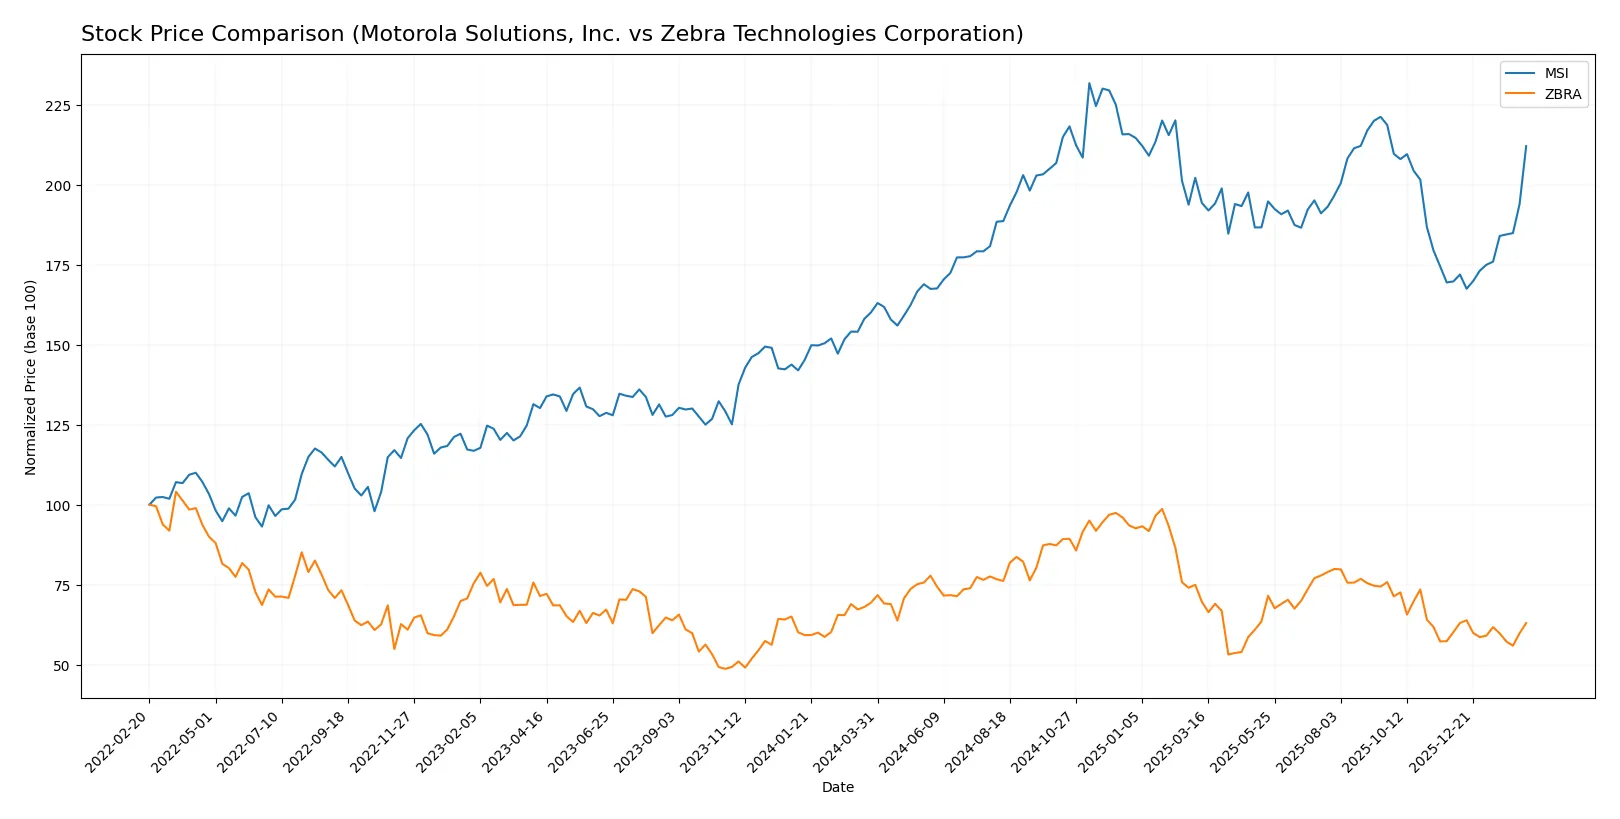
Trend Comparison
Motorola Solutions, Inc. recorded a bullish 32.48% price increase over 12 months, with accelerating momentum and a high volatility of 41.11. Its peak reached 504.6, bottomed at 339.65.
Zebra Technologies Corporation posted a bearish trend, declining 9.2% over the same period with decelerating momentum. Volatility stood higher at 48.34, trading between 223.49 and 414.61.
Motorola outperformed Zebra with a strong upward trend, delivering the highest market return and robust buyer dominance throughout the year.
Target Prices
Analysts present a constructive consensus on target prices for Motorola Solutions, Inc. and Zebra Technologies Corporation.
| Company | Target Low | Target High | Consensus |
|---|---|---|---|
| Motorola Solutions, Inc. | 450 | 525 | 490 |
| Zebra Technologies Corporation | 291 | 335 | 319.75 |
The consensus target prices for both companies sit above current market prices, signaling analyst optimism. Motorola Solutions trades near 462, with targets suggesting 6% to 14% upside potential. Zebra’s 265 current price implies a more pronounced 20% to 27% possible gain.

Don’t Let Luck Decide Your Entry Point
Optimize your entry points with our advanced ProRealTime indicators. You’ll get efficient buy signals with precise price targets for maximum performance. Start outperforming now!
How do institutions grade them?
The following tables summarize the latest institutional grades for Motorola Solutions, Inc. and Zebra Technologies Corporation:
Motorola Solutions, Inc. Grades
This table presents recent grade updates from reputable financial institutions for Motorola Solutions:
| Grading Company | Action | New Grade | Date |
|---|---|---|---|
| Barclays | Maintain | Overweight | 2026-02-12 |
| JP Morgan | Maintain | Overweight | 2026-02-12 |
| Piper Sandler | Maintain | Overweight | 2026-02-12 |
| Piper Sandler | Upgrade | Overweight | 2026-01-05 |
| Morgan Stanley | Upgrade | Overweight | 2025-12-17 |
| Barclays | Maintain | Overweight | 2025-10-31 |
| Piper Sandler | Maintain | Neutral | 2025-10-31 |
| Evercore ISI Group | Maintain | Outperform | 2025-08-29 |
| Barclays | Maintain | Overweight | 2025-08-08 |
| UBS | Maintain | Buy | 2025-08-08 |
Zebra Technologies Corporation Grades
This table shows current grades assigned by established grading firms for Zebra Technologies:
| Grading Company | Action | New Grade | Date |
|---|---|---|---|
| Needham | Maintain | Buy | 2026-02-13 |
| Citigroup | Maintain | Neutral | 2026-02-13 |
| Barclays | Maintain | Overweight | 2026-02-13 |
| Barclays | Maintain | Overweight | 2026-01-12 |
| Truist Securities | Maintain | Hold | 2025-12-18 |
| Truist Securities | Maintain | Hold | 2025-10-29 |
| Citigroup | Maintain | Neutral | 2025-10-29 |
| Barclays | Maintain | Overweight | 2025-10-29 |
| Citigroup | Maintain | Neutral | 2025-10-09 |
| Truist Securities | Maintain | Hold | 2025-10-08 |
Which company has the best grades?
Motorola Solutions has consistently received stronger grades, including multiple Overweight and Outperform ratings, compared to Zebra’s mix of Overweight, Buy, Neutral, and Hold. This suggests investors may view Motorola Solutions as having a more favorable outlook.
Risks specific to each company
The following categories identify critical pressure points and systemic threats facing both firms in the 2026 market environment:
1. Market & Competition
Motorola Solutions, Inc.
- Strong market position in mission-critical communications; faces competition from large tech firms expanding into public safety.
Zebra Technologies Corporation
- Operates in niche automatic identification and tracking; higher beta signals greater sensitivity to market swings and competitive pressures.
2. Capital Structure & Debt
Motorola Solutions, Inc.
- High debt-to-equity ratio (4.19) and debt-to-assets (52.11%) raise leverage concerns despite strong interest coverage.
Zebra Technologies Corporation
- Moderate leverage with debt-to-equity at 0.78 and debt-to-assets at 33.12%; better balance sheet stability.
3. Stock Volatility
Motorola Solutions, Inc.
- Beta near 1.0 indicates stock moves roughly with the market; lower volatility supports steady investor confidence.
Zebra Technologies Corporation
- Beta at 1.656 shows elevated volatility, increasing risk for investors sensitive to market fluctuations.
4. Regulatory & Legal
Motorola Solutions, Inc.
- Exposure to government contracts subjects MSI to stringent compliance and potential regulatory shifts.
Zebra Technologies Corporation
- Operates globally with complex supply chains, exposing it to diverse regulatory regimes and compliance risks.
5. Supply Chain & Operations
Motorola Solutions, Inc.
- Integrated systems approach may mitigate supply chain disruptions but depends on specialized component availability.
Zebra Technologies Corporation
- Relies heavily on manufacturing and distribution; supply chain interruptions could materially impact operations.
6. ESG & Climate Transition
Motorola Solutions, Inc.
- Increasing focus on cybersecurity and sustainability in public safety aligns with ESG trends but requires ongoing investment.
Zebra Technologies Corporation
- Faces pressure to improve ESG metrics amid manufacturing footprint and resource consumption.
7. Geopolitical Exposure
Motorola Solutions, Inc.
- Significant US and allied government exposure limits direct geopolitical risk but may face export restrictions.
Zebra Technologies Corporation
- Global footprint in retail, logistics, and healthcare makes it vulnerable to trade tensions and cross-border disruptions.
Which company shows a better risk-adjusted profile?
Motorola Solutions faces significant leverage risk, but its stable market position and lower stock volatility offer a more balanced profile. Zebra’s higher volatility and weaker liquidity ratios heighten risk, despite a cleaner debt structure. The critical risks are MSI’s debt burden and ZBRA’s operational volatility. MSI’s Altman Z-Score of 3.97 confirms solid financial health, while ZBRA’s 3.48 remains safe but less robust. This contrast justifies caution with Zebra amid current market turbulence.
Final Verdict: Which stock to choose?
Motorola Solutions, Inc. (MSI) stands out as a powerhouse of operational excellence and capital efficiency. Its robust return on invested capital well above cost signals consistent value creation. However, its elevated debt levels warrant caution. MSI suits investors targeting aggressive growth with an appetite for calculated risk.
Zebra Technologies Corporation (ZBRA) boasts a strategic moat rooted in specialized technology and recurring revenue streams. Its lower leverage and safer balance sheet provide a cushion against volatility compared to MSI. ZBRA fits investors seeking growth at a reasonable price with a preference for stability.
If you prioritize high operational efficiency and strong value creation, MSI is the compelling choice due to its superior returns and growth momentum. However, if you seek steadier financial footing with a technological niche, ZBRA offers better stability despite slower growth. Both require vigilance on their respective financial risks.
Disclaimer: Investment carries a risk of loss of initial capital. The past performance is not a reliable indicator of future results. Be sure to understand risks before making an investment decision.
Go Further
I encourage you to read the complete analyses of Motorola Solutions, Inc. and Zebra Technologies Corporation to enhance your investment decisions: