Home > Comparison > Technology > MSI vs NOK
The strategic rivalry between Motorola Solutions, Inc. and Nokia Oyj shapes the evolution of the communication equipment sector. Motorola Solutions operates as a mission-critical communications and analytics provider focused on government and public safety. Nokia Oyj runs a global network infrastructure and cloud services business, targeting telecom operators and digital industries. This analysis evaluates which company’s operational model presents a superior risk-adjusted opportunity for diversified portfolios amid sector transformation.
Table of contents
Companies Overview
Motorola Solutions and Nokia stand as pivotal players in the global communication equipment industry, shaping connectivity standards worldwide.
Motorola Solutions, Inc.: Mission-Critical Communications Leader
Motorola Solutions dominates the mission-critical communications market, generating revenue through its Products and Systems Integration and Software and Services segments. It offers infrastructure, devices, and video security solutions tailored for government, public safety, and commercial clients. In 2026, it focuses heavily on integrating advanced video analytics with secure communication to support mobile and fixed networks.
Nokia Oyj: Global Network Infrastructure Innovator
Nokia is a top-tier provider of mobile, fixed, and cloud network solutions, serving communications providers and enterprises worldwide. Its revenue stems from diverse segments including Mobile Networks, Cloud Services, and Nokia Technologies. Nokia’s 2026 strategy emphasizes 5G expansion, optical networks, and cloud virtualization to strengthen its end-to-end connectivity portfolio.
Strategic Collision: Similarities & Divergences
Both companies compete fiercely in communication infrastructure but diverge sharply in approach. Motorola Solutions prioritizes closed, secure ecosystems for critical communications, while Nokia pursues an open, scalable network architecture for broad 5G and cloud adoption. Their battleground lies in public safety versus global telecom infrastructure. Investors face distinct profiles: Motorola offers niche stability; Nokia delivers diversified growth potential.
Income Statement Comparison
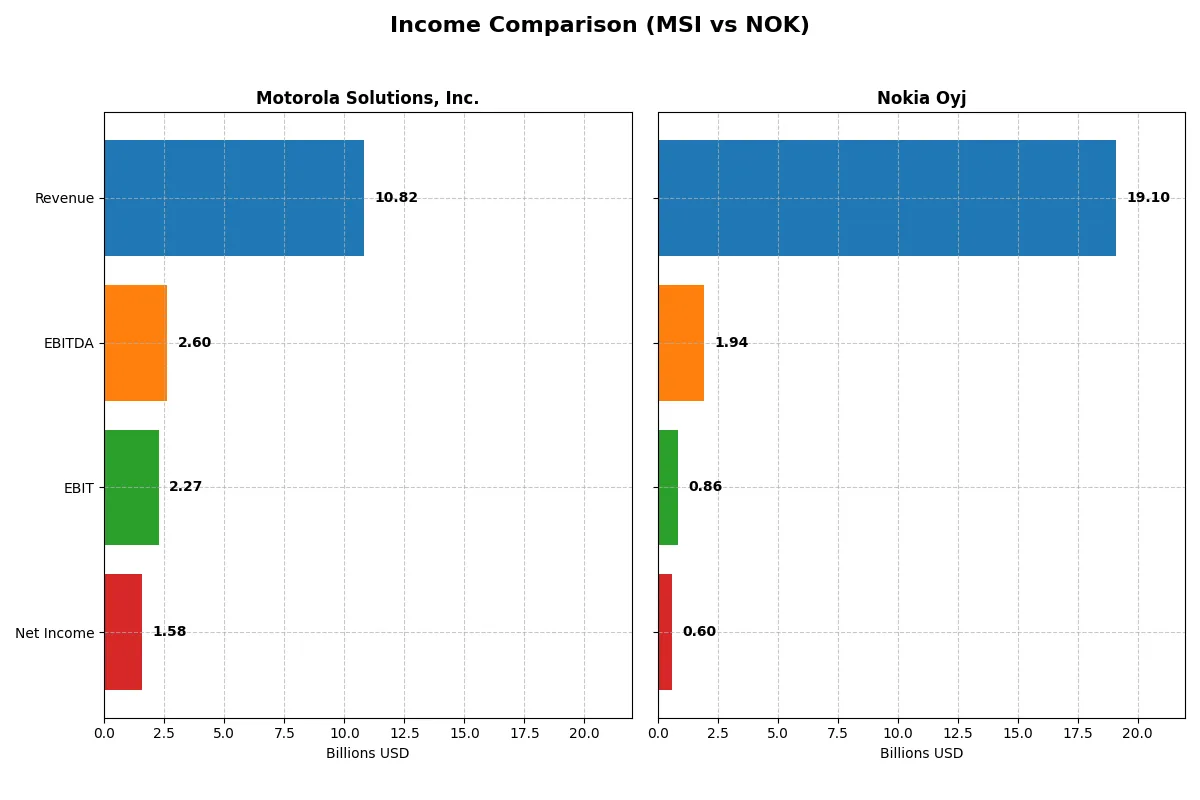
This data dissects the core profitability and scalability of both corporate engines to reveal who dominates the bottom line:
| Metric | Motorola Solutions, Inc. (MSI) | Nokia Oyj (NOK) |
|---|---|---|
| Revenue | 10.8B USD | 19.2B EUR |
| Cost of Revenue | 5.3B USD | 10.4B EUR |
| Operating Expenses | 2.8B USD | 6.9B EUR |
| Gross Profit | 5.5B USD | 8.9B EUR |
| EBITDA | 2.6B USD | 3.4B EUR |
| EBIT | 2.3B USD | 2.4B EUR |
| Interest Expense | 295M USD | 360M EUR (approx.) |
| Net Income | 1.6B USD | 1.3B EUR |
| EPS | 9.45 USD | 0.23 EUR |
| Fiscal Year | 2024 | 2024 |
Income Statement Analysis: The Bottom-Line Duel
This income statement comparison exposes each company’s operational efficiency and profitability over recent years.
Motorola Solutions, Inc. Analysis
Motorola Solutions grew revenue steadily from $7.4B in 2020 to $10.8B in 2024, with net income rising from $949M to $1.58B. Gross margin remains strong at 51%, while net margin holds favorably at 14.6%. Despite slight declines in EBIT and net margin in 2024, overall momentum reflects disciplined cost control and solid profitability.
Nokia Oyj Analysis
Nokia’s revenue declined from €24.9B in 2022 to €19.1B in 2025, with net income dropping sharply from €4.25B to €604M. Gross margin at 42% is decent but EBIT margin weakens to 4.5%, dragging net margin down to 3.2%. The latest year shows steep margin erosion and negative earnings growth, signaling operational and profitability challenges.
Margin Strength vs. Revenue Scale
Motorola Solutions outperforms Nokia with superior margin expansion and consistent revenue growth. Nokia’s shrinking top line and collapsing net income underline significant structural issues. Investors prioritizing stable profits and efficient capital allocation may find Motorola’s profile more compelling for portfolio resilience.
Financial Ratios Comparison
These vital ratios act as a diagnostic tool to expose the underlying fiscal health, valuation premiums, and capital efficiency of the companies compared below:
| Ratios | Motorola Solutions, Inc. (MSI) | Nokia Oyj (NOK) |
|---|---|---|
| ROE | 92.60% | 2.88% |
| ROIC | 21.59% | 3.82% |
| P/E | 48.9 | 18.3 |
| P/B | 45.27 | 1.13 |
| Current Ratio | 1.28 | 1.58 |
| Quick Ratio | 1.13 | 1.39 |
| D/E (Debt to Equity) | 3.85 | 0.23 |
| Debt-to-Assets | 44.9% | 12.1% |
| Interest Coverage | 9.11 | 5.55 |
| Asset Turnover | 0.74 | 0.49 |
| Fixed Asset Turnover | 6.97 | 9.07 |
| Payout ratio | 41.5% | 56.6% |
| Dividend yield | 0.85% | 3.09% |
| Fiscal Year | 2024 | 2024 |
Efficiency & Valuation Duel: The Vital Signs
Financial ratios act as the company’s DNA, exposing hidden risks and operational strengths that shape investor decisions.
Motorola Solutions, Inc.
Motorola boasts an outstanding 92.6% ROE and a strong 14.58% net margin, signaling exceptional profitability. However, its P/E of 48.9 and P/B of 45.3 mark the stock as expensive and stretched. Dividend yield remains low at 0.85%, highlighting a focus on reinvestment in R&D and growth initiatives.
Nokia Oyj
Nokia’s profitability is modest with a 2.88% ROE and 3.16% net margin, reflecting operational challenges. Its P/E stands high at 49.4, suggesting an expensive valuation despite a favorable P/B of 1.42. Nokia balances this with a 2.43% dividend yield and maintains low debt, supporting financial stability and shareholder returns.
Premium Valuation vs. Operational Safety
Motorola delivers superior returns but trades at a stretched premium, raising valuation risk. Nokia offers a safer financial profile with dividend income and lower leverage, yet lacks profitability strength. Investors prioritizing growth may favor Motorola; those seeking income and stability might prefer Nokia’s steady footprint.
Which one offers the Superior Shareholder Reward?
I compare Motorola Solutions, Inc. (MSI) and Nokia Oyj (NOK) on dividend yield, payout ratio, and buyback intensity to judge shareholder reward. MSI yields ~0.85% with a 41% payout ratio, backed by robust free cash flow (FCF) coverage (~89%). NOK offers a higher yield (~3.1%) but pays out over 110% of earnings, raising sustainability concerns. MSI’s buybacks are more disciplined, enhancing shareholder value sustainably. NOK’s payout exceeds FCF, risking dividend cuts. I conclude MSI provides superior total return potential through balanced dividends and buybacks, while NOK’s aggressive payout threatens long-term reward stability.
Comparative Score Analysis: The Strategic Profile
The radar chart reveals the fundamental DNA and trade-offs of Motorola Solutions, Inc. and Nokia Oyj, highlighting their financial strengths and weaknesses:
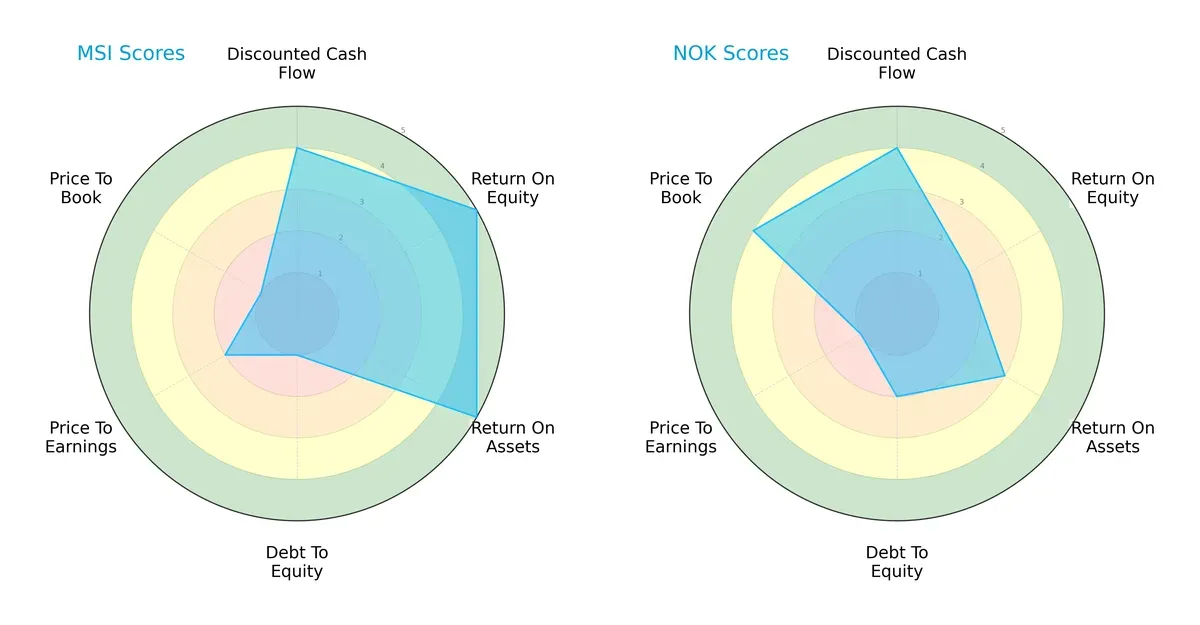
Motorola Solutions shows superior profitability with very favorable ROE and ROA scores (5 each) compared to Nokia’s moderate 2 and 3. Both share a favorable DCF score of 4, indicating similar valuation expectations. However, Motorola’s balance sheet shows risk with a very unfavorable debt-to-equity score of 1, while Nokia’s moderate 2 signals better financial stability. Valuation metrics also diverge: Motorola’s P/E and P/B scores are weak, suggesting overvaluation risks, whereas Nokia’s P/B score is favorable at 4. Overall, Motorola relies heavily on operational efficiency, while Nokia presents a more balanced, albeit less profitable, profile.
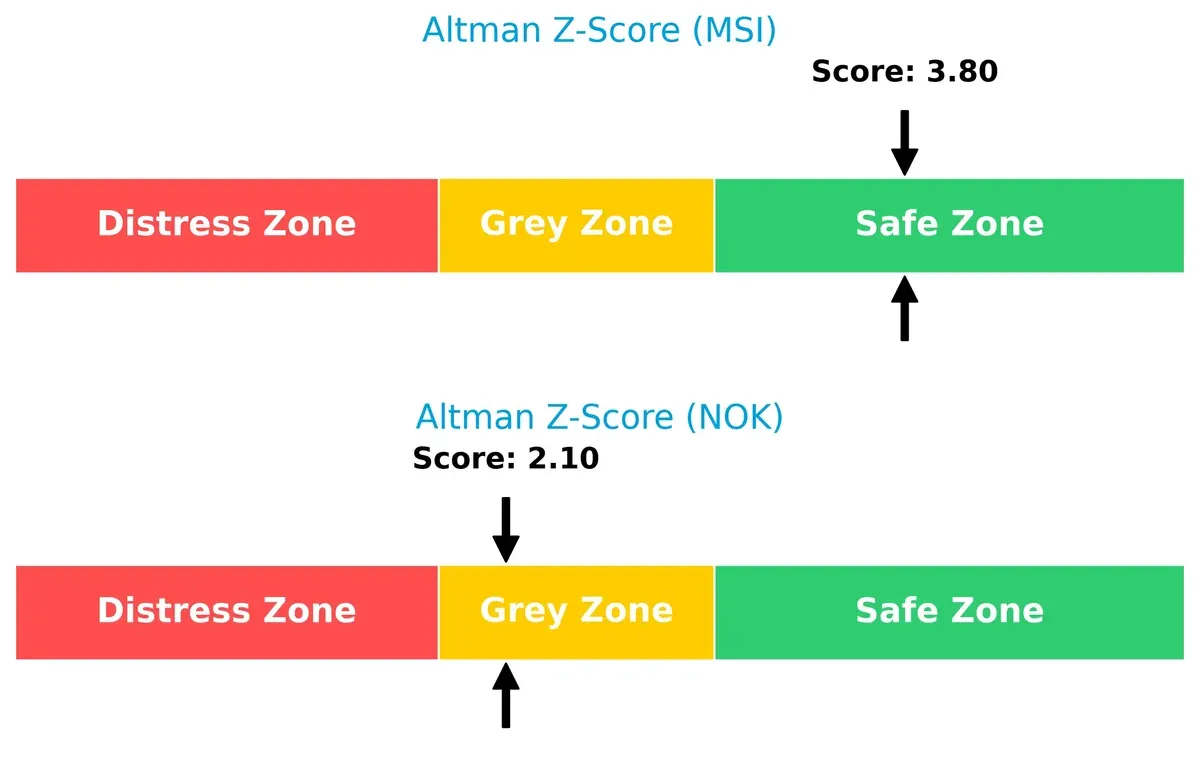
Bankruptcy Risk: Solvency Showdown
Motorola Solutions’ Altman Z-Score at 3.8 places it firmly in the safe zone, indicating low bankruptcy risk. Nokia’s 2.1 score lands in the grey zone, signaling moderate financial distress risk in this cycle:
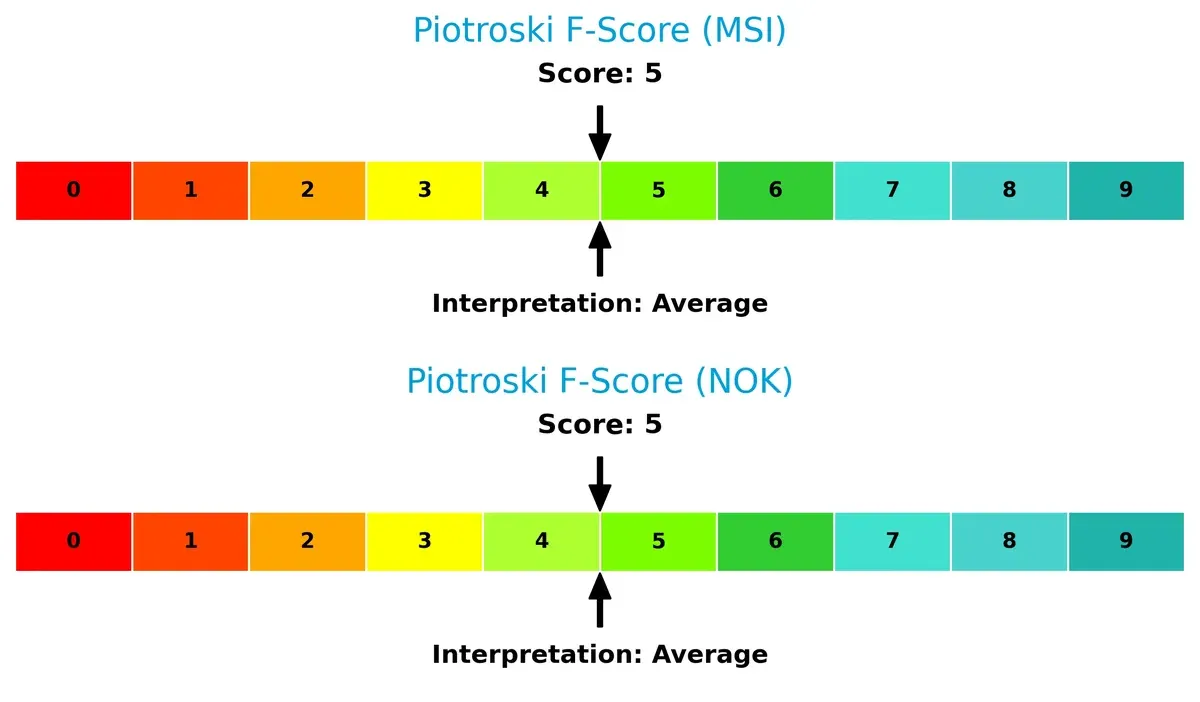
Financial Health: Quality of Operations
Both companies share an identical Piotroski F-Score of 5, reflecting average financial health. Neither firm currently signals critical red flags in internal metrics, but room for improvement remains:
How are the two companies positioned?
This section dissects the operational DNA of MSI and NOK by comparing their revenue distribution by segment and internal dynamics. The goal is to confront their economic moats and identify which model offers the most resilient competitive advantage today.
Revenue Segmentation: The Strategic Mix
This visual comparison dissects how Motorola Solutions, Inc. and Nokia Oyj diversify their income streams and where their primary sector bets lie:
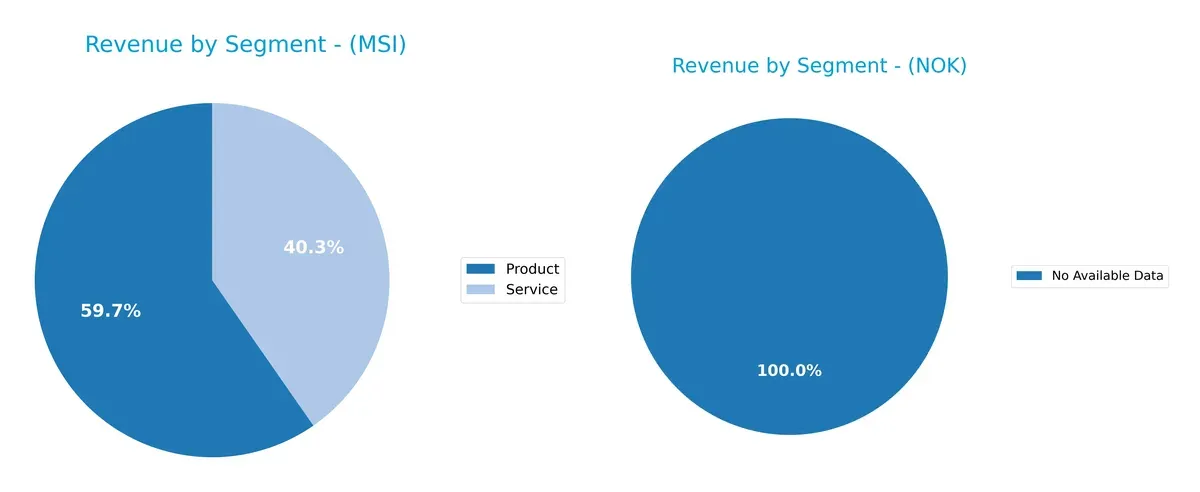
Motorola Solutions, Inc. pivots on a balanced mix between Product ($6.45B) and Service ($4.36B) in 2024, signaling steady diversification. Nokia Oyj lacks segment data for 2024, preventing direct comparison. Motorola’s dual-stream approach anchors stability and reduces concentration risk, contrasting firms relying on single dominant segments. This mix supports ecosystem lock-in by blending hardware sales with recurring service revenue, a strategic edge in communications infrastructure.
Strengths and Weaknesses Comparison
This table compares the Strengths and Weaknesses of Motorola Solutions, Inc. and Nokia Oyj:
Motorola Solutions, Inc. Strengths
- Strong profitability with 14.58% net margin and 92.6% ROE
- Favorable ROIC at 21.59% above WACC
- Balanced revenue from products (6.45B USD) and services (4.36B USD)
- Solid North American and international presence with 7.82B USD and 3B USD revenues
- Favorable liquidity and interest coverage ratios
Nokia Oyj Strengths
- Favorable capital structure with low debt-to-equity (0.25) and debt-to-assets (13.86%)
- Strong global diversification across Europe, Asia Pacific, and Americas
- Favorable liquidity ratios with current ratio at 1.58 and quick ratio 1.36
- Higher dividend yield at 2.43% supports income investors
- Favorable PB ratio at 1.42 indicates undervaluation
Motorola Solutions, Inc. Weaknesses
- High leverage with debt-to-equity at 3.85 raises financial risk
- Elevated valuation multiples: PE at 48.89 and PB at 45.27
- Dividend yield low at 0.85%
- Moderate international revenue concentration limits global diversification
Nokia Oyj Weaknesses
- Low profitability with net margin at 3.16% and ROE at 2.88% below cost of capital
- ROIC at 3.82% barely exceeds WACC of 5.92%
- PE ratio high at 49.36 indicating expensive valuation
- Lower asset turnover at 0.51 limits operational efficiency
Motorola Solutions excels in profitability and balanced revenue streams but carries high financial leverage and valuation risks. Nokia shows financial prudence and global diversification but struggles with profitability and operational efficiency. Each company’s strengths and weaknesses highlight distinct strategic challenges and opportunities.
The Moat Duel: Analyzing Competitive Defensibility
A structural moat is the only reliable barrier protecting long-term profits from relentless competitive erosion. Let’s dissect how these two firms defend their turf:
Motorola Solutions, Inc.: Fortress Built on Switching Costs
Motorola’s moat lies in its high switching costs embedded in mission-critical communication systems. This drives stable margins and a very favorable ROIC that’s grown 45% over five years. Expansion into software and analytics deepens this moat in 2026.
Nokia Oyj: Struggling Cost Advantage in Transition
Nokia relies on scale and cost advantages but faces declining profitability and a shrinking ROIC. Unlike Motorola, it lacks durable switching costs. The company’s turnaround efforts in 5G and cloud may stall or disrupt its weakening moat.
Switching Costs vs. Scale Efficiency: The Battle for Sustainable Profits
Motorola’s growing switching-cost moat far outpaces Nokia’s eroding scale advantage. Motorola is better positioned to defend and expand market share amid intensifying competition. Nokia risks profit margin compression without strategic breakthroughs.
Which stock offers better returns?
The past year shows clear bullish momentum for both stocks, with Nokia Oyj surging sharply and Motorola Solutions, Inc. gaining steadily amid rising trading volumes.
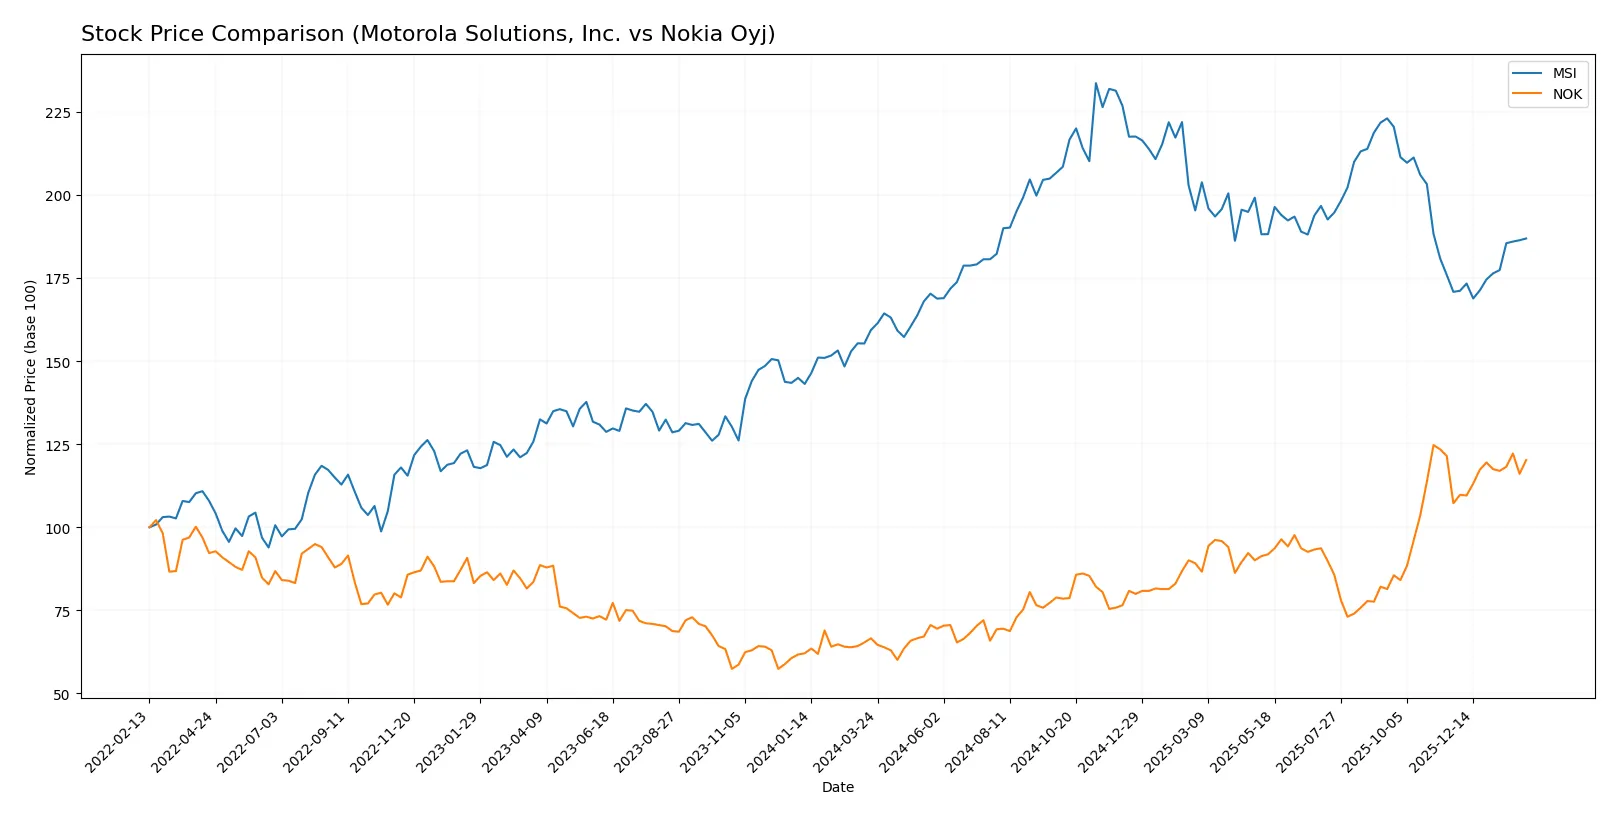
Trend Comparison
Motorola Solutions, Inc. displays a 17.28% price increase over 12 months, signaling a bullish trend with accelerating momentum and notable volatility (std dev 41.66). The stock’s price ranged from 339.65 to 504.6.
Nokia Oyj outperformed with an 80.49% price rise over the same period, also bullish and accelerating, but with minimal volatility (std dev 0.91). Its price moved between 3.33 and 6.91.
Nokia’s substantial price gain eclipses Motorola’s steady growth, delivering the highest market performance over the past year.
Target Prices
Analysts project solid upside potential for Motorola Solutions, Inc. and a moderate rebound for Nokia Oyj.
| Company | Target Low | Target High | Consensus |
|---|---|---|---|
| Motorola Solutions, Inc. | 436 | 525 | 469.8 |
| Nokia Oyj | 5 | 8.5 | 6.69 |
Motorola Solutions’ target consensus at 470 suggests a 16% premium versus its current 404 price. Nokia’s consensus near 6.7 signals slight upside from its 6.66 market price.

Don’t Let Luck Decide Your Entry Point
Optimize your entry points with our advanced ProRealTime indicators. You’ll get efficient buy signals with precise price targets for maximum performance. Start outperforming now!
How do institutions grade them?
The following tables summarize recent institutional grades for Motorola Solutions, Inc. and Nokia Oyj:
Motorola Solutions, Inc. Grades
This table shows recent grade updates and actions by reputable firms for Motorola Solutions, Inc.
| Grading Company | Action | New Grade | Date |
|---|---|---|---|
| Piper Sandler | Upgrade | Overweight | 2026-01-05 |
| Morgan Stanley | Upgrade | Overweight | 2025-12-17 |
| Piper Sandler | Maintain | Neutral | 2025-10-31 |
| Barclays | Maintain | Overweight | 2025-10-31 |
| Evercore ISI Group | Maintain | Outperform | 2025-08-29 |
| UBS | Maintain | Buy | 2025-08-08 |
| Barclays | Maintain | Overweight | 2025-08-08 |
| Barclays | Maintain | Overweight | 2025-05-05 |
| JP Morgan | Maintain | Overweight | 2025-04-17 |
| Morgan Stanley | Maintain | Equal Weight | 2025-02-14 |
Nokia Oyj Grades
This table presents recent grade actions by established institutions for Nokia Oyj.
| Grading Company | Action | New Grade | Date |
|---|---|---|---|
| JP Morgan | Maintain | Overweight | 2025-12-01 |
| Jefferies | Upgrade | Buy | 2025-10-28 |
| JP Morgan | Maintain | Overweight | 2025-10-24 |
| JP Morgan | Maintain | Overweight | 2025-07-29 |
| JP Morgan | Maintain | Overweight | 2025-02-21 |
| Craig-Hallum | Maintain | Buy | 2025-01-06 |
| JP Morgan | Upgrade | Overweight | 2024-12-09 |
| JP Morgan | Maintain | Neutral | 2024-10-21 |
| Northland Capital Markets | Maintain | Outperform | 2024-10-18 |
| Northland Capital Markets | Maintain | Outperform | 2024-09-04 |
Which company has the best grades?
Motorola Solutions, Inc. and Nokia Oyj have similarly strong institutional support, with multiple “Overweight” and “Buy” grades. Motorola’s recent upgrades to “Overweight” and consistent “Outperform” and “Buy” ratings indicate solid confidence. Nokia also shows robust backing, particularly from JP Morgan and Northland Capital Markets. Investors might see both as favored picks, but Motorola’s slightly newer upgrades suggest a more recent positive momentum.
Risks specific to each company
The following categories identify the critical pressure points and systemic threats facing both firms in the 2026 market environment:
1. Market & Competition
Motorola Solutions, Inc.
- Strong market presence in mission-critical communications but faces pricing pressure and evolving tech demands.
Nokia Oyj
- Diverse telecom portfolio but struggles with low profit margins and aggressive competition in 5G and cloud sectors.
2. Capital Structure & Debt
Motorola Solutions, Inc.
- High debt-to-equity ratio (3.85) signals financial leverage risks and potential cost of capital issues.
Nokia Oyj
- Low leverage (0.25 debt-to-equity) indicates conservative capital structure and lower financial risk.
3. Stock Volatility
Motorola Solutions, Inc.
- Beta around 1.0 suggests stock moves roughly in line with the market, moderate volatility.
Nokia Oyj
- Beta at 0.56 shows lower sensitivity to market swings, reducing volatility risk.
4. Regulatory & Legal
Motorola Solutions, Inc.
- Operates heavily in government/public safety sectors, exposing it to regulatory compliance risks.
Nokia Oyj
- Global telecom operations face diverse regulatory environments, increasing legal complexity and compliance costs.
5. Supply Chain & Operations
Motorola Solutions, Inc.
- Focused on hardware and software integration; supply chain disruptions could delay critical product delivery.
Nokia Oyj
- Complex global supply chains for network hardware and software heighten risk of operational bottlenecks.
6. ESG & Climate Transition
Motorola Solutions, Inc.
- Moderate ESG focus; increasing scrutiny on sustainability in technology and government contracts.
Nokia Oyj
- Stronger ESG initiatives needed as telecom infrastructure faces pressure to reduce carbon footprint.
7. Geopolitical Exposure
Motorola Solutions, Inc.
- Primarily US and allied markets, somewhat insulated but sensitive to defense and public safety budgets.
Nokia Oyj
- Extensive global footprint exposes Nokia to geopolitical tensions, trade restrictions, and currency risks.
Which company shows a better risk-adjusted profile?
Motorola Solutions’ greatest risk is its elevated debt load, which increases financial vulnerability despite strong profitability. Nokia’s biggest challenge lies in weak profitability amid fierce global competition and geopolitical complexity. Nokia’s lower leverage and volatility provide a more balanced risk profile. Recent data highlight Motorola’s high debt-to-equity (3.85) as a red flag, while Nokia’s modest beta (0.56) supports its relative stability. Overall, Nokia offers a better risk-adjusted profile given its conservative capital structure and lower market sensitivity.
Final Verdict: Which stock to choose?
Motorola Solutions, Inc. (MSI) stands out as a cash-generating powerhouse with a durable competitive advantage. Its ability to deliver rising returns on invested capital signals a strong moat. However, investors should watch its elevated debt levels as a cautionary note. MSI suits portfolios aiming for aggressive growth with a quality edge.
Nokia Oyj (NOK) offers a strategic moat through its solid balance sheet and low leverage, providing a safety cushion absent in MSI. Its recurring revenue streams and stable cash flow underpin a more conservative profile. NOK fits investors looking for growth at a reasonable price with a focus on capital preservation.
If you prioritize durable profitability and high return on capital, MSI is the compelling choice due to its proven value creation and accelerating momentum. However, if you seek steadier financial stability and lower risk exposure, NOK offers better stability with a defensive growth profile. Each stock aligns with distinct investor strategies, demanding careful alignment with your risk tolerance and return expectations.
Disclaimer: Investment carries a risk of loss of initial capital. The past performance is not a reliable indicator of future results. Be sure to understand risks before making an investment decision.
Go Further
I encourage you to read the complete analyses of Motorola Solutions, Inc. and Nokia Oyj to enhance your investment decisions: