Home > Comparison > Financial Services > MS vs GS
The strategic rivalry between Morgan Stanley and The Goldman Sachs Group defines the trajectory of the financial services capital markets sector. Morgan Stanley operates as a diversified financial holding company with strong wealth management and investment management arms. Goldman Sachs emphasizes investment banking and global markets with a robust asset management division. This analysis explores which firm’s operational model delivers superior risk-adjusted returns, guiding investors seeking durable leadership in this competitive landscape.
Table of contents
Companies Overview
Morgan Stanley and The Goldman Sachs Group shape the global financial landscape with distinct strengths and strategies.
Morgan Stanley: Global Financial Powerhouse
Morgan Stanley dominates financial services with diverse revenue streams from Institutional Securities, Wealth Management, and Investment Management. Its core business centers on capital raising, advisory, trading, and wealth planning. In 2026, the firm focuses on expanding wealth management and investment solutions, aiming to balance steady fee income with market-driven trading profits.
The Goldman Sachs Group, Inc.: Premier Investment Bank
Goldman Sachs excels in investment banking and global markets, generating revenue through advisory, underwriting, asset management, and consumer wealth services. In 2026, the company emphasizes broadening its asset management and consumer banking footprint, seeking growth beyond traditional investment banking while maintaining strength in underwriting and trading.
Strategic Collision: Similarities & Divergences
Both firms maintain multi-segment models but diverge in execution; Morgan Stanley emphasizes wealth management, while Goldman Sachs prioritizes investment banking and consumer expansion. Their battleground lies in capturing corporate advisory and asset management mandates worldwide. Investors face contrasting profiles: Morgan Stanley offers diversified fee stability, whereas Goldman Sachs bets on growth from broader financial services innovation.
Income Statement Comparison
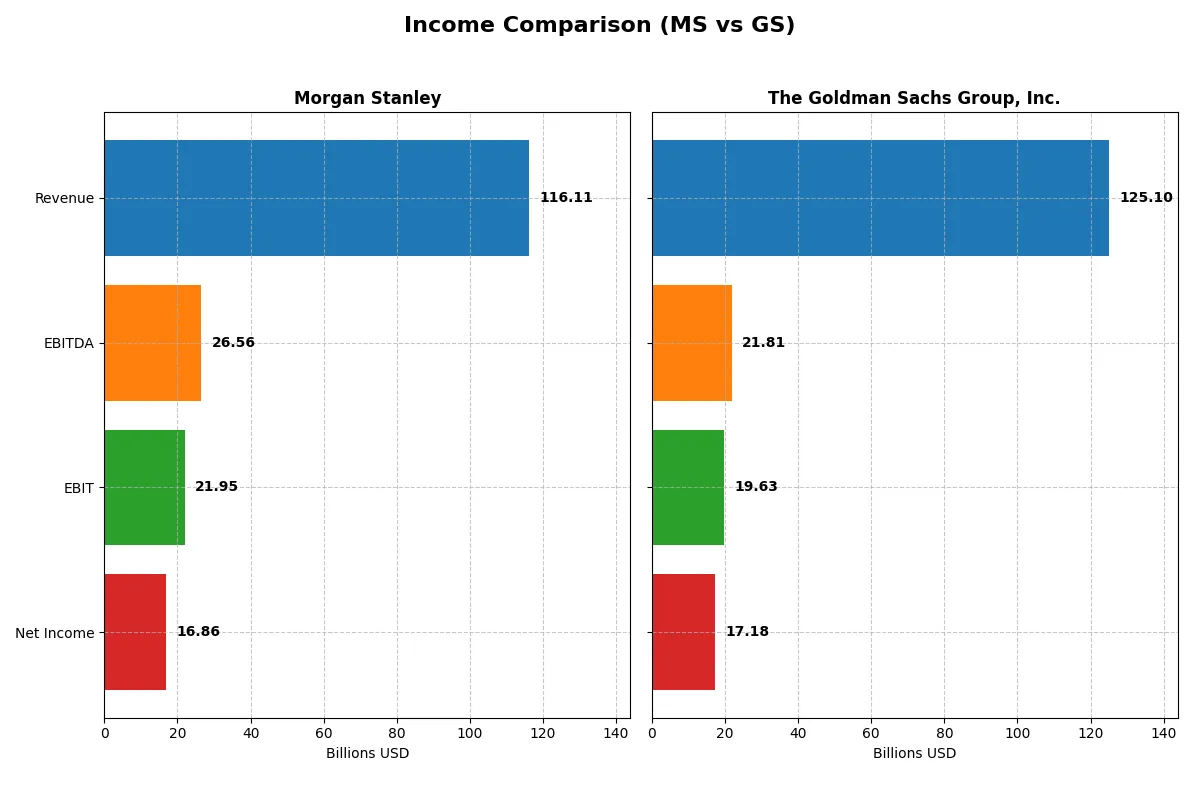
This data dissects the core profitability and scalability of both corporate engines to reveal who dominates the bottom line:
| Metric | Morgan Stanley (MS) | The Goldman Sachs Group, Inc. (GS) |
|---|---|---|
| Revenue | 116.1B | 125.1B |
| Cost of Revenue | 49.4B | 67.9B |
| Operating Expenses | 44.8B | 37.5B |
| Gross Profit | 66.7B | 57.2B |
| EBITDA | 26.6B | 21.8B |
| EBIT | 21.9B | 19.6B |
| Interest Expense | 49.0B | 66.8B |
| Net Income | 16.9B | 17.2B |
| EPS | 10.34 | 51.95 |
| Fiscal Year | 2025 | 2025 |
Income Statement Analysis: The Bottom-Line Duel
This income statement comparison unveils which firm manages revenue and profits with greater operational efficiency and margin strength.
Morgan Stanley Analysis
Morgan Stanley’s revenue nearly doubled from 2021 to 2025, reaching $116B, with net income rising steadily to $16.2B. The firm sustains strong gross margins around 57%, and net margins improved to 14.5% in 2025. Its operating income surged 25% year-over-year, reflecting robust momentum and effective cost control despite rising expenses.
The Goldman Sachs Group, Inc. Analysis
Goldman Sachs posted higher revenue than Morgan Stanley in 2025 at $125B but experienced a slight decline from the prior year. Gross margin at 45.7% trails Morgan Stanley’s, while net margin stands at 13.7%. Despite revenue softness, net income rose to $16.3B, driven by improved EBIT margins and controlled operating expenses, signaling resilience amid pressure.
Margin Strength vs. Revenue Scale
Morgan Stanley demonstrates superior margin expansion and consistent revenue growth, outperforming Goldman Sachs’s slower topline and margin compression. While Goldman Sachs generates more revenue, Morgan Stanley’s stronger profitability and margin trajectory position it as the more efficient operator. Investors favor firms that grow earnings with expanding margins, making Morgan Stanley’s profile more attractive.
Financial Ratios Comparison
These vital ratios act as a diagnostic tool to expose the underlying fiscal health, valuation premiums, and capital efficiency of the companies compared below:
| Ratios | Morgan Stanley (MS) | The Goldman Sachs Group, Inc. (GS) |
|---|---|---|
| ROE | 12.8% (2024) | 13.7% (2025) |
| ROIC | 2.5% (2024) | 1.0% (2025) |
| P/E | 14.9 (2024) | 16.0 (2025) |
| P/B | 1.91 (2024) | 2.20 (2025) |
| Current Ratio | 0.66 (2024) | 1.21 (2025) |
| Quick Ratio | 0.66 (2024) | 1.21 (2025) |
| D/E (Debt-to-Equity) | 3.45 (2024) | 4.95 (2025) |
| Debt-to-Assets | 29.7% (2024) | 34.2% (2025) |
| Interest Coverage | 0.39 (2024) | 0.29 (2025) |
| Asset Turnover | 0.085 (2024) | 0.069 (2025) |
| Fixed Asset Turnover | 4,485 (2024) | 3.47 (2025) |
| Payout ratio | 45.8% (2024) | 25.5% (2025) |
| Dividend yield | 3.07% (2024) | 1.59% (2025) |
| Fiscal Year | 2024 | 2025 |
Efficiency & Valuation Duel: The Vital Signs
Ratios act as a company’s DNA, unveiling hidden risks and operational excellence crucial to understanding investment potential.
Morgan Stanley
Morgan Stanley shows a favorable net margin of 14.52% but an unfavorable ROE and ROIC, indicating profit generation challenges despite efficiency. Its P/E of 16.54 suggests a neutral valuation, while a 2.17% dividend yield rewards shareholders, balancing reinvestment with steady income.
The Goldman Sachs Group, Inc.
Goldman Sachs posts a slightly lower net margin of 13.73%, with a neutral ROE of 13.74%, signaling moderate profitability. Its P/E of 16.0 aligns with fair valuation. The company maintains a 1.59% dividend yield and shows a strong quick ratio, reflecting liquidity and operational stability.
Balanced Profitability Meets Valuation Discipline
Morgan Stanley offers higher margins and dividends but struggles with returns on equity and capital. Goldman Sachs balances profitability with better liquidity but has a lower dividend yield. Investors prioritizing income and margin may prefer Morgan Stanley; those valuing liquidity and moderate returns might lean toward Goldman Sachs.
Which one offers the Superior Shareholder Reward?
Morgan Stanley (MS) delivers a more balanced shareholder reward than The Goldman Sachs Group, Inc. (GS). MS offers a higher dividend yield near 3.07% in 2025 with a payout ratio around 46%, signaling solid free cash flow coverage. GS yields 1.59% with a 25% payout, prioritizing conservative dividends. MS also maintains steady buybacks, enhancing total returns, while GS’s buyback data is less explicit but implied through strong capital allocation and reinvestment in its asset base. MS’s model blends income and buybacks sustainably, offering superior total return potential in 2026.
Comparative Score Analysis: The Strategic Profile
The radar chart reveals the core financial DNA and trade-offs that define Morgan Stanley and The Goldman Sachs Group, Inc.:
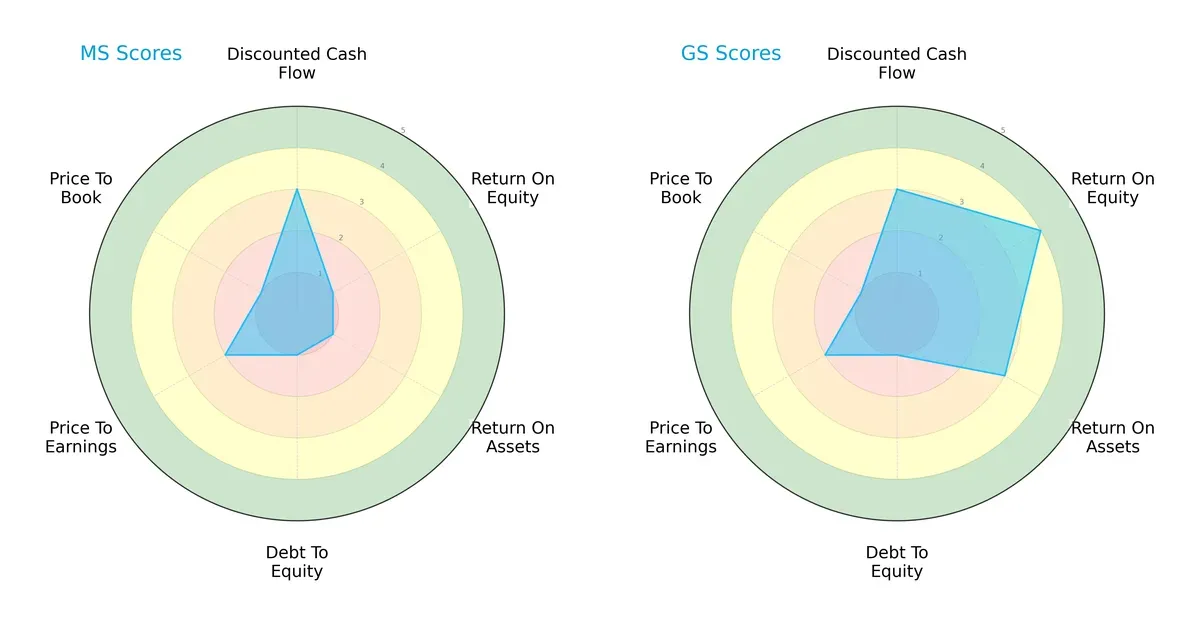
Goldman Sachs shows clear strength in profitability, with a favorable ROE (4) and solid ROA (3), while Morgan Stanley struggles with very unfavorable returns (ROE 1, ROA 1). Both firms share weak debt management (Debt/Equity score 1) and valuation metrics (PE 2, PB 1). Goldman Sachs presents a more balanced and robust profile, leveraging operational efficiency rather than relying on a single financial edge.
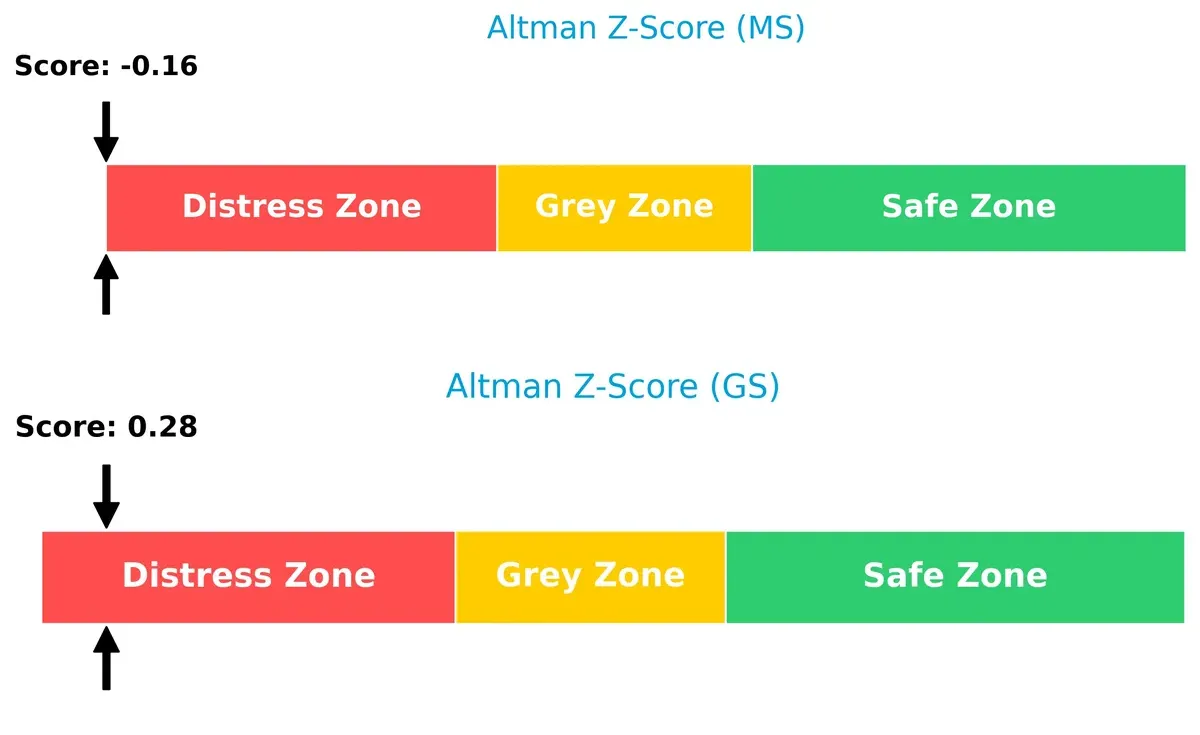
Bankruptcy Risk: Solvency Showdown
Morgan Stanley and Goldman Sachs both reside in the distress zone by Altman Z-Score, but Goldman Sachs holds a modestly higher score, suggesting a slightly better solvency outlook in this challenging cycle:
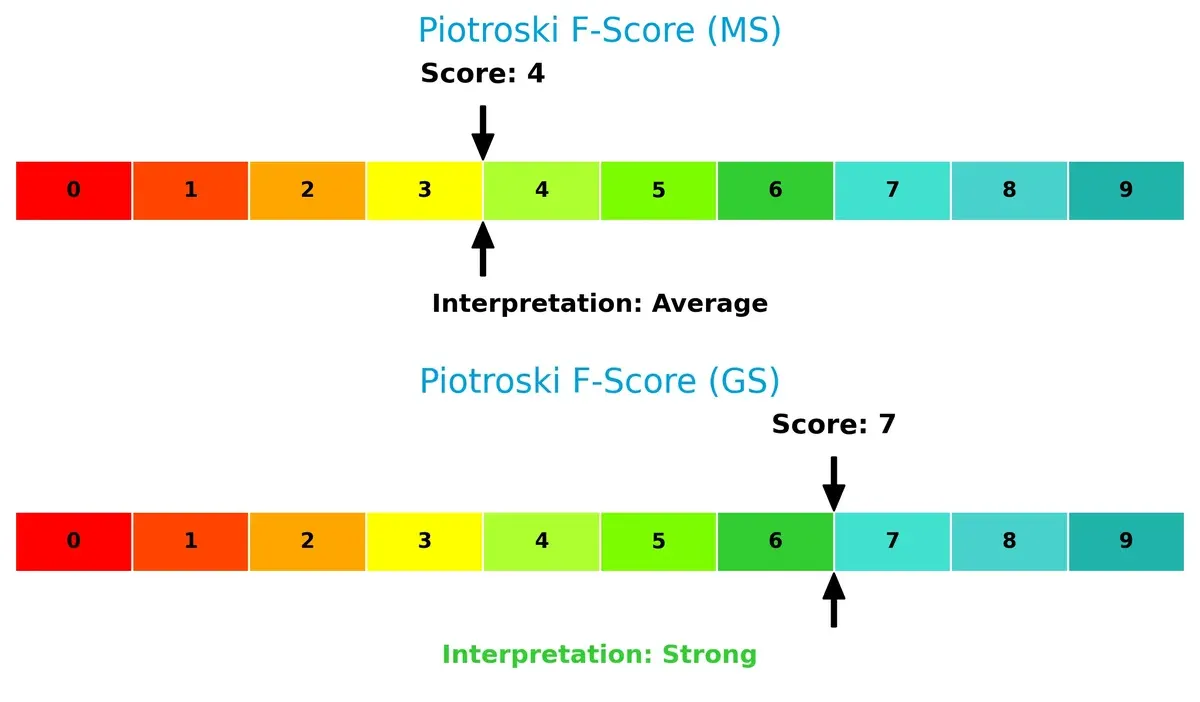
Financial Health: Quality of Operations
Goldman Sachs exhibits a strong Piotroski F-Score of 7, reflecting solid internal financial metrics and operational quality. Morgan Stanley’s average score of 4 signals caution, revealing potential red flags in profitability or liquidity compared to its peer:
How are the two companies positioned?
This section dissects Morgan Stanley’s and Goldman Sachs’ operational DNA by comparing their revenue distribution and internal strengths and weaknesses. The goal is to confront their economic moats and identify which model offers the most resilient, sustainable competitive advantage today.
Revenue Segmentation: The Strategic Mix
The following visual comparison dissects how Morgan Stanley and Goldman Sachs diversify their income streams and where their primary sector bets lie:
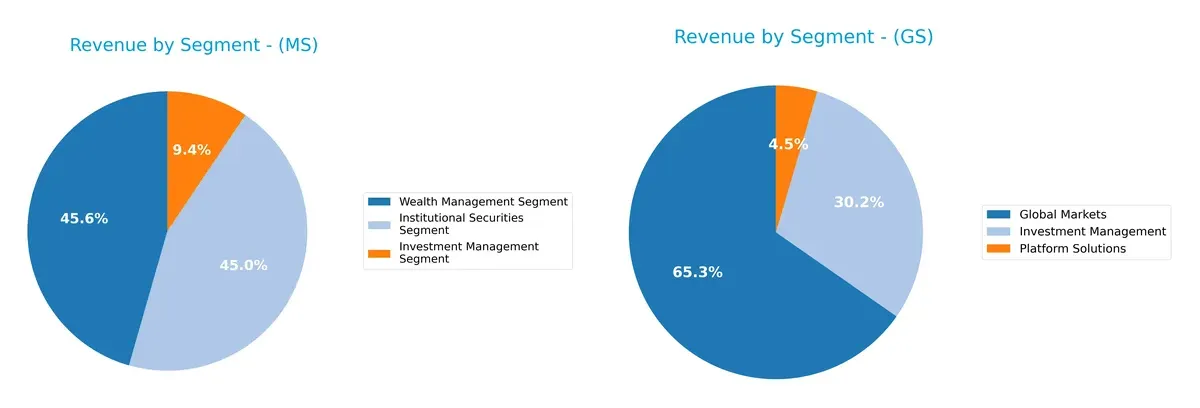
Morgan Stanley balances revenue between Institutional Securities ($28.1B) and Wealth Management ($28.4B), with a smaller Investment Management slice ($5.9B). Goldman Sachs pivots on Global Markets ($34.9B), dwarfs other segments, while Investment Management ($16.1B) and Platform Solutions ($2.4B) trail. Morgan Stanley’s dual focus reduces concentration risk. Goldman Sachs leans heavily on market activities, exposing it to higher volatility but capitalizing on ecosystem dominance.
Strengths and Weaknesses Comparison
This table compares the strengths and weaknesses of Morgan Stanley and The Goldman Sachs Group, Inc.:
Morgan Stanley Strengths
- Diversified revenue across Institutional Securities, Wealth and Investment Management
- Favorable net margin at 14.52%
- Low debt to assets ratio, indicating strong solvency
- Higher dividend yield at 2.17%
- Significant revenue presence in Americas, Asia, and EMEA regions
The Goldman Sachs Group, Inc. Strengths
- Strong revenue from Global Markets and Investment Management segments
- Favorable net margin at 13.73%
- Favorable quick ratio and fixed asset turnover
- Neutral ROE and WACC suggest balanced profitability and cost of capital
- Broad global footprint with strong EMEA revenue presence
Morgan Stanley Weaknesses
- Unfavorable zero ROE and ROIC, indicating poor capital efficiency
- Weak liquidity ratios: current and quick ratios at 0
- Low interest coverage at 0.45 raises solvency concerns
- Unfavorable asset and fixed asset turnover ratios
- Neutral P/E and zero PB may indicate market uncertainty
The Goldman Sachs Group, Inc. Weaknesses
- Elevated debt-to-equity ratio at 4.95 signals higher leverage risk
- Unfavorable interest coverage at 0.29, risking debt servicing
- Unfavorable asset turnover at 0.07 impacts operational efficiency
- Neutral dividend yield at 1.59% may limit income appeal
- Neutral current ratio at 1.21 suggests moderate liquidity
Both companies show strong market diversification and global presence, with Morgan Stanley excelling in capital structure prudence and dividend yield. Goldman Sachs displays operational strengths in asset utilization and liquidity but faces risks from higher leverage and weaker interest coverage. These factors shape each firm’s strategic focus on balancing growth with financial stability.
The Moat Duel: Analyzing Competitive Defensibility
A structural moat is the only shield that protects long-term profits from relentless competitive erosion in financial services:
Morgan Stanley: Diversified Client Relationships and Wealth Management Strength
Morgan Stanley’s moat stems from deep client trust and wealth management scale, reflected in stable 18.9% EBIT margins and 12.6% revenue growth in 2025. Expansion into Asia and EMEA broadens its moat, though rising interest expenses pose margin pressure risks.
The Goldman Sachs Group, Inc.: Investment Banking and Global Markets Dominance
Goldman Sachs relies on its elite investment banking and global markets reach, but weaker 15.7% EBIT margins and a shrinking ROIC signal a deteriorating moat. Its concentrated EMEA exposure offers growth potential but also heightened geopolitical risks.
Moat Battle: Diversification and Scale vs. Concentration and Market Reach
Morgan Stanley’s wider geographical diversification and consistent margin expansion give it a structurally deeper moat than Goldman Sachs, whose declining ROIC signals value destruction. Morgan Stanley stands better positioned to defend market share amid competitive and macroeconomic pressures.
Which stock offers better returns?
The past year shows strong upward momentum for both Morgan Stanley and The Goldman Sachs Group, with notable price gains and distinct trading volume dynamics.
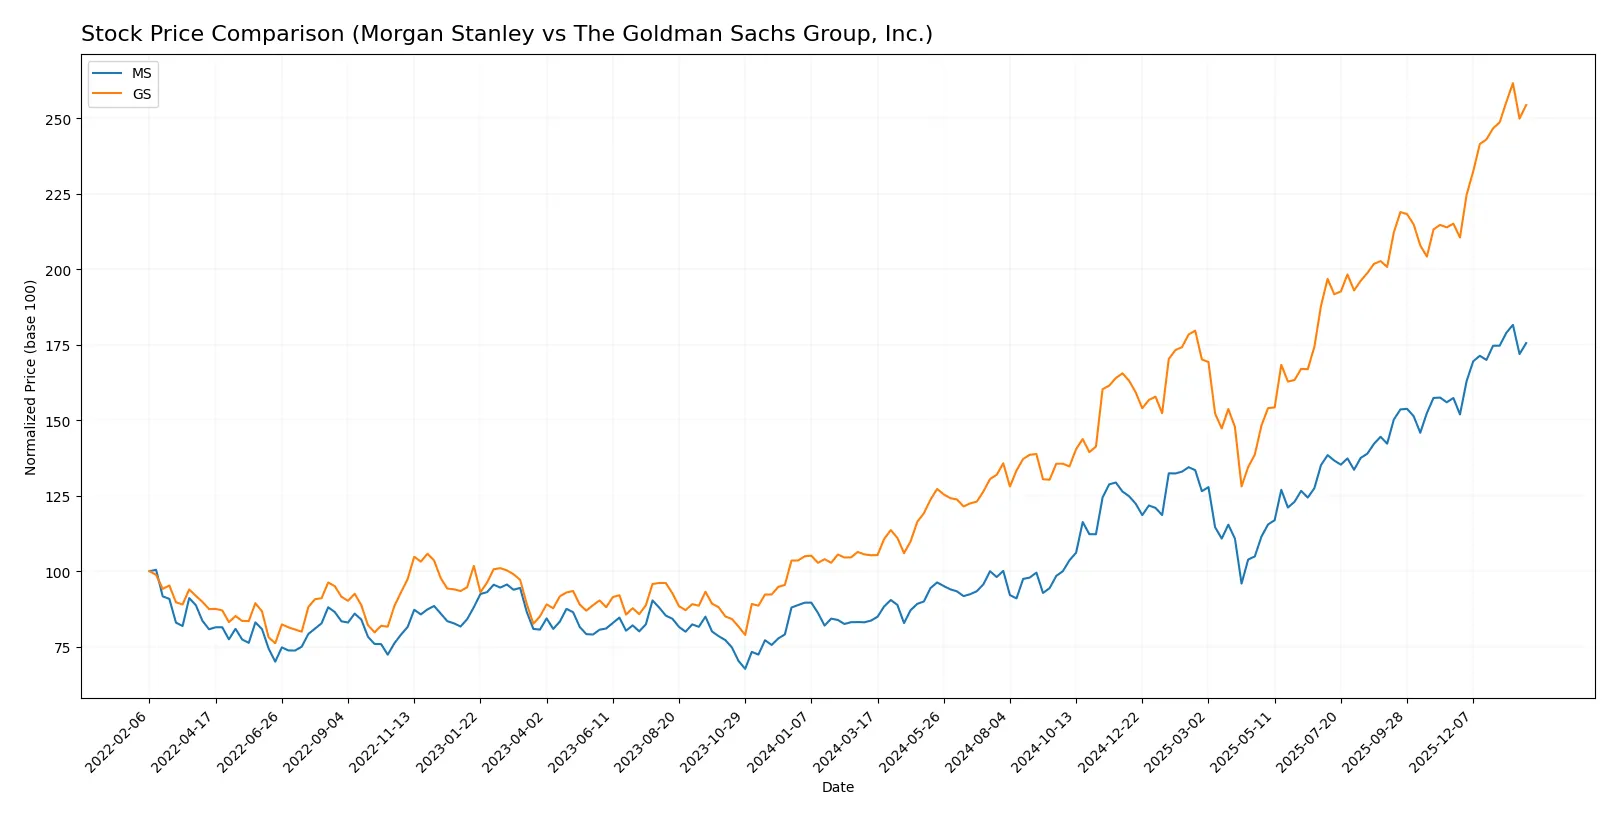
Trend Comparison
Morgan Stanley’s stock rose 110.02% over the past 12 months, displaying a bullish trend with accelerating gains and moderate volatility (27.48 std deviation). It reached a high of 189.09 and a low of 86.19.
The Goldman Sachs Group’s stock gained 141.71% in the same period, also bullish with accelerating momentum but significantly higher volatility (149.43 std deviation). Its price ranged from 386.99 to 962.0.
Goldman Sachs outperformed Morgan Stanley in market returns, delivering the highest price appreciation over the last year despite elevated volatility.
Target Prices
Analysts present a positive outlook with solid upside potential for Morgan Stanley and Goldman Sachs.
| Company | Target Low | Target High | Consensus |
|---|---|---|---|
| Morgan Stanley | 165 | 220 | 196 |
| The Goldman Sachs Group, Inc. | 604 | 1100 | 903 |
Morgan Stanley’s consensus target of 196 suggests a 7% upside from its current 183 price. Goldman Sachs shows a roughly 4% downside to its 903 consensus from the current 935 price.

Don’t Let Luck Decide Your Entry Point
Optimize your entry points with our advanced ProRealTime indicators. You’ll get efficient buy signals with precise price targets for maximum performance. Start outperforming now!
How do institutions grade them?
Morgan Stanley Grades
The following table summarizes recent grades from reputable firms for Morgan Stanley:
| Grading Company | Action | New Grade | Date |
|---|---|---|---|
| Keefe, Bruyette & Woods | Maintain | Outperform | 2026-01-16 |
| JP Morgan | Maintain | Neutral | 2026-01-08 |
| Barclays | Maintain | Overweight | 2026-01-05 |
| Keefe, Bruyette & Woods | Maintain | Outperform | 2025-12-17 |
| Wolfe Research | Upgrade | Outperform | 2025-11-24 |
| JP Morgan | Maintain | Neutral | 2025-10-21 |
| Keefe, Bruyette & Woods | Maintain | Outperform | 2025-10-16 |
| Citigroup | Maintain | Neutral | 2025-10-16 |
| Jefferies | Maintain | Buy | 2025-10-16 |
| Evercore ISI Group | Maintain | Outperform | 2025-10-16 |
The Goldman Sachs Group, Inc. Grades
Below is a summary of recent institutional grades for Goldman Sachs:
| Grading Company | Action | New Grade | Date |
|---|---|---|---|
| RBC Capital | Maintain | Sector Perform | 2026-01-20 |
| Keefe, Bruyette & Woods | Maintain | Market Perform | 2026-01-16 |
| Wells Fargo | Maintain | Overweight | 2026-01-16 |
| JP Morgan | Maintain | Neutral | 2026-01-08 |
| Barclays | Maintain | Overweight | 2026-01-05 |
| Keefe, Bruyette & Woods | Maintain | Market Perform | 2025-12-17 |
| JP Morgan | Downgrade | Neutral | 2025-10-21 |
| Freedom Capital Markets | Upgrade | Hold | 2025-10-17 |
| Keefe, Bruyette & Woods | Maintain | Market Perform | 2025-10-17 |
| Citigroup | Maintain | Neutral | 2025-10-16 |
Which company has the best grades?
Morgan Stanley consistently receives higher grades such as Outperform and Buy, while Goldman Sachs mainly garners Market Perform and Neutral ratings. This disparity suggests Morgan Stanley is viewed more favorably by analysts, potentially indicating stronger market confidence and investor interest.
Risks specific to each company
The following categories identify the critical pressure points and systemic threats facing both firms in the 2026 market environment:
1. Market & Competition
Morgan Stanley
- Faces intense competition in wealth management and institutional securities; must innovate to maintain market share.
The Goldman Sachs Group, Inc.
- Competes aggressively across investment banking and asset management; stronger ROE signals better operational efficiency.
2. Capital Structure & Debt
Morgan Stanley
- Shows favorable debt to equity ratios but weak interest coverage, raising concerns on debt servicing.
The Goldman Sachs Group, Inc.
- Exhibits high debt-to-equity ratio and weak interest coverage, increasing financial risk under tightening credit conditions.
3. Stock Volatility
Morgan Stanley
- Beta at 1.197 indicates moderate volatility, slightly below industry peers.
The Goldman Sachs Group, Inc.
- Beta at 1.322 shows higher volatility, reflecting sensitivity to market swings.
4. Regulatory & Legal
Morgan Stanley
- Operates under stringent financial regulations; past legal challenges require ongoing compliance focus.
The Goldman Sachs Group, Inc.
- Faces complex regulatory scrutiny amid diverse global operations, increasing legal and compliance risks.
5. Supply Chain & Operations
Morgan Stanley
- Operational risks stem from technology integration and market liquidity dependencies.
The Goldman Sachs Group, Inc.
- Operational complexity higher with multiple business segments; risk of execution missteps elevated.
6. ESG & Climate Transition
Morgan Stanley
- ESG initiatives advancing but pressure to align investments with evolving climate policies.
The Goldman Sachs Group, Inc.
- Stronger ESG commitments reported; must balance transition risks with client demands.
7. Geopolitical Exposure
Morgan Stanley
- Global presence exposes it to geopolitical tensions impacting cross-border deals.
The Goldman Sachs Group, Inc.
- Similar global footprint faces risks from geopolitical instability and regulatory divergence.
Which company shows a better risk-adjusted profile?
Morgan Stanley’s most impactful risk lies in its weak interest coverage despite controlled leverage. Goldman Sachs grapples with high leverage and elevated stock volatility. I see Goldman Sachs holding a marginally better risk-adjusted profile due to stronger profitability metrics and a robust Piotroski score, despite debt concerns. Recent data show Morgan Stanley’s Altman Z-score deep in distress, raising caution on its financial stability.
Final Verdict: Which stock to choose?
Morgan Stanley’s superpower lies in its robust income growth and operational efficiency, driving strong net margins and EPS gains. Its point of vigilance is a strained liquidity position, which could pressure short-term flexibility. It fits well within an aggressive growth portfolio that tolerates some balance sheet risks for higher returns.
The Goldman Sachs Group’s strategic moat is its disciplined cost management and strong capital base, offering a comparatively safer profile than Morgan Stanley. While its returns on equity and assets appear more modest, its stability and strong Piotroski score suit a GARP portfolio focused on balanced growth and risk mitigation.
If you prioritize aggressive growth fueled by operational momentum, Morgan Stanley stands out due to its superior income growth and market acceleration. However, if you seek better financial stability and a more defensive growth approach, Goldman Sachs offers a more measured risk profile despite commanding a premium valuation. Both present analytical scenarios worth considering based on your risk tolerance and investment horizon.
Disclaimer: Investment carries a risk of loss of initial capital. The past performance is not a reliable indicator of future results. Be sure to understand risks before making an investment decision.
Go Further
I encourage you to read the complete analyses of Morgan Stanley and The Goldman Sachs Group, Inc. to enhance your investment decisions: