Home > Comparison > Financial Services > MS vs SCHW
The strategic rivalry between Morgan Stanley and The Charles Schwab Corporation shapes the financial services sector’s evolution. Morgan Stanley operates as a diversified capital markets powerhouse with strong institutional and wealth management segments. In contrast, Charles Schwab focuses on retail brokerage and advisory services, emphasizing client-centric wealth management. This analysis pits Morgan Stanley’s broad operational model against Schwab’s client-focused approach to identify which offers superior risk-adjusted returns for a diversified portfolio in 2026.
Table of contents
Companies Overview
Morgan Stanley and The Charles Schwab Corporation are pillars in the U.S. financial services market, each commanding substantial market capitalizations.
Morgan Stanley: Global Financial Powerhouse
Morgan Stanley dominates the capital markets sector with diversified revenue from Institutional Securities, Wealth Management, and Investment Management. Its core strength lies in capital raising, advisory, and sales & trading services. In 2026, the firm has sharpened its focus on integrated wealth management to leverage cross-segment synergies and expand client solutions globally.
The Charles Schwab Corporation: Retail & Advisory Leader
Charles Schwab excels in retail brokerage and wealth management, generating revenue through Investor and Advisor Services segments. It emphasizes brokerage, banking, and advisory services tailored to individual investors and advisors. Its 2026 strategy prioritizes enhancing digital platforms and expanding advisory solutions to capture growing demand for personalized financial planning.
Strategic Collision: Similarities & Divergences
Both firms compete fiercely in wealth management but diverge in approach: Morgan Stanley favors a full-service institutional model, while Schwab leans on scalable retail and advisory platforms. The primary battleground is client acquisition and retention through technology and advisory breadth. Their distinct investment profiles reflect Morgan Stanley’s global institutional reach versus Schwab’s focus on retail scale and innovation.
Income Statement Comparison
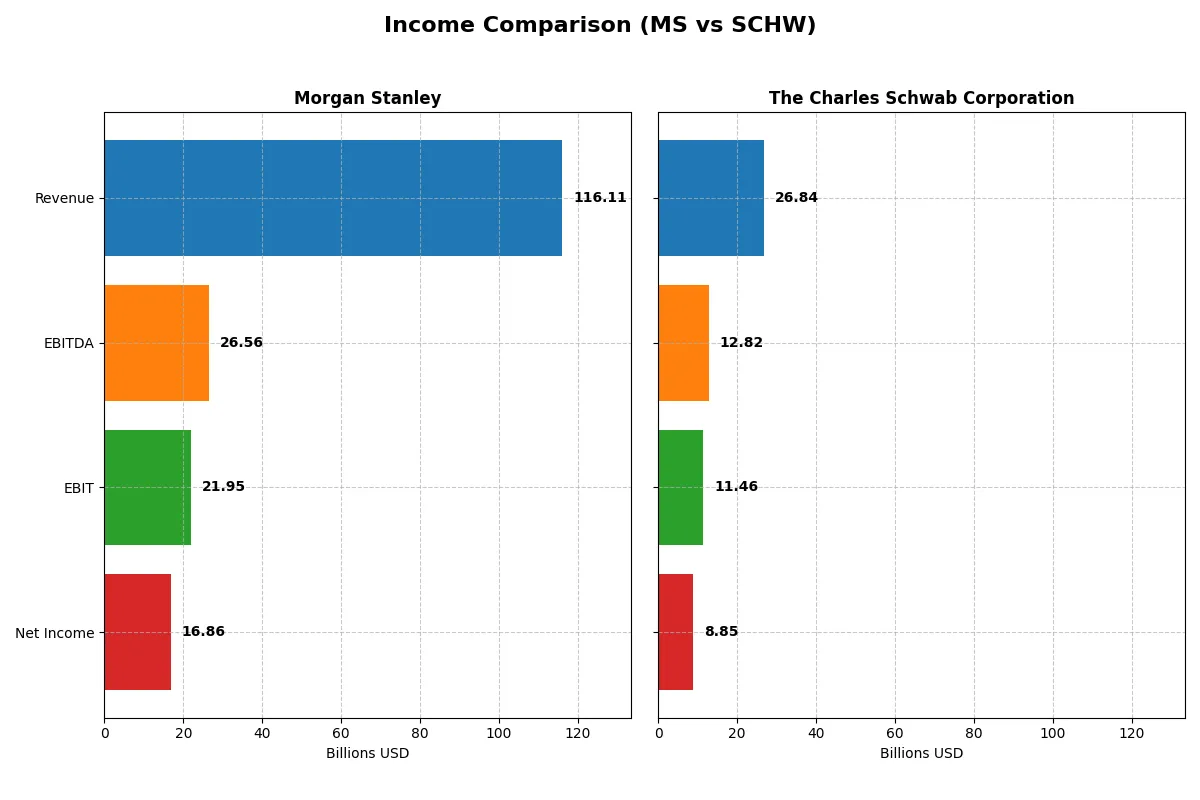
This data dissects the core profitability and scalability of both corporate engines to reveal who dominates the bottom line:
| Metric | Morgan Stanley (MS) | The Charles Schwab Corporation (SCHW) |
|---|---|---|
| Revenue | 116.1B | 26.8B |
| Cost of Revenue | 49.4B | 2.9B |
| Operating Expenses | 44.8B | 12.5B |
| Gross Profit | 66.7B | 23.9B |
| EBITDA | 26.6B | 12.8B |
| EBIT | 21.9B | 11.5B |
| Interest Expense | 49.0B | 3.8B |
| Net Income | 16.9B | 8.9B |
| EPS | 10.34 | 4.68 |
| Fiscal Year | 2025 | 2025 |
Income Statement Analysis: The Bottom-Line Duel
This income statement comparison uncovers the true operational efficiency and profitability of Morgan Stanley and The Charles Schwab Corporation.
Morgan Stanley Analysis
Morgan Stanley’s revenue doubled from 2021 to 2025, reaching 116B, with net income rising to 16.2B in 2025. Its gross margin stays solid at 57.5%, while net margin holds a favorable 14.5%. The firm shows strong momentum with 12.6% revenue growth and 28.3% EPS growth in the latest year, despite rising interest expenses weighing on margins.
The Charles Schwab Corporation Analysis
Charles Schwab’s revenue climbed 41% from 2021 to 2025, hitting 26.8B, with net income growing 51% to 8.4B. It boasts an exceptional 89.1% gross margin and a robust 33.0% net margin. Schwab accelerated its EBIT by nearly 49% in 2025 and delivered a remarkable 56% jump in EPS, signaling strong operational leverage and cost discipline.
Margin Power vs. Revenue Scale
Morgan Stanley dominates in raw revenue size and steady top-line growth, while Schwab excels with superior margins and faster profitability gains. Schwab’s higher net margin and rapid EPS expansion mark it as the more efficient operator. Investors favoring scale and consistent growth may lean toward Morgan Stanley; those prioritizing margin strength and earnings momentum find Schwab’s profile more attractive.
Financial Ratios Comparison
These vital ratios act as a diagnostic tool to expose the underlying fiscal health, valuation premiums, and capital efficiency of the companies compared here:
| Ratios | Morgan Stanley (MS) | The Charles Schwab Corporation (SCHW) |
|---|---|---|
| ROE | 12.8% (2024) | 12.3% (2024) |
| ROIC | 2.5% (2024) | 5.6% (2024) |
| P/E | 14.9 (2024) | 22.8 (2024) |
| P/B | 1.91 (2024) | 2.80 (2024) |
| Current Ratio | 0.66 (2024) | 0.54 (2024) |
| Quick Ratio | 0.66 (2024) | 0.54 (2024) |
| D/E | 3.45 (2024) | 0.93 (2024) |
| Debt-to-Assets | 29.7% (2024) | 9.4% (2024) |
| Interest Coverage | 0.39 (2024) | 1.20 (2024) |
| Asset Turnover | 0.085 (2024) | 0.054 (2024) |
| Fixed Asset Turnover | 4,485 (2024) | 6.62 (2024) |
| Payout ratio | 45.8% (2024) | 38.3% (2024) |
| Dividend yield | 3.07% (2024) | 1.68% (2024) |
| Fiscal Year | 2024 | 2024 |
Efficiency & Valuation Duel: The Vital Signs
Ratios act as a company’s DNA, unveiling hidden risks and operational strengths that shape investment decisions.
Morgan Stanley
Morgan Stanley shows a solid net margin of 14.52%, indicating operational efficiency. Its P/E ratio of 16.54 suggests a fairly valued stock. The 2.17% dividend yield rewards shareholders, balancing moderate profitability with consistent returns. However, some liquidity ratios remain weak, signaling caution in short-term financial health.
The Charles Schwab Corporation
Charles Schwab boasts a robust net margin of 32.98%, reflecting strong profitability. The stock trades at a neutral P/E of 20. Its dividend yield of 1.08% is modest, implying a possible focus on reinvestment or growth. Interest coverage is adequate, but several efficiency ratios show room for improvement.
Margin Strength vs. Valuation Discipline
Schwab offers superior profitability but trades at a premium valuation compared to Morgan Stanley’s more balanced profile. Morgan Stanley’s dividend yield and reasonable P/E provide steady income, while Schwab’s higher margins suit growth-focused investors. Risk-tolerant investors may prefer Schwab; income seekers might lean toward Morgan Stanley.
Which one offers the Superior Shareholder Reward?
I see Morgan Stanley (MS) yields 3.07% with a payout ratio near 46%, balancing dividends and aggressive buybacks that boost total return. Charles Schwab (SCHW) yields just 1.08% with a lower 22% payout, favoring reinvestment and modest buybacks. MS’s model appears more sustainable and rewarding in 2026.
Comparative Score Analysis: The Strategic Profile
The radar chart reveals the fundamental DNA and trade-offs of Morgan Stanley and The Charles Schwab Corporation:
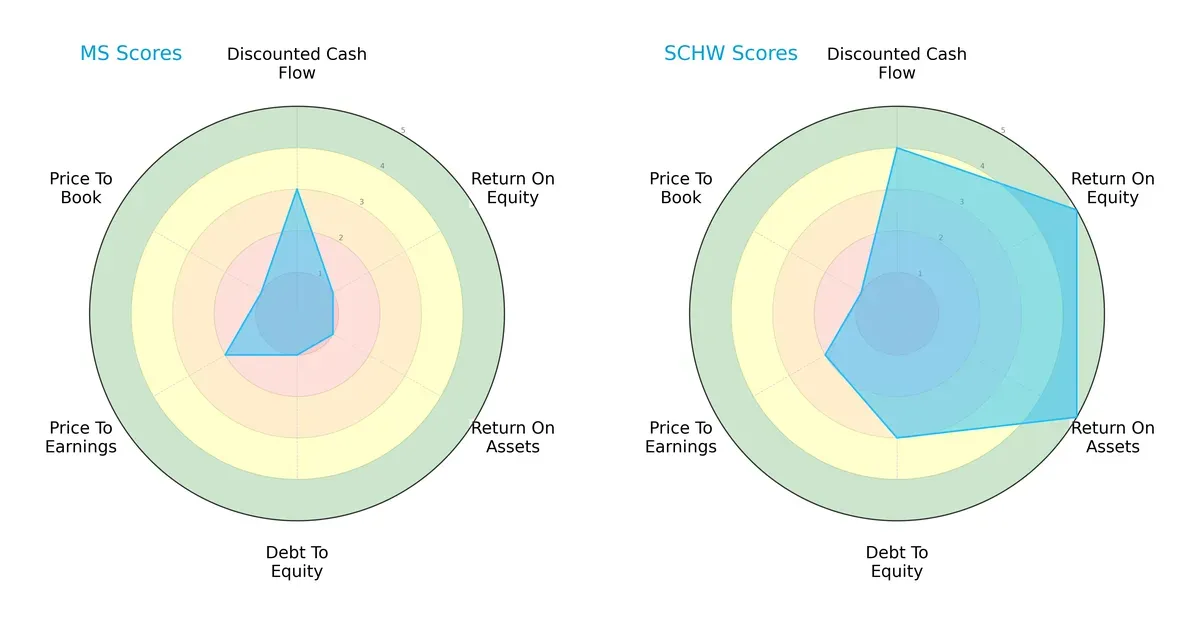
Charles Schwab presents a balanced and robust profile, excelling in ROE (5) and ROA (5), indicating superior profitability and asset use. Morgan Stanley lags with very unfavorable scores in ROE (1), ROA (1), and debt-to-equity (1), relying mainly on a moderate discounted cash flow score (3). Schwab’s moderate debt-to-equity score (3) suggests prudent leverage, whereas Morgan Stanley’s financial risk remains pronounced. Valuation metrics are similar for both, with modest P/E scores (2) and weak P/B scores (1), but Schwab’s overall score (4) outshines Morgan Stanley’s (1).
Bankruptcy Risk: Solvency Showdown
The Altman Z-Score gap signals drastically different survival prospects in this cycle:
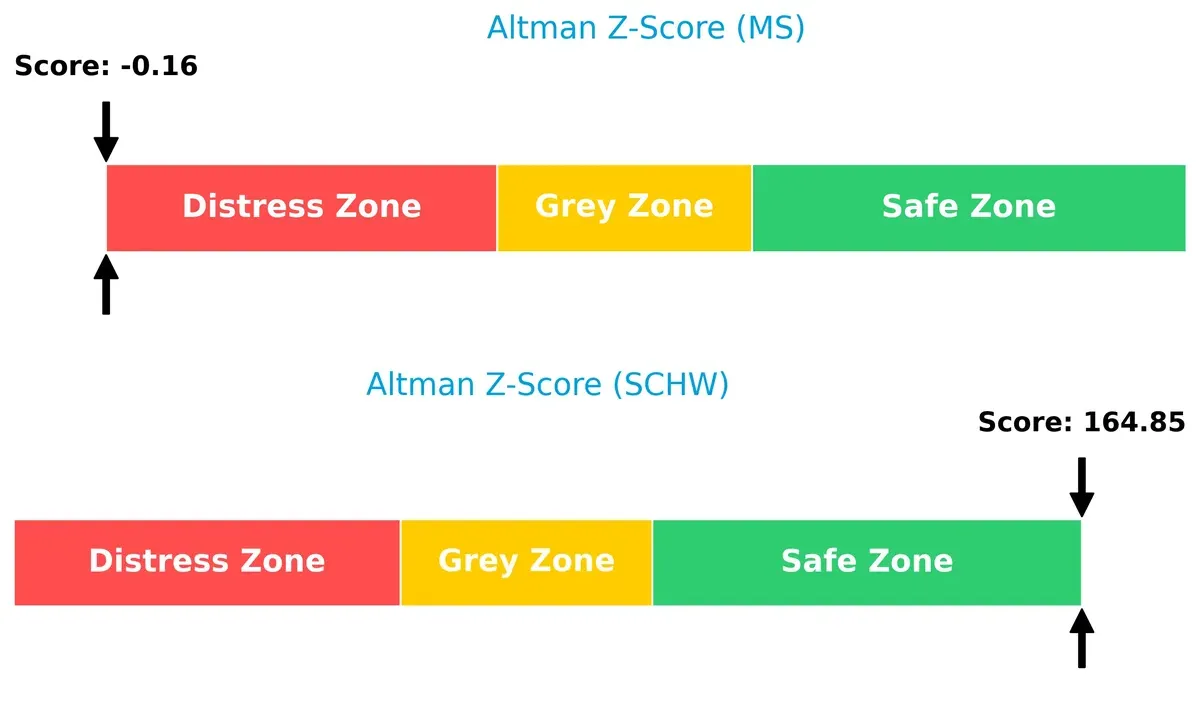
Charles Schwab’s robust Z-score (165) places it firmly in the safe zone, indicating minimal bankruptcy risk. Morgan Stanley’s negative score (-0.16) flags severe financial distress and a high bankruptcy probability, exposing critical solvency concerns.
Financial Health: Quality of Operations
Piotroski F-Scores highlight operational quality and internal financial strength differences:
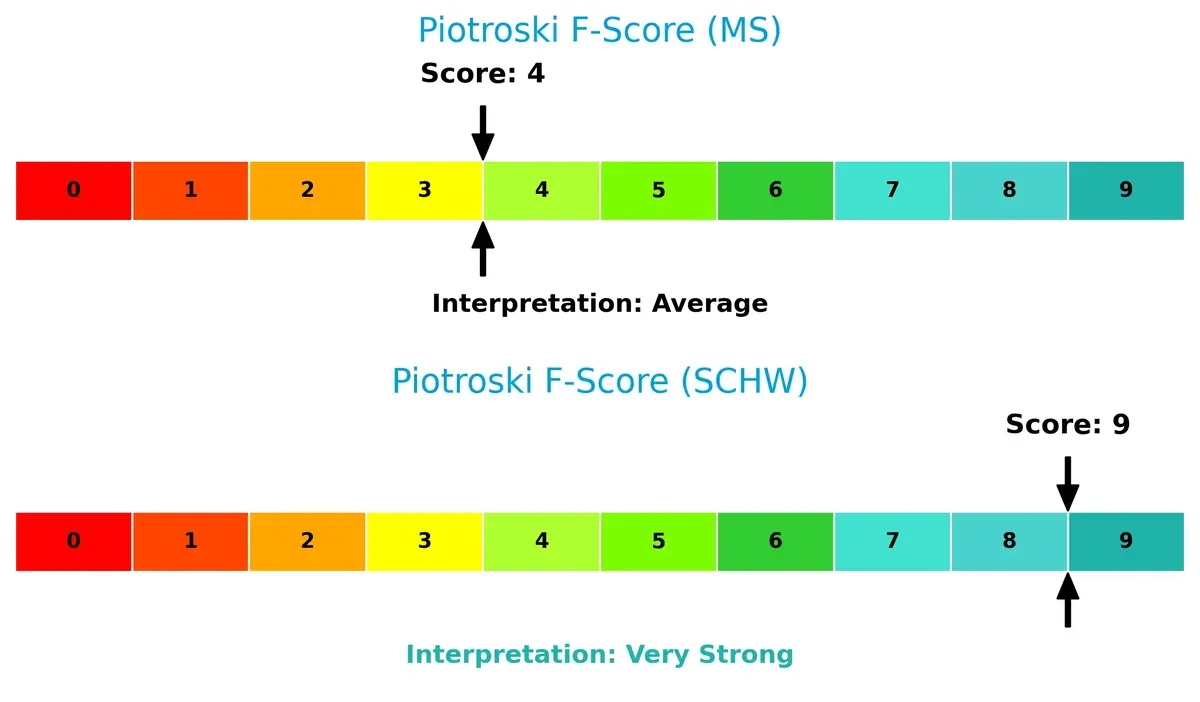
Charles Schwab scores a perfect 9, reflecting very strong financial health and operational efficiency. Morgan Stanley’s score of 4 signals average health with potential red flags in profitability or liquidity. Schwab’s high score confirms it as the superior choice for investors prioritizing financial robustness.
How are the two companies positioned?
This section dissects the operational DNA of Morgan Stanley and Charles Schwab by comparing their revenue distribution and internal dynamics. The goal is to confront their economic moats and identify the most resilient and sustainable advantage in today’s market.
Revenue Segmentation: The Strategic Mix
This visual comparison dissects how Morgan Stanley and The Charles Schwab Corporation diversify their income streams and where their primary sector bets lie:
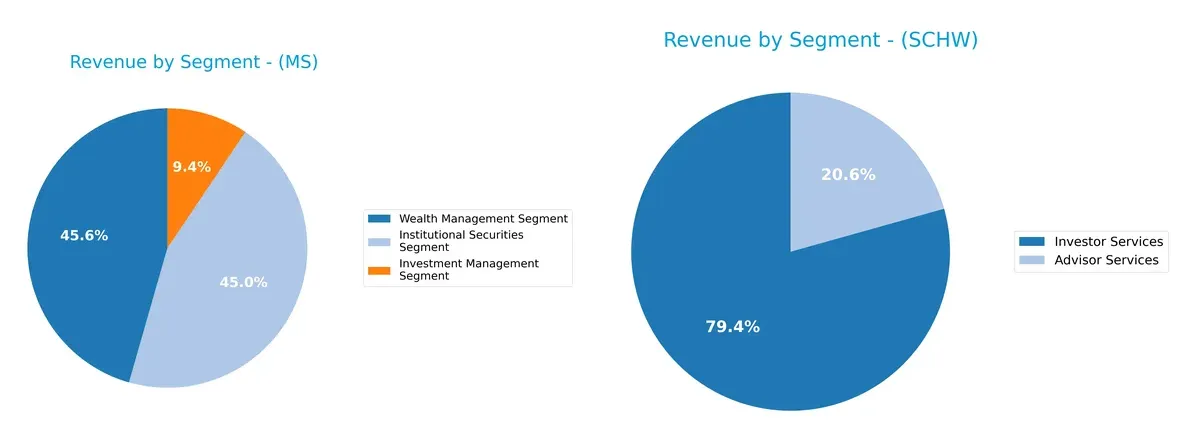
Morgan Stanley anchors its revenue around Institutional Securities ($28.1B) and Wealth Management ($28.4B), with Investment Management trailing at $5.9B. Schwab pivots on Investor Services ($15.6B) and Advisor Services ($4.0B), showing a more concentrated two-segment model. Morgan Stanley’s diversified mix balances capital markets and wealth ecosystems, reducing concentration risk. Schwab’s focus suggests deep infrastructure dominance in brokerage and advisory, but with higher exposure to market volatility in Investor Services.
Strengths and Weaknesses Comparison
This table compares the strengths and weaknesses of Morgan Stanley and The Charles Schwab Corporation:
Morgan Stanley Strengths
- Diverse revenue streams across Institutional Securities, Wealth and Investment Management
- Strong global presence with significant Americas, Asia, and EMEA sales
- Favorable net margin at 14.52%
- Low debt-to-equity and debt-to-assets ratios
- Dividend yield at 2.17%
The Charles Schwab Corporation Strengths
- High net margin of 32.98% indicates superior profitability
- Favorable price-to-book ratio
- Favorable debt ratios imply strong balance sheet
- Neutral interest coverage at 3.05
- Revenue growth in Advisor and Investor Services segments
Morgan Stanley Weaknesses
- Unfavorable returns on equity and invested capital
- Poor liquidity ratios with zero current and quick ratios
- Low interest coverage at 0.45 signals risk on debt servicing
- Unfavorable asset and fixed asset turnover ratios
- Overall slightly unfavorable global ratios evaluation
The Charles Schwab Corporation Weaknesses
- Unfavorable returns on equity and invested capital
- Poor liquidity ratios with zero current and quick ratios
- Unfavorable asset and fixed asset turnover ratios
- Neutral dividend yield at 1.08% is modest
- Overall slightly unfavorable global ratios evaluation
Morgan Stanley shows strength in global diversification and segment revenue balance but faces critical liquidity and return challenges. Charles Schwab delivers robust profitability yet shares some liquidity and efficiency weaknesses, highlighting areas for strategic focus for both firms.
The Moat Duel: Analyzing Competitive Defensibility
A structural moat is the only safeguard against relentless profit erosion from competition. Here’s how Morgan Stanley and Charles Schwab defend their turf:
Morgan Stanley: Diversified Advisory and Wealth Management Moat
Morgan Stanley’s moat stems from its integrated wealth management and institutional advisory services. This synergy drives stable margins and robust 15% net profitability. Expansion in Asia and alternative investments could deepen this moat in 2026.
The Charles Schwab Corporation: Cost Leadership and Scale Moat
Schwab’s competitive edge lies in its low-cost brokerage and vast retail network, delivering superior 33% net margins. Its scale fuels rapid EPS growth and supports expansion into advisory and banking services.
Verdict: Advisory Integration vs. Cost Leadership
I see Schwab’s cost advantage as a wider moat, given its superior margins and growth. Morgan Stanley’s diversified services build depth but face margin pressure. Schwab is better positioned to defend market share in a fee-sensitive environment.
Which stock offers better returns?
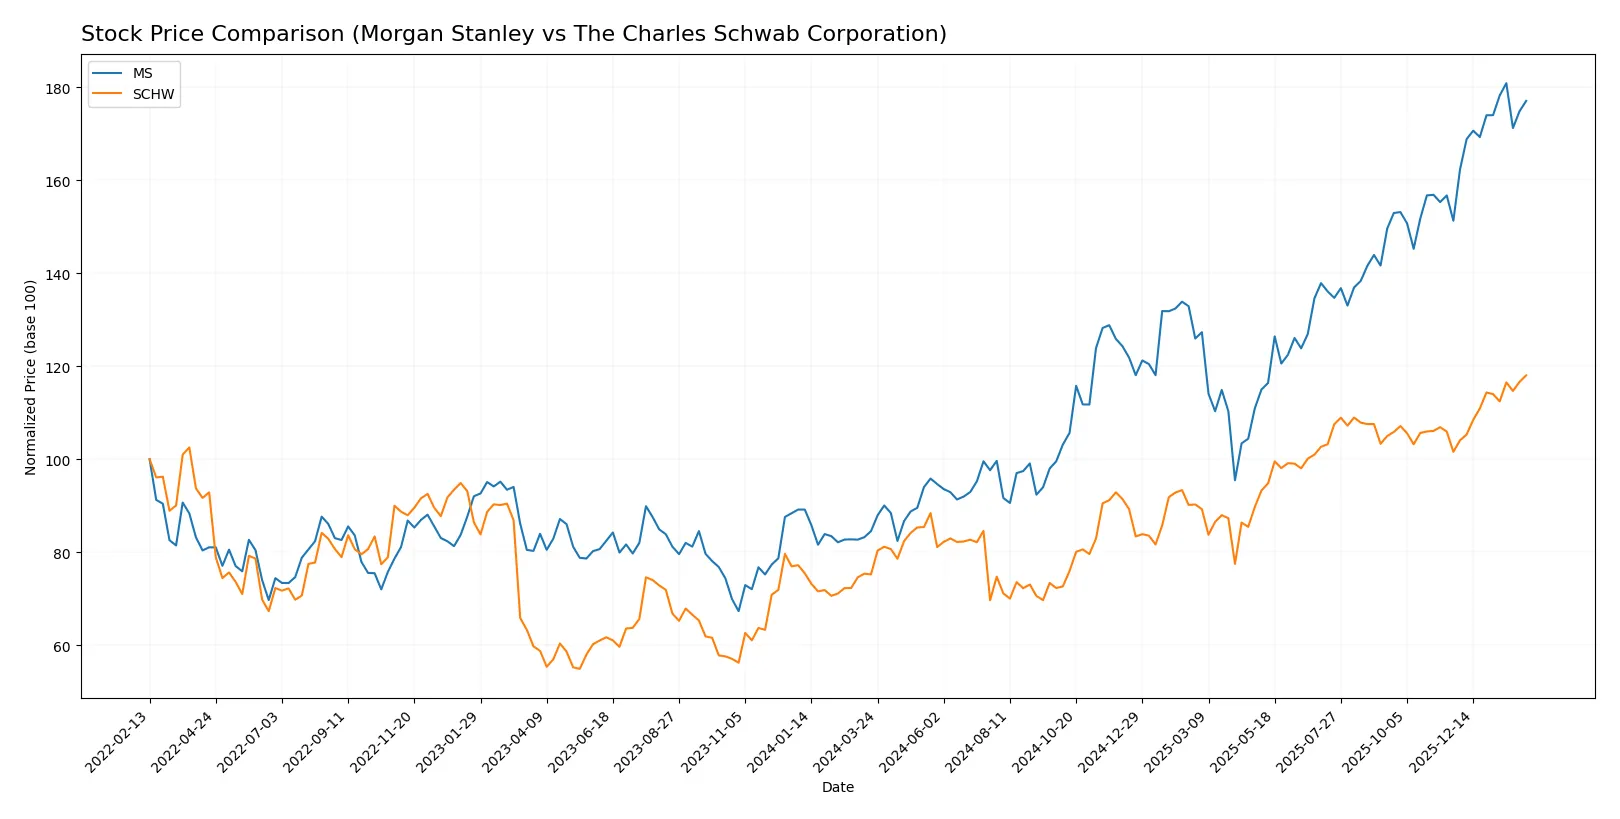
Over the past 12 months, Morgan Stanley and The Charles Schwab Corporation experienced strong price gains, both showing accelerating bullish trends with notable price ranges and buyer dominance in recent trading.
Trend Comparison
Morgan Stanley’s stock rose 109.44% over 12 months, marking a bullish trend with accelerating momentum. The price ranged from 86.19 to 189.09, with a high volatility of 27.75%.
The Charles Schwab Corporation posted a 56.88% gain, also bullish and accelerating. Its price fluctuated between 62.08 and 105.17, with lower volatility at 11.8%.
Morgan Stanley outperformed Schwab with nearly double the price appreciation, showing stronger market returns over the one-year period.
Target Prices
Analysts present a cautiously optimistic consensus for Morgan Stanley and The Charles Schwab Corporation.
| Company | Target Low | Target High | Consensus |
|---|---|---|---|
| Morgan Stanley | 165 | 220 | 196 |
| The Charles Schwab Corporation | 105 | 148 | 122.78 |
Morgan Stanley’s consensus target of 196 suggests a 6% upside from the current 185 price. Schwab’s 123 target indicates about 17% potential gain above its 105 price.

Don’t Let Luck Decide Your Entry Point
Optimize your entry points with our advanced ProRealTime indicators. You’ll get efficient buy signals with precise price targets for maximum performance. Start outperforming now!
How do institutions grade them?
The following tables summarize recent institutional grades for Morgan Stanley and The Charles Schwab Corporation:
Morgan Stanley Grades
This table shows the latest grades from recognized financial institutions for Morgan Stanley.
| Grading Company | Action | New Grade | Date |
|---|---|---|---|
| Keefe, Bruyette & Woods | Maintain | Outperform | 2026-01-16 |
| JP Morgan | Maintain | Neutral | 2026-01-08 |
| Barclays | Maintain | Overweight | 2026-01-05 |
| Keefe, Bruyette & Woods | Maintain | Outperform | 2025-12-17 |
| Wolfe Research | Upgrade | Outperform | 2025-11-24 |
| JP Morgan | Maintain | Neutral | 2025-10-21 |
| Keefe, Bruyette & Woods | Maintain | Outperform | 2025-10-16 |
| Citigroup | Maintain | Neutral | 2025-10-16 |
| Jefferies | Maintain | Buy | 2025-10-16 |
| Evercore ISI Group | Maintain | Outperform | 2025-10-16 |
The Charles Schwab Corporation Grades
This table lists recent grade actions from established grading firms for The Charles Schwab Corporation.
| Grading Company | Action | New Grade | Date |
|---|---|---|---|
| Barclays | Maintain | Overweight | 2026-01-26 |
| Barclays | Maintain | Overweight | 2026-01-22 |
| TD Cowen | Maintain | Buy | 2026-01-22 |
| Truist Securities | Maintain | Buy | 2026-01-22 |
| UBS | Maintain | Buy | 2026-01-22 |
| Piper Sandler | Maintain | Neutral | 2026-01-14 |
| TD Cowen | Maintain | Buy | 2026-01-14 |
| Citizens | Maintain | Market Outperform | 2026-01-12 |
| Barclays | Maintain | Overweight | 2026-01-08 |
| Truist Securities | Maintain | Buy | 2026-01-07 |
Which company has the best grades?
The Charles Schwab Corporation consistently receives Buy and Overweight grades, indicating strong analyst confidence. Morgan Stanley’s grades lean towards Outperform and Neutral, reflecting cautious optimism. Schwab’s stronger consensus may attract investors seeking higher conviction, while Morgan Stanley presents a balanced outlook.
Risks specific to each company
The following categories identify the critical pressure points and systemic threats facing both firms in the 2026 market environment:
1. Market & Competition
Morgan Stanley
- Faces intense competition in global capital markets with pressure on margins.
The Charles Schwab Corporation
- Competes heavily in retail brokerage and wealth management, leveraging scale and technology.
2. Capital Structure & Debt
Morgan Stanley
- Shows favorable debt-to-equity metrics but weak interest coverage at 0.45x, a red flag.
The Charles Schwab Corporation
- Maintains moderate debt levels with interest coverage at a safer 3.05x, indicating stronger balance sheet resilience.
3. Stock Volatility
Morgan Stanley
- Exhibits higher beta at 1.20, indicating above-market volatility risk.
The Charles Schwab Corporation
- Lower beta of 0.91 suggests more stable stock price movements relative to market.
4. Regulatory & Legal
Morgan Stanley
- Subject to stringent global financial regulations impacting institutional securities activities.
The Charles Schwab Corporation
- Faces regulatory scrutiny primarily in retail brokerage and advisory services, with evolving compliance demands.
5. Supply Chain & Operations
Morgan Stanley
- Complex operational footprint across regions increases risk of operational disruptions.
The Charles Schwab Corporation
- Operational focus on technology platforms mitigates physical supply chain risks but requires IT resilience.
6. ESG & Climate Transition
Morgan Stanley
- Increasing pressure to align investment products with ESG standards globally.
The Charles Schwab Corporation
- Emphasizes sustainable investing products but must navigate evolving ESG reporting standards.
7. Geopolitical Exposure
Morgan Stanley
- Significant exposure to geopolitical risks in emerging markets and cross-border transactions.
The Charles Schwab Corporation
- Primarily US-centric with limited direct geopolitical risk but sensitive to global market shocks.
Which company shows a better risk-adjusted profile?
Morgan Stanley’s most impactful risk lies in its weak interest coverage ratio, signaling potential debt servicing challenges. Schwab’s key risk is regulatory compliance amid rapid expansion of advisory services. Schwab’s superior Altman Z-score and Piotroski Score reveal a notably stronger financial footing. Its lower stock volatility and better debt metrics justify a more favorable risk-adjusted profile in 2026.
Final Verdict: Which stock to choose?
Morgan Stanley’s superpower lies in its robust revenue growth and strong operating margins, reflecting operational scalability. Its point of vigilance is the heavy reliance on leverage and interest coverage, which could pressure stability. This stock fits an aggressive growth portfolio willing to absorb some financial risk.
The Charles Schwab Corporation boasts a strategic moat of high net margins and consistent cash flow quality, underpinned by solid capital efficiency. Compared to Morgan Stanley, Schwab offers better financial stability and a safer balance sheet. It suits a GARP portfolio seeking steady growth with reasonable risk control.
If you prioritize aggressive growth and scalability, Morgan Stanley is the compelling choice due to its accelerating revenue and operating profit expansion. However, if you seek better financial stability and durable profitability, Charles Schwab offers superior capital efficiency and a safer balance sheet. Both present scenarios worth considering depending on your risk appetite and investment horizon.
Disclaimer: Investment carries a risk of loss of initial capital. The past performance is not a reliable indicator of future results. Be sure to understand risks before making an investment decision.
Go Further
I encourage you to read the complete analyses of Morgan Stanley and The Charles Schwab Corporation to enhance your investment decisions: