Home > Comparison > Financial Services > MS vs HOOD
The strategic rivalry between Morgan Stanley and Robinhood Markets defines the evolving landscape of financial services. Morgan Stanley operates as a capital-intensive global financial holding company, excelling in wealth and investment management. In contrast, Robinhood Markets leverages a high-growth, digital-first platform targeting retail investors. This analysis will evaluate which business model offers superior risk-adjusted returns amid sector disruption and shifting investor preferences.

Table of contents
Companies Overview
Morgan Stanley and Robinhood Markets stand as pivotal players reshaping the financial services landscape in 2026.
Morgan Stanley: Global Financial Powerhouse
Morgan Stanley dominates capital markets with diversified revenue streams from Institutional Securities, Wealth Management, and Investment Management. Its core strength lies in offering comprehensive advisory, underwriting, and asset management services worldwide. In 2026, the firm sharpens its focus on expanding wealth management to capture affluent clients amid volatile markets.
Robinhood Markets, Inc.: Democratizing Investment Access
Robinhood Markets disrupts with a user-centric digital platform enabling retail investors to trade stocks, ETFs, options, and cryptocurrencies commission-free. Its revenue primarily stems from payment for order flow and premium services. In 2026, Robinhood prioritizes educational content and cash management to deepen customer engagement and broaden its financial ecosystem.
Strategic Collision: Similarities & Divergences
Morgan Stanley emphasizes a full-service, diversified model targeting institutional and high-net-worth clients, while Robinhood champions low-cost, self-directed retail investing. Their battleground is the wealth management and retail brokerage space, where client acquisition and retention define success. Investors face contrasting profiles: legacy stability versus tech-driven growth, each with distinct risk and reward dynamics.
Income Statement Comparison
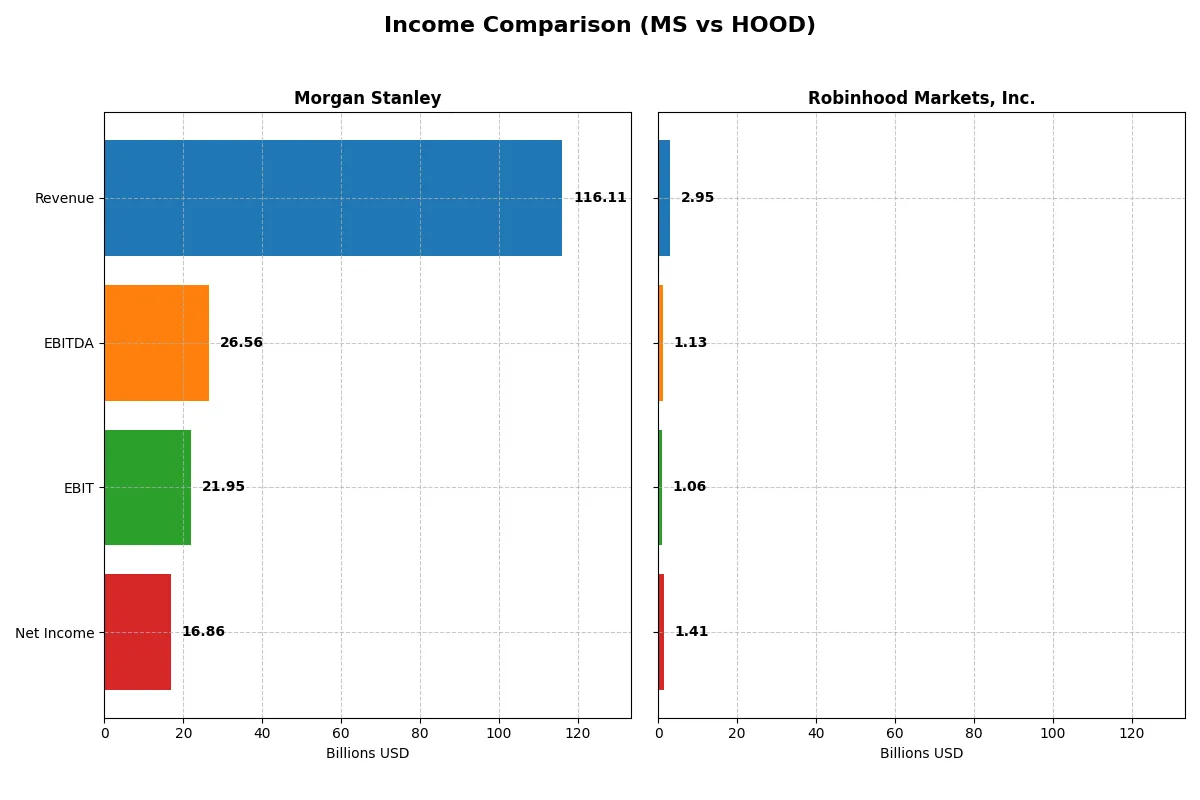
This data dissects the core profitability and scalability of both corporate engines to reveal who dominates the bottom line:
| Metric | Morgan Stanley (MS) | Robinhood Markets, Inc. (HOOD) |
|---|---|---|
| Revenue | 116.1B | 2.95B |
| Cost of Revenue | 49.4B | 504M |
| Operating Expenses | 44.8B | 1.39B |
| Gross Profit | 66.7B | 2.45B |
| EBITDA | 26.6B | 1.13B |
| EBIT | 21.95B | 1.06B |
| Interest Expense | 49.0B | 0 |
| Net Income | 16.9B | 1.41B |
| EPS | 10.34 | 1.60 |
| Fiscal Year | 2025 | 2024 |
Income Statement Analysis: The Bottom-Line Duel
This income statement comparison exposes which company converts revenue into profit more efficiently, revealing the strength of each corporate engine.
Morgan Stanley Analysis
Morgan Stanley’s revenue climbed steadily from 58B in 2021 to 116B in 2025, doubling over five years. Net income rose from 15B to 16B, reflecting solid but slower growth. Gross margin remains healthy at 57.5%, supporting an 18.9% EBIT margin. Despite rising interest expenses, 2025 showed strong momentum with a 12.6% revenue increase and 28% EPS growth, underscoring operational efficiency.
Robinhood Markets, Inc. Analysis
Robinhood surged revenue from 958M in 2020 to 2.95B in 2024, tripling in four years. Net income swung from a 3.7B loss in 2021 to a 1.41B profit in 2024, marking a dramatic turnaround. Exceptional margins stand out: 82.9% gross and 47.8% net in 2024. The company accelerated sharply last year, with a 58% revenue jump and a 357% EPS increase, signaling rapid scaling and margin expansion.
Margin Resilience vs. Explosive Growth
Morgan Stanley delivers steady, large-scale revenue with consistent profitability, while Robinhood exhibits remarkable margin improvements and explosive earnings growth. Fundamentally, Morgan Stanley holds the clear edge in scale and stable returns. Investors seeking rapid growth and margin expansion might find Robinhood’s profile compelling, albeit with higher volatility risk.
Financial Ratios Comparison
These vital ratios act as a diagnostic tool to expose the underlying fiscal health, valuation premiums, and capital efficiency of the companies compared below:
| Ratios | Morgan Stanley (MS) | Robinhood Markets, Inc. (HOOD) |
|---|---|---|
| ROE | 12.8% | 17.7% |
| ROIC | 2.5% | 6.8% |
| P/E | 14.9 | 23.3 |
| P/B | 1.91 | 4.12 |
| Current Ratio | 0.66 | 1.39 |
| Quick Ratio | 0.66 | 1.39 |
| D/E (Debt-to-Equity) | 3.45 | 0.94 |
| Debt-to-Assets | 29.7% | 28.5% |
| Interest Coverage | 0.39 | 0 (not reported) |
| Asset Turnover | 0.085 | 0.113 |
| Fixed Asset Turnover | 4485 | 21.2 |
| Payout Ratio | 36% | 0% |
| Dividend Yield | 2.17% | 0% |
| Fiscal Year | 2025 | 2024 |
Efficiency & Valuation Duel: The Vital Signs
Ratios act as the company’s DNA, revealing hidden risks and operational excellence essential for sound investment decisions.
Morgan Stanley
Morgan Stanley shows a favorable net margin at 14.5% but suffers from unfavorable ROE and ROIC, indicating weak profitability efficiency. Its P/E ratio of 16.5 suggests a neutral valuation, neither cheap nor stretched. The firm provides a 2.17% dividend yield, signaling steady shareholder returns amid reinvestment challenges.
Robinhood Markets, Inc.
Robinhood boasts a strong net margin of 47.8% and a favorable ROE of 17.7%, reflecting robust profitability. However, its P/E of 23.3 marks it as relatively expensive, paired with a high price-to-book ratio. The company pays no dividend, implying that it reinvests aggressively in growth and R&D.
Valuation Discipline vs. Profitability Dynamism
Morgan Stanley offers a more conservative valuation with moderate profitability and dividend income. Robinhood delivers higher profitability but at a stretched valuation and no dividends. Investors seeking income might prefer Morgan Stanley, while those targeting growth could lean toward Robinhood’s dynamic profile.
Which one offers the Superior Shareholder Reward?
Morgan Stanley (MS) delivers a more attractive shareholder reward than Robinhood Markets, Inc. (HOOD) in 2026. MS offers a solid 3.07% dividend yield with a sustainable payout ratio near 46%, supported by consistent free cash flow and a disciplined buyback program. HOOD pays no dividends and shows negative free cash flow, relying solely on reinvestment for growth. While HOOD’s high operating margins and growth prospects excite growth investors, its lack of cash returns and volatile profitability elevate risk. Historically, MS’s balanced capital allocation combining dividends and buybacks outperforms in total shareholder return, making it superior for income and stability-focused portfolios.
Comparative Score Analysis: The Strategic Profile
The radar chart reveals the fundamental DNA and trade-offs of Morgan Stanley and Robinhood Markets, Inc., highlighting their financial strengths and vulnerabilities:
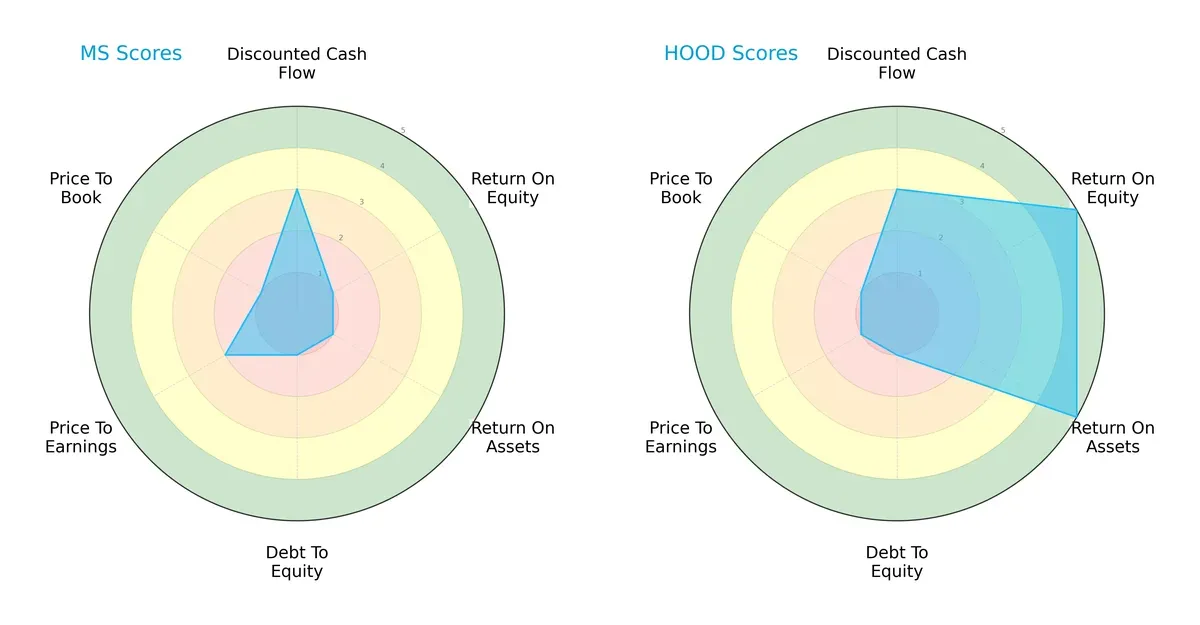
Morgan Stanley shows a moderate DCF score but struggles with very low ROE, ROA, and Debt/Equity scores, indicating operational inefficiency and high leverage risk. Robinhood delivers superior ROE and ROA scores, reflecting efficient asset use and profitability, but shares a weak Debt/Equity profile and poor valuation metrics. Robinhood’s profile is more balanced on profitability, while Morgan Stanley relies heavily on cash flow valuation, exposing strategic fragility.
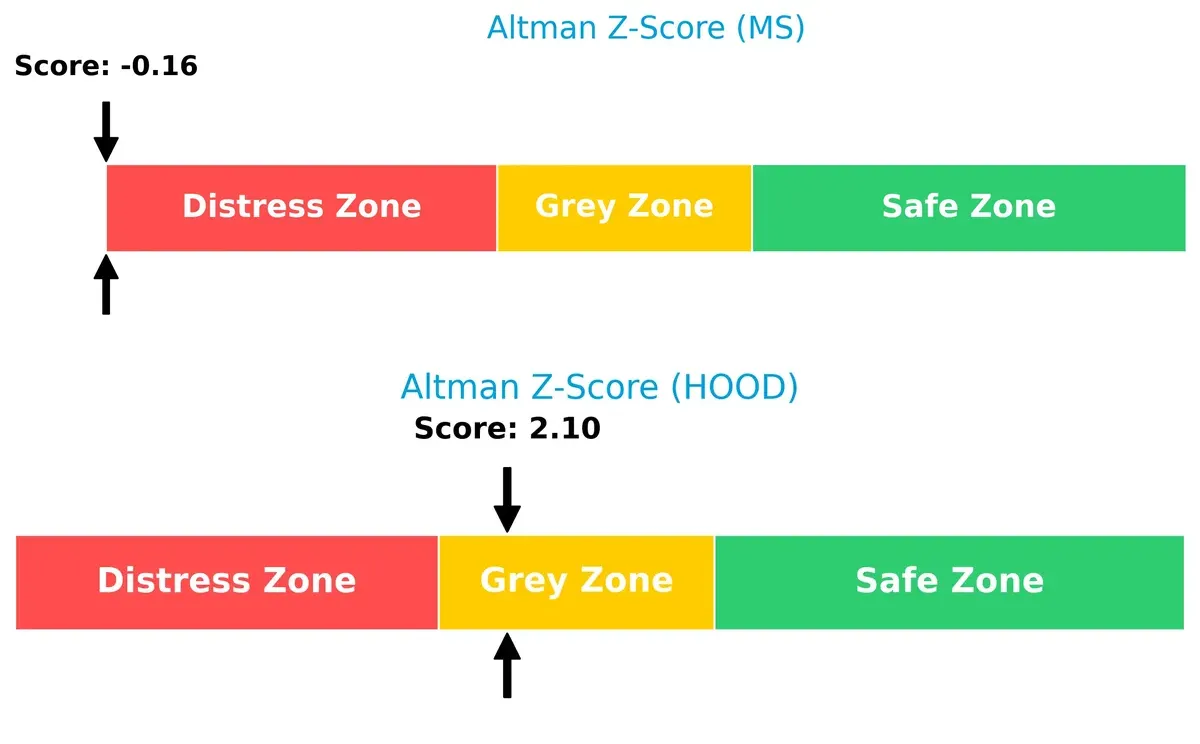
Bankruptcy Risk: Solvency Showdown
Morgan Stanley’s Altman Z-Score at -0.16 signals distress and heightened bankruptcy risk, whereas Robinhood’s 2.10 places it in a grey zone with moderate survival probability in this cycle:
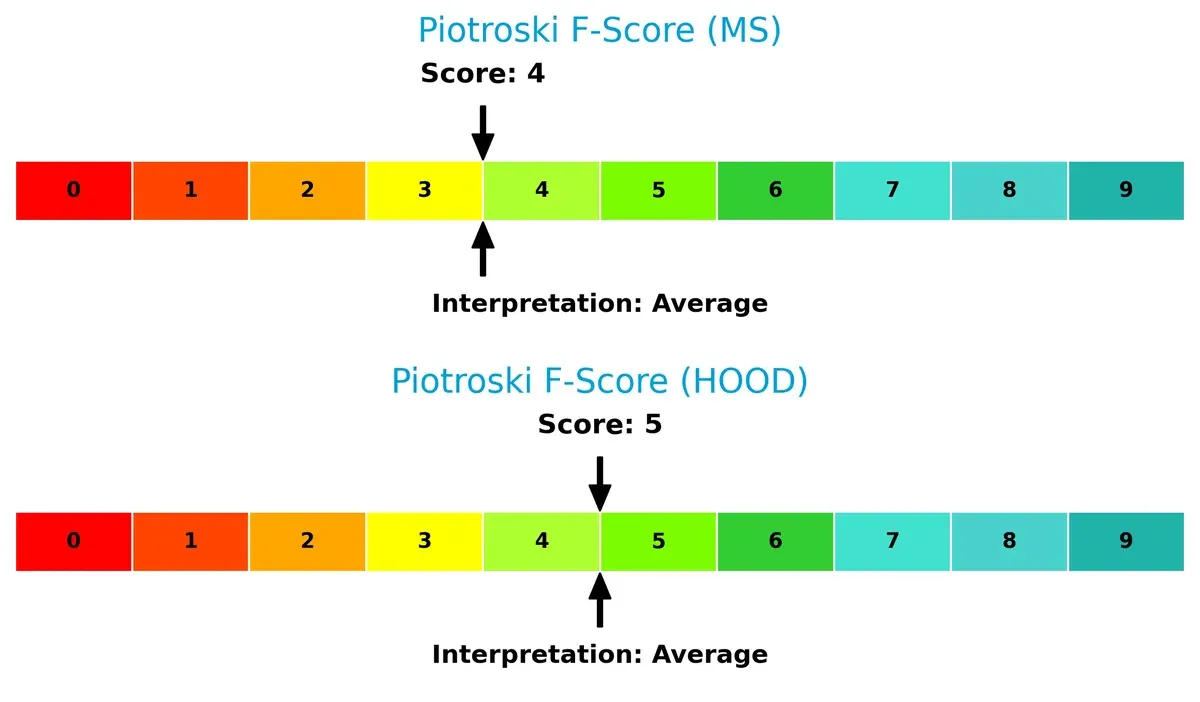
Financial Health: Quality of Operations
Both companies present average Piotroski F-Scores—4 for Morgan Stanley and 5 for Robinhood—indicating moderate financial health but no clear dominance. Neither firm exhibits peak operational strength, warranting cautious scrutiny:
How are the two companies positioned?
This section dissects the operational DNA of Morgan Stanley and Robinhood by comparing their revenue distribution and internal dynamics. The objective is to confront their economic moats to reveal which model offers the most resilient competitive advantage today.
Revenue Segmentation: The Strategic Mix
This visual comparison dissects how Morgan Stanley and Robinhood diversify their income streams and where their primary sector bets lie:
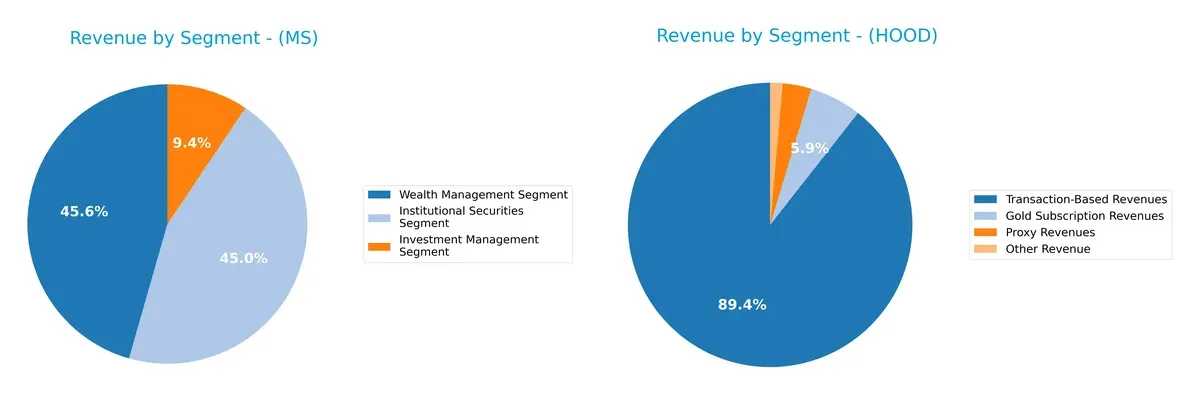
Morgan Stanley anchors its revenue around Institutional Securities ($28.1B) and Wealth Management ($28.4B), with a solid Investment Management base ($5.9B). This balanced mix reduces concentration risk and fuels ecosystem lock-in. Robinhood, however, pivots heavily on Transaction-Based Revenues ($1.65B), dwarfing its Gold Subscription ($109M) and Proxy Revenues ($60M). This heavy reliance exposes Robinhood to market volatility but leverages infrastructure dominance in retail trading.
Strengths and Weaknesses Comparison
This table compares the strengths and weaknesses of Morgan Stanley and Robinhood Markets, Inc.:
Morgan Stanley Strengths
- Diversified revenue from Institutional Securities, Wealth and Investment Management
- Favorable net margin of 14.52%
- Strong dividend yield at 2.17%
- Low debt-to-assets ratio indicating financial stability
- Significant global presence with revenues from Americas, Asia, and EMEA
Robinhood Strengths
- High net margin of 47.81% demonstrating strong profitability
- Favorable ROE at 17.7%
- Favorable quick ratio of 1.39 indicating liquidity
- Low debt-to-assets at 28.5% with infinite interest coverage
- High fixed asset turnover at 21.23 showing efficient asset use
Morgan Stanley Weaknesses
- Unfavorable ROE and ROIC with 0% values
- Unfavorable current and quick ratios at 0 indicating liquidity concerns
- Low interest coverage at 0.45 times posing risk in debt servicing
- Unfavorable asset and fixed asset turnover ratios
- Slightly unfavorable overall financial ratios evaluation
Robinhood Weaknesses
- Unfavorable WACC at 14.43% increasing capital costs
- Elevated price-to-book ratio of 4.12 indicating possible overvaluation
- Unfavorable asset turnover at 0.11 reflecting lower revenue from assets
- Lack of dividend yield limits income for investors
- Neutral current ratio at 1.39 may require monitoring
Morgan Stanley’s strengths in diversification and global reach contrast with liquidity and efficiency challenges. Robinhood shows robust profitability and asset efficiency but faces cost of capital and valuation risks. These factors will influence their strategic financial management going forward.
The Moat Duel: Analyzing Competitive Defensibility
A structural moat is the only true defense against competitive erosion that can preserve long-term profits in dynamic markets:
Morgan Stanley: Diversified Financial Services Moat
I see Morgan Stanley’s moat rooted in its diversified wealth management and institutional services. It shows margin stability and solid revenue growth despite high interest expenses. Expansion in Asia and EMEA markets may deepen this moat.
Robinhood Markets, Inc.: User Growth and Platform Engagement Moat
Robinhood’s moat relies on user network effects and low-cost trading access, contrasting Morgan Stanley’s traditional model. Its explosive revenue and net margin growth fuel platform scale but value destruction signals caution. Innovation in crypto and education may expand reach.
Traditional Diversification vs. Disruptive Platform Scale
Morgan Stanley’s moat is broader and more durable, anchored in global reach and stable margins. Robinhood’s moat is narrower, tied to growth momentum but currently destroying value. Morgan Stanley is better positioned to defend its market share amid evolving industry pressures.
Which stock offers better returns?
Over the past year, Morgan Stanley and Robinhood Markets, Inc. showed significant price movements with contrasting recent trading dynamics and volume trends.
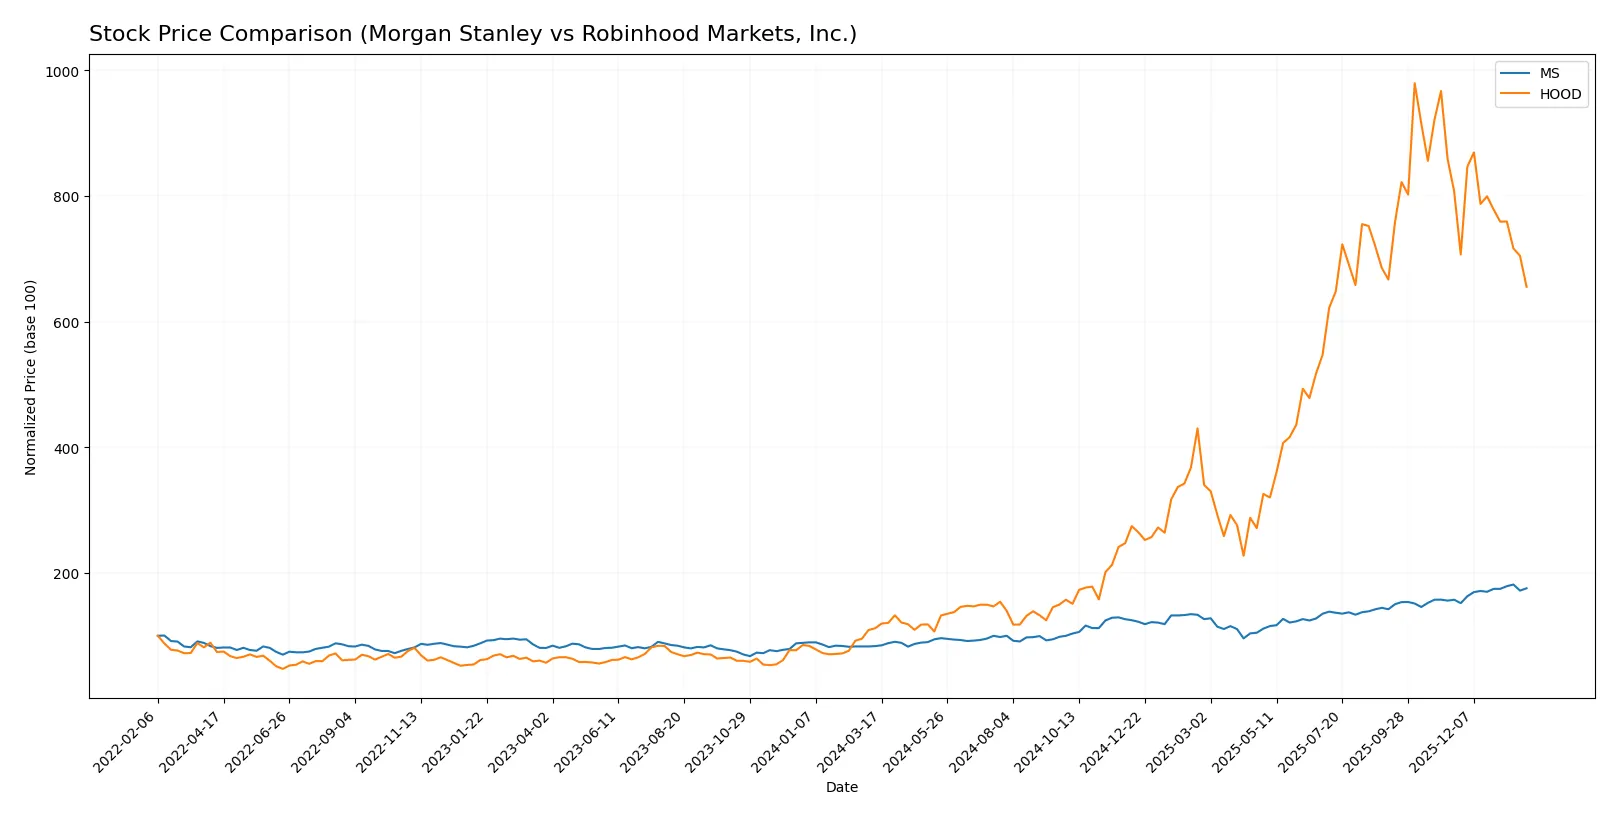
Trend Comparison
Morgan Stanley’s stock rose 110.02% over the last 12 months, showing a bullish trend with accelerating momentum and a high of 189.09. Volatility remains moderate with a 27.48 standard deviation.
Robinhood’s stock soared 485.18% in the same period, also bullish but with decelerating gains. It reached a high of 148.67, experiencing higher volatility at 41.47 standard deviation.
Morgan Stanley’s trend accelerated recently with an 11.56% gain, while Robinhood faced an 18.79% decline. Overall, Robinhood delivered stronger market performance over the year.
Target Prices
Analysts present a clear target consensus for Morgan Stanley and Robinhood Markets, reflecting varied growth expectations.
| Company | Target Low | Target High | Consensus |
|---|---|---|---|
| Morgan Stanley | 165 | 220 | 196 |
| Robinhood Markets, Inc. | 135 | 170 | 151.25 |
Morgan Stanley’s consensus target of 196 exceeds its current price of 182.8, suggesting upside potential. Robinhood’s target consensus at 151.25 significantly surpasses its 99.48 stock price, indicating bullish analyst sentiment.

Don’t Let Luck Decide Your Entry Point
Optimize your entry points with our advanced ProRealTime indicators. You’ll get efficient buy signals with precise price targets for maximum performance. Start outperforming now!
How do institutions grade them?
The following presents the latest institutional grades for Morgan Stanley and Robinhood Markets, Inc.:
Morgan Stanley Grades
Here are recent grades assigned by reputable financial institutions for Morgan Stanley:
| Grading Company | Action | New Grade | Date |
|---|---|---|---|
| Keefe, Bruyette & Woods | Maintain | Outperform | 2026-01-16 |
| JP Morgan | Maintain | Neutral | 2026-01-08 |
| Barclays | Maintain | Overweight | 2026-01-05 |
| Keefe, Bruyette & Woods | Maintain | Outperform | 2025-12-17 |
| Wolfe Research | Upgrade | Outperform | 2025-11-24 |
| JP Morgan | Maintain | Neutral | 2025-10-21 |
| Keefe, Bruyette & Woods | Maintain | Outperform | 2025-10-16 |
| Citigroup | Maintain | Neutral | 2025-10-16 |
| Jefferies | Maintain | Buy | 2025-10-16 |
| Evercore ISI Group | Maintain | Outperform | 2025-10-16 |
Robinhood Markets, Inc. Grades
Below are recent institutional grades assigned to Robinhood Markets, Inc.:
| Grading Company | Action | New Grade | Date |
|---|---|---|---|
| Needham | Maintain | Buy | 2026-01-28 |
| Barclays | Maintain | Overweight | 2026-01-08 |
| Morgan Stanley | Maintain | Equal Weight | 2025-12-22 |
| Barclays | Maintain | Overweight | 2025-12-12 |
| Cantor Fitzgerald | Maintain | Overweight | 2025-12-11 |
| B of A Securities | Maintain | Buy | 2025-12-10 |
| Needham | Maintain | Buy | 2025-12-05 |
| Needham | Maintain | Buy | 2025-11-26 |
| Citizens | Maintain | Market Outperform | 2025-11-07 |
| Mizuho | Maintain | Outperform | 2025-11-06 |
Which company has the best grades?
Morgan Stanley generally receives consistent “Outperform” and “Overweight” grades from major institutions, indicating steady confidence. Robinhood shows strong “Buy” and “Overweight” ratings but also a notable “Equal Weight” from Morgan Stanley itself. This mixed pattern suggests Morgan Stanley’s grades may offer more stable investor signals.
Risks specific to each company
The following categories identify the critical pressure points and systemic threats facing both firms in the 2026 market environment:
1. Market & Competition
Morgan Stanley
- Established player with diversified financial services faces intense competition from global banks and fintech startups.
Robinhood Markets, Inc.
- Aggressive growth but highly competitive fintech space with pressure from incumbents and new entrants disrupting brokerage models.
2. Capital Structure & Debt
Morgan Stanley
- Favorable debt ratios but weak interest coverage (0.45) signal potential strain servicing debt in tighter credit conditions.
Robinhood Markets, Inc.
- Moderate debt-to-assets (28.5%) with excellent interest coverage and manageable leverage, though debt-to-equity ratio is less favorable.
3. Stock Volatility
Morgan Stanley
- Beta 1.20 indicates moderate volatility typical for financial sector blue chips.
Robinhood Markets, Inc.
- High beta of 2.45 reflects elevated volatility and sensitivity to tech sector swings and market sentiment shifts.
4. Regulatory & Legal
Morgan Stanley
- Large global footprint increases exposure to complex financial regulations and compliance risks.
Robinhood Markets, Inc.
- Regulatory scrutiny on trading practices, crypto offerings, and user protection poses ongoing operational risks.
5. Supply Chain & Operations
Morgan Stanley
- Operational complexity from multiple business segments demands robust risk management and technology infrastructure.
Robinhood Markets, Inc.
- Dependence on platform stability and technology innovation; outages or security breaches could severely damage reputation.
6. ESG & Climate Transition
Morgan Stanley
- Active in sustainable finance initiatives but exposed to climate-related risks in lending and investment portfolios.
Robinhood Markets, Inc.
- Emerging ESG policies but less mature frameworks; transition risks tied to evolving investor and regulatory expectations.
7. Geopolitical Exposure
Morgan Stanley
- Significant global operations expose it to geopolitical tensions affecting capital markets and cross-border deals.
Robinhood Markets, Inc.
- Primarily U.S.-focused, limiting direct geopolitical risk but vulnerable to domestic policy shifts and market disruptions.
Which company shows a better risk-adjusted profile?
Morgan Stanley’s largest risk is its weak interest coverage, suggesting potential financial stress despite its scale. Robinhood faces significant market volatility and regulatory risks in an evolving fintech landscape. Given these factors, Robinhood demonstrates a better risk-adjusted profile, supported by its stronger profitability and moderate leverage. However, its high beta signals caution for risk-averse investors. Morgan Stanley’s distress-level Altman Z-score highlights structural financial vulnerabilities despite its diversified business model.
Final Verdict: Which stock to choose?
Morgan Stanley’s superpower lies in its resilience and steady cash generation amid market cycles. It demonstrates solid income growth and disciplined capital allocation. However, its weakening ROIC trend and liquidity concerns remain points of vigilance. It fits portfolios seeking stable income with moderate growth exposure.
Robinhood Markets’ strategic moat is its rapid revenue scaling supported by a digital-first platform and strong operating margins. It offers greater growth momentum and a healthier liquidity profile compared to Morgan Stanley. This stock suits investors focused on high-growth potential with tolerance for volatility.
If you prioritize consistent cash flow and defensive qualities, Morgan Stanley is the compelling choice due to its proven income stability and market presence. However, if you seek aggressive growth and are comfortable managing higher risk, Robinhood offers better upside with its expanding user base and innovation-driven model. Both present distinct analytical scenarios depending on investor appetite.
Disclaimer: Investment carries a risk of loss of initial capital. The past performance is not a reliable indicator of future results. Be sure to understand risks before making an investment decision.
Go Further
I encourage you to read the complete analyses of Morgan Stanley and Robinhood Markets, Inc. to enhance your investment decisions: