Home > Comparison > Financial Services > MS vs RJF
The strategic rivalry between Morgan Stanley and Raymond James Financial defines the current trajectory of the financial capital markets sector. Morgan Stanley operates as a global financial holding powerhouse with diversified institutional and wealth management services. In contrast, Raymond James Financial emphasizes personalized private client offerings and regional banking solutions. This analysis will determine which distinct operational model offers superior risk-adjusted returns for a diversified investment portfolio in today’s complex financial landscape.

Table of contents
Companies Overview
Morgan Stanley and Raymond James Financial, Inc. stand as influential players in the financial capital markets sector.
Morgan Stanley: Global Financial Powerhouse
Morgan Stanley dominates as a financial holding company offering capital markets, wealth management, and investment management services worldwide. Its core revenue streams come from underwriting securities, advisory services, sales and trading, and wealth management. In 2026, the firm strategically focuses on expanding its institutional securities and wealth management platforms to enhance client engagement and diversify revenue.
Raymond James Financial, Inc.: Diversified Financial Services Leader
Raymond James operates as a diversified financial services firm providing private client, capital markets, asset management, and banking services primarily in North America and Europe. It earns revenue through investment banking, portfolio management, brokerage, and banking products. The company’s 2026 focus centers on growing its private client group and expanding asset management offerings to deepen client relationships and increase fee-based income.
Strategic Collision: Similarities & Divergences
Both firms compete fiercely in capital markets and wealth management but differ in scale and approach. Morgan Stanley pursues a global, institutional-driven strategy with a broad product suite. Raymond James emphasizes a more regional, client-centric model focused on private clients and retail investors. The primary battleground remains wealth management and capital markets advisory. Their distinct footprints create varied investment profiles—Morgan Stanley as a large-scale global powerhouse, Raymond James as a nimble, diversified regional player.
Income Statement Comparison
This data dissects the core profitability and scalability of both corporate engines to reveal who dominates the bottom line:
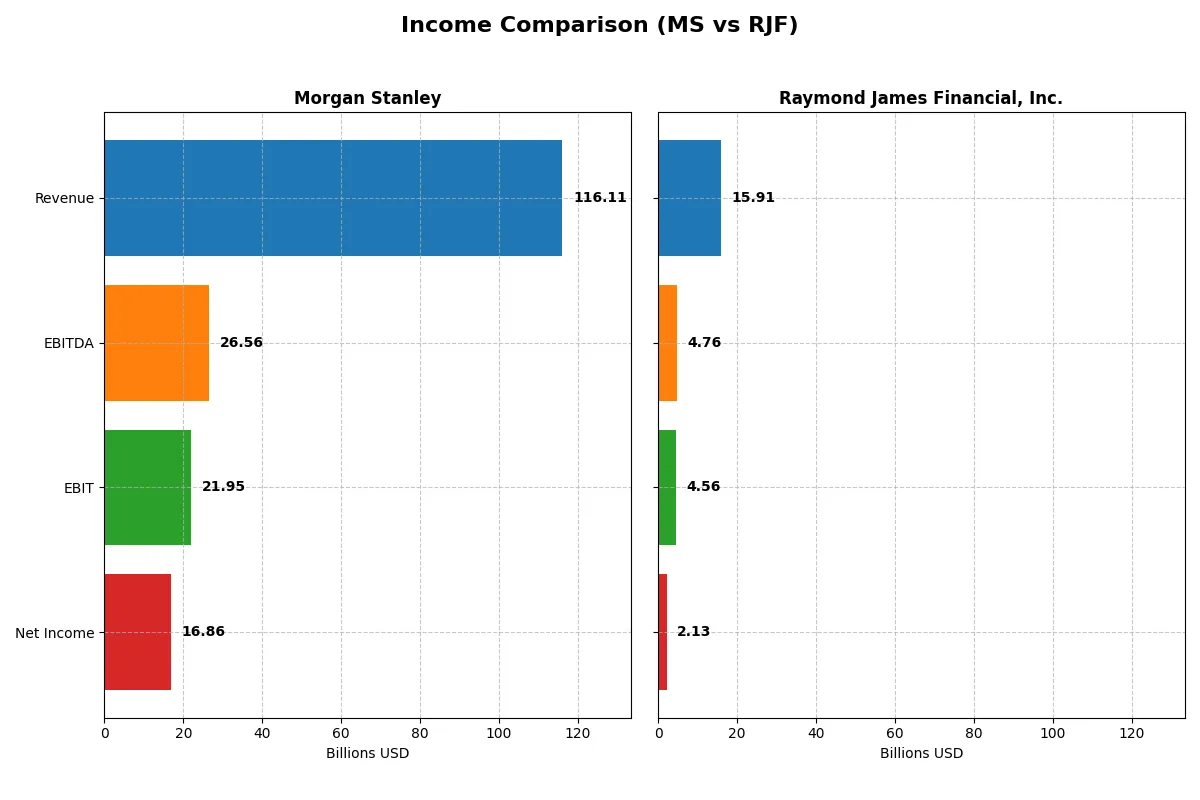
| Metric | Morgan Stanley (MS) | Raymond James Financial, Inc. (RJF) |
|---|---|---|
| Revenue | 116.1B | 15.9B |
| Cost of Revenue | 49.4B | 1.9B |
| Operating Expenses | 44.8B | 9.5B |
| Gross Profit | 66.7B | 14.0B |
| EBITDA | 26.6B | 4.8B |
| EBIT | 21.9B | 4.6B |
| Interest Expense | 49.0B | 1.8B |
| Net Income | 16.9B | 2.1B |
| EPS | 10.34 | 10.53 |
| Fiscal Year | 2025 | 2025 |
Income Statement Analysis: The Bottom-Line Duel
This income statement comparison unveils the true efficiency and profitability trajectory of two major financial firms over recent years.
Morgan Stanley Analysis
Morgan Stanley more than doubled its revenue from 2021 to 2025, reaching $116B in 2025. Net income grew steadily to $16.2B, reflecting strong margin control with a healthy gross margin of 57.5% and a net margin of 14.5%. Despite rising operating expenses, the firm’s EBIT margin improved to 18.9%, signaling enhanced operational efficiency and solid momentum.
Raymond James Financial, Inc. Analysis
Raymond James increased revenue by 63% over five years, hitting $15.9B in 2025. Net income surged 52% to $2.13B, supported by an exceptional gross margin of 88.2%. The firm boasts a superior EBIT margin at 28.7%, indicating robust profitability. However, net margin contracted slightly to 13.4%, reflecting rising interest expenses and some margin pressure.
Margin Power vs. Revenue Scale
Morgan Stanley dominates on revenue scale and maintains strong net income growth with consistent margin expansion. Raymond James excels in gross and EBIT margins but faces net margin compression. Morgan Stanley’s scale and improving margins offer a more compelling profile for investors seeking growth paired with profitability resilience.
Financial Ratios Comparison
These vital ratios act as a diagnostic tool to expose the underlying fiscal health, valuation premiums, and capital efficiency of the companies compared:
| Ratios | Morgan Stanley (MS) | Raymond James Financial, Inc. (RJF) |
|---|---|---|
| ROE | 12.8% (2024) | 17.1% (2025) |
| ROIC | 2.5% (2024) | 15.9% (2025) |
| P/E | 14.9 (2024) | 16.3 (2025) |
| P/B | 1.91 (2024) | 2.79 (2025) |
| Current Ratio | 0.66 (2024) | 0.32 (2025) |
| Quick Ratio | 0.66 (2024) | 0.32 (2025) |
| D/E | 3.45 (2024) | 0.36 (2025) |
| Debt-to-Assets | 29.7% (2024) | 5.2% (2025) |
| Interest Coverage | 0.39 (2024) | 2.47 (2025) |
| Asset Turnover | 0.08 (2024) | 0.18 (2025) |
| Fixed Asset Turnover | 4485 (2024) | 10.35 (2025) |
| Payout ratio | 46% (2024) | 19% (2025) |
| Dividend yield | 3.1% (2024) | 1.2% (2025) |
| Fiscal Year | 2024 | 2025 |
Efficiency & Valuation Duel: The Vital Signs
Financial ratios act as a company’s DNA, exposing operational strengths and hidden risks essential for prudent investment decisions.
Morgan Stanley
Morgan Stanley posts a strong net margin of 14.52%, signaling operational efficiency, but zero reported ROE and ROIC raise concerns about capital returns. Its P/E of 16.54 suggests a fairly valued stock. The 2.17% dividend yield rewards shareholders, reflecting a commitment to steady cash returns despite mixed profitability signals.
Raymond James Financial, Inc.
Raymond James delivers robust profitability with a 17.08% ROE and 15.88% ROIC, indicating effective capital use. Its P/E of 16.33 aligns with fair valuation. The lower 1.19% dividend yield, combined with favorable debt metrics and asset turnover, suggests a balanced approach between shareholder return and growth reinvestment.
Balanced Profitability vs. Dividend Yield Trade-Off
Raymond James offers superior returns on equity and invested capital with a slightly favorable ratio profile, implying stronger operational efficiency. Morgan Stanley provides a higher dividend yield but lacks capital return metrics. Investors prioritizing growth may prefer Raymond James, while income-focused ones might tilt toward Morgan Stanley.
Which one offers the Superior Shareholder Reward?
Morgan Stanley (MS) offers a higher dividend yield around 3.07% in 2025, with a payout ratio near 46%, indicating a moderate commitment to returning cash to shareholders. MS also maintains a meaningful share buyback program, enhancing total return. Raymond James Financial (RJF) pays a lower yield around 1.19% with a conservative payout ratio near 19%, prioritizing retained earnings for growth and capital stability. RJF’s buybacks are less aggressive but consistent, reflecting prudent capital allocation. Historically, MS’s higher yield and buybacks provide a stronger immediate income plus capital return, but RJF’s model supports sustainability with lower payout stress and reinvestment potential. In 2026, I find Morgan Stanley offers the more attractive total return profile for income-focused investors, while RJF suits those favoring growth with lower risk.
Comparative Score Analysis: The Strategic Profile
The radar chart reveals the core financial DNA and trade-offs defining Morgan Stanley and Raymond James Financial, Inc.:
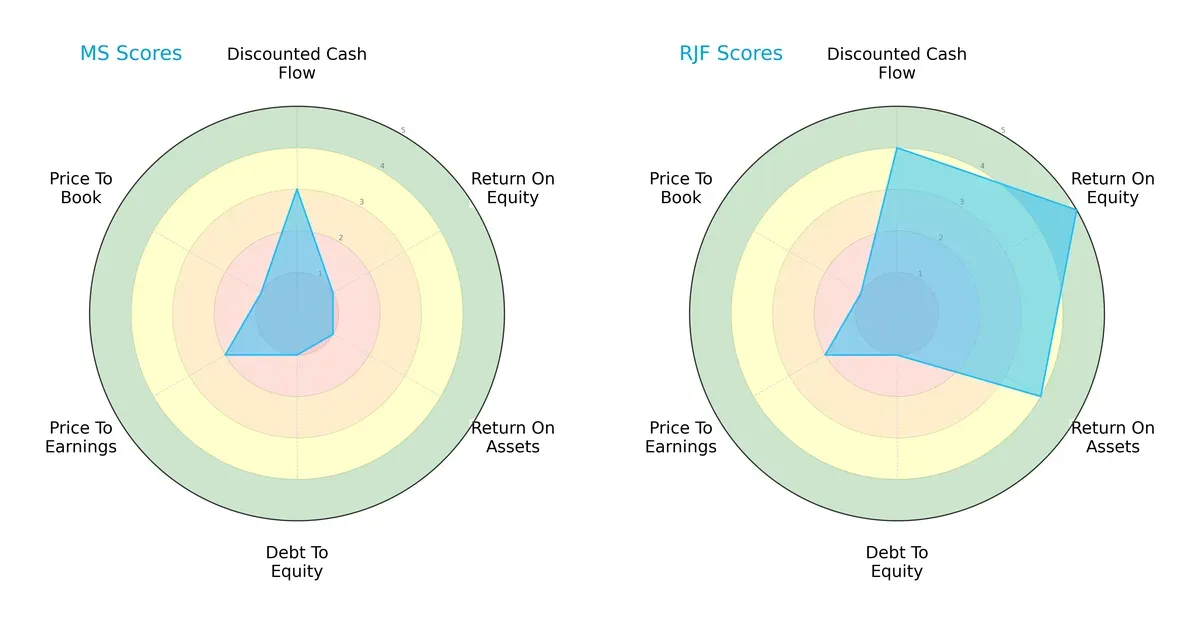
Raymond James shows clear strength in ROE (5 vs. 1) and ROA (4 vs. 1), signaling superior profitability and asset efficiency. Its DCF score (4 vs. 3) also suggests better valuation from cash flow perspectives. Both firms share a weak debt-to-equity score (1), highlighting leverage concerns. Morgan Stanley’s profile is unbalanced, relying on moderate DCF, while Raymond James offers a more robust, diversified financial performance.
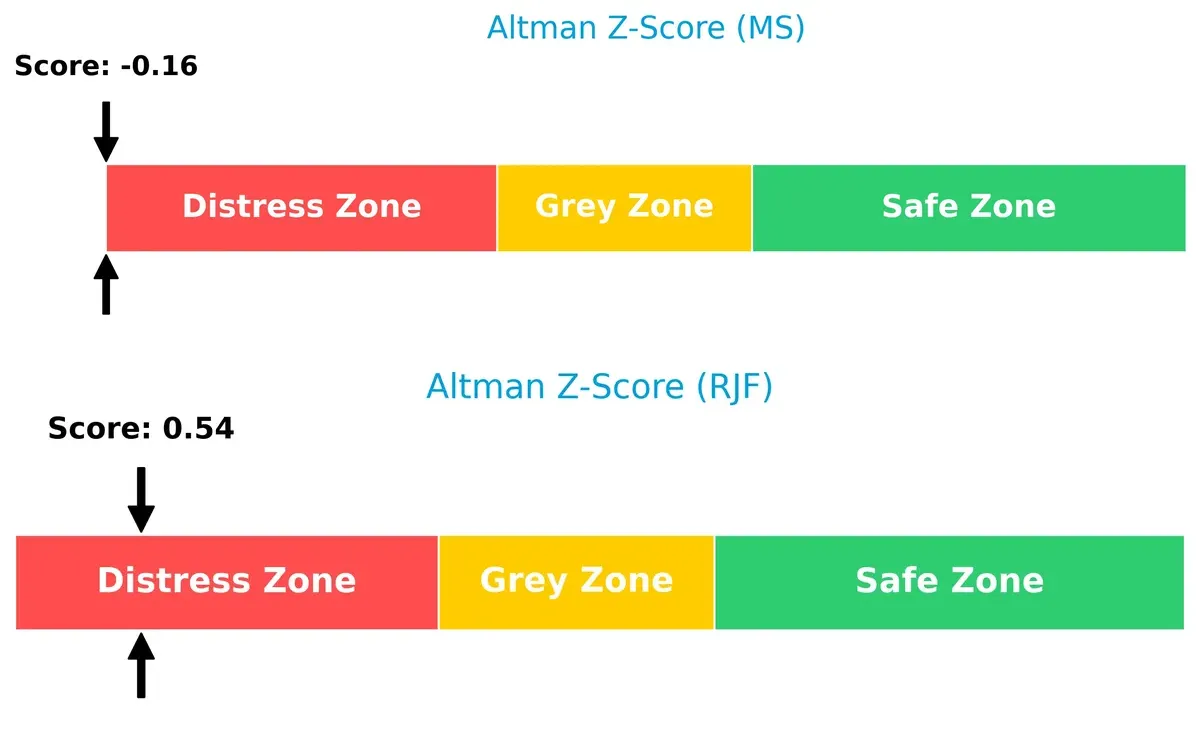
Bankruptcy Risk: Solvency Showdown
Morgan Stanley’s Altman Z-Score (-0.16) trails Raymond James’ 0.54, placing both in the distress zone but signaling higher insolvency risk for Morgan Stanley in this cycle:
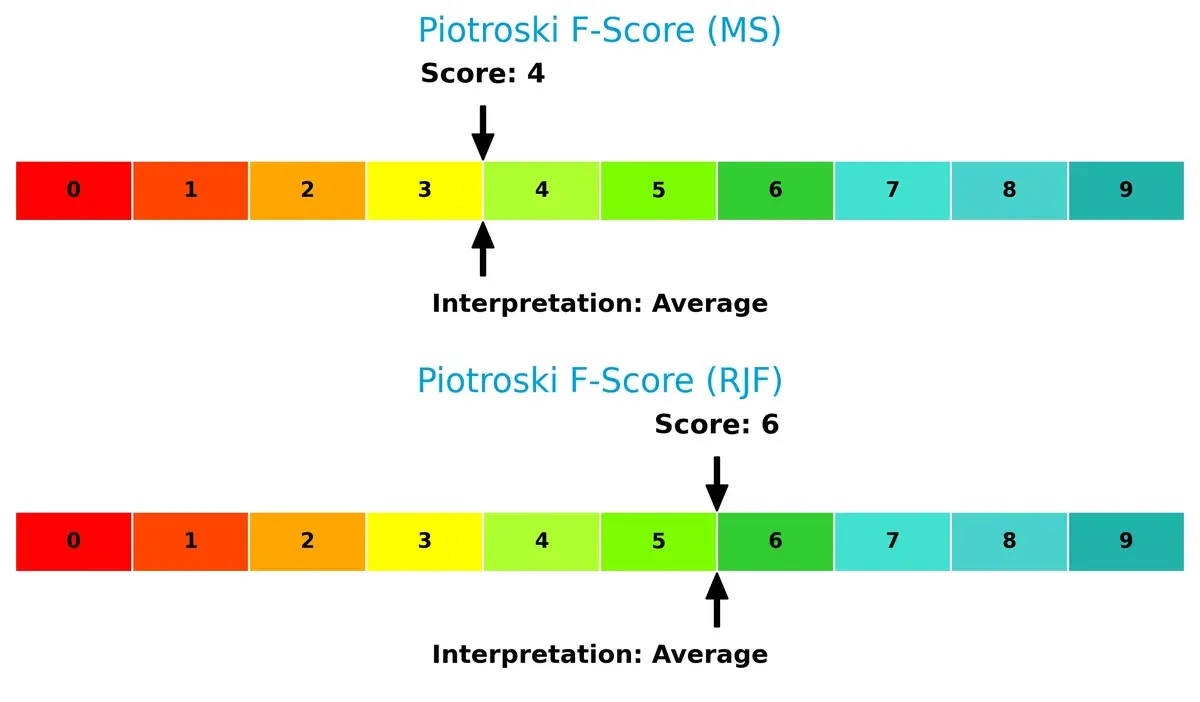
Financial Health: Quality of Operations
Raymond James scores a 6 on the Piotroski F-Score, moderately outperforming Morgan Stanley’s 4. Both firms show average financial health, but Morgan Stanley’s lower score raises mild red flags in operational quality:
How are the two companies positioned?
This section dissects the operational DNA of Morgan Stanley and Raymond James by comparing revenue distribution and internal strengths and weaknesses. The goal is to confront their economic moats and identify which model offers the most resilient, sustainable competitive advantage today.
Revenue Segmentation: The Strategic Mix
The following visual comparison dissects how both firms diversify their income streams and where their primary sector bets lie:
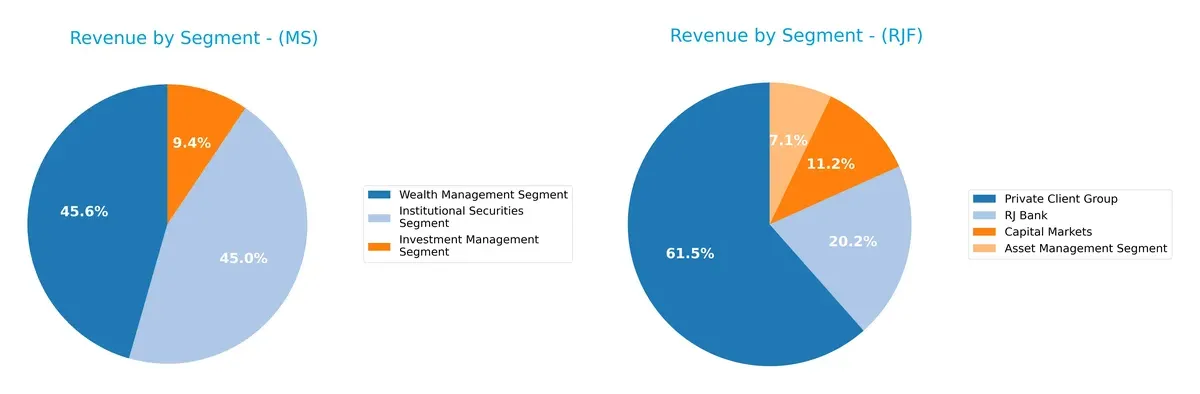
Morgan Stanley balances its revenue between Institutional Securities ($28.1B) and Wealth Management ($28.4B), with smaller Investment Management ($5.9B). Raymond James leans heavily on Private Client Group ($10.3B), followed by RJ Bank ($3.4B) and Capital Markets ($1.9B). Morgan Stanley’s near-equal top segments suggest ecosystem lock-in, while Raymond James’ concentration in Private Client Group signals potential concentration risk but strong retail focus.
Strengths and Weaknesses Comparison
This table compares the Strengths and Weaknesses of Morgan Stanley and Raymond James Financial, Inc.:
Morgan Stanley Strengths
- Diversified revenue from Institutional Securities, Wealth, and Investment Management
- Strong global presence in Americas, Asia, and EMEA
- Favorable net margin and dividend yield
- Low debt-to-assets ratio reflects conservative leverage
Raymond James Financial, Inc. Strengths
- Favorable profitability metrics including ROE and ROIC
- Strong fixed asset turnover indicates efficient asset use
- Diversified segments including Private Client, Capital Markets, and RJ Bank
- Slightly favorable global ratios suggest overall financial health
Morgan Stanley Weaknesses
- Unfavorable ROE, ROIC, and liquidity ratios raise concerns
- Interest coverage ratio is very low, indicating risk in debt servicing
- Unfavorable asset turnover metrics suggest inefficiency
- Slightly unfavorable overall financial ratios
Raymond James Financial, Inc. Weaknesses
- Unfavorable current and quick ratios indicate liquidity risk
- WACC higher than ROIC may pressure capital returns
- Neutral interest coverage ratio could imply moderate risk
- Asset turnover ratio remains low, limiting operational leverage
Morgan Stanley shows strengths in diversification and global reach but faces challenges in profitability and liquidity. Raymond James delivers stronger profitability and asset efficiency, yet liquidity and capital cost remain areas to monitor. Both companies need to address specific financial weaknesses to enhance strategic resilience.
The Moat Duel: Analyzing Competitive Defensibility
A structural moat shields long-term profits from relentless competition erosion. Let’s dissect the core moats defining Morgan Stanley and Raymond James Financial:
Morgan Stanley: Diversified Global Scale Moat
Morgan Stanley’s moat stems from its expansive global footprint and diversified wealth management and institutional services. This breadth supports steady margins and 12.6% revenue growth in 2025. However, declining ROIC signals potential threats to long-term capital efficiency in 2026.
Raymond James Financial: Focused Client-Centric Moat
Raymond James relies on strong client relationships and efficient capital allocation, reflected in a very favorable ROIC exceeding WACC by nearly 4.7%. Unlike Morgan Stanley, RJF’s growing ROIC and 72.6% EBIT growth show deepening profitability and operational leverage heading into 2026.
Global Reach vs. Capital Efficiency: The Moat Showdown
Morgan Stanley’s broad diversification creates a wide moat but faces pressure on capital returns. Raymond James builds a deeper, more durable moat through superior ROIC and client focus. I believe Raymond James is better positioned to defend and grow its market share amid evolving industry dynamics.
Which stock offers better returns?
Over the past year, both Morgan Stanley and Raymond James Financial showed strong price appreciation, with Morgan Stanley demonstrating a more pronounced upward trajectory and trading dynamics.
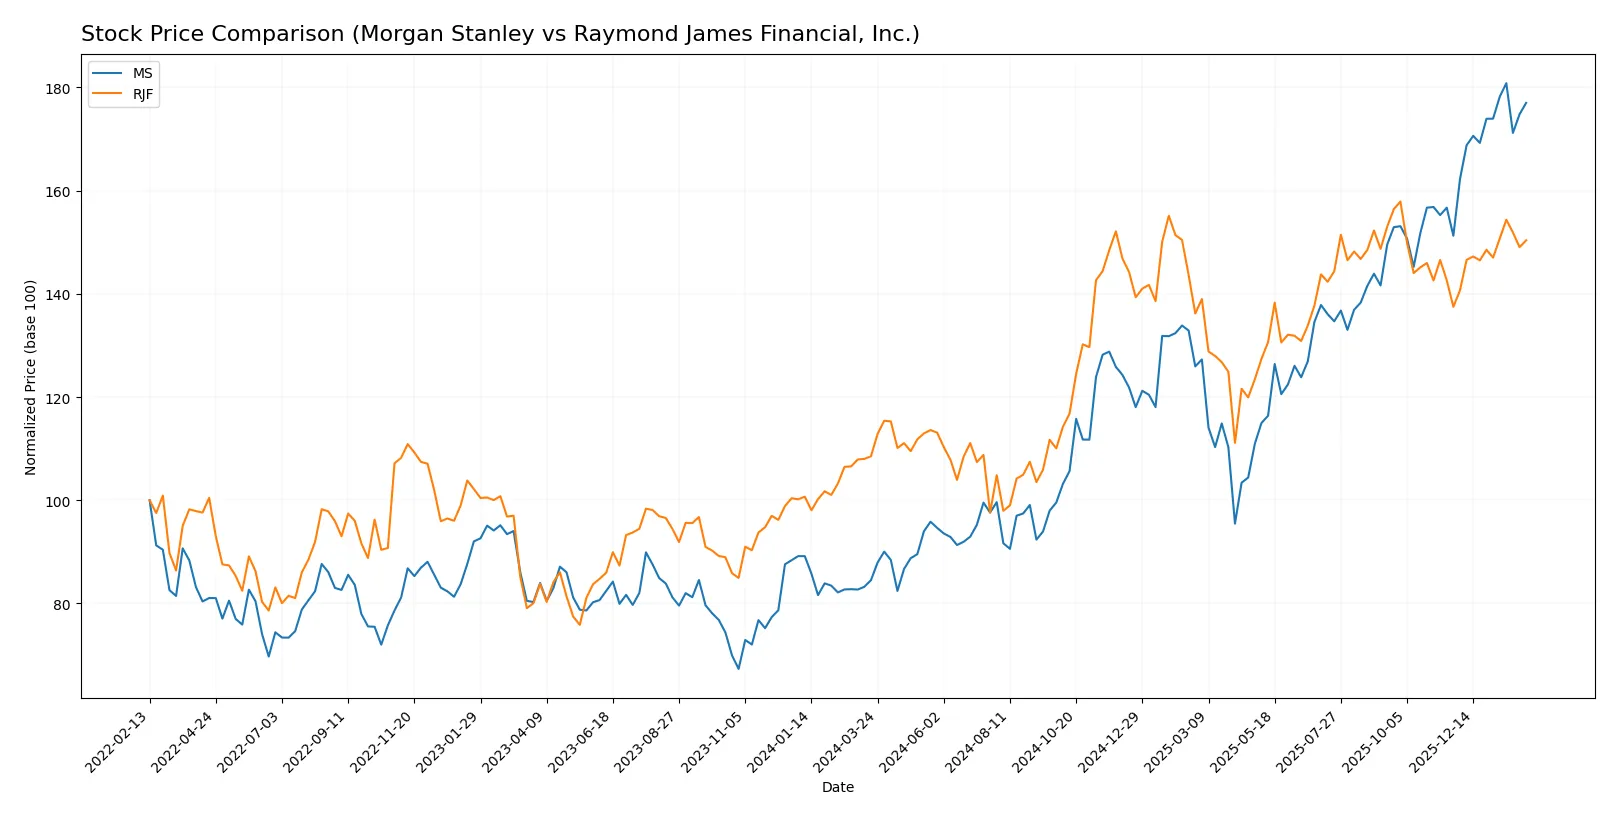
Trend Comparison
Morgan Stanley’s stock gained 109.44% over the last 12 months, maintaining a bullish trend with accelerating momentum and a high volatility of 27.75%. It reached a peak price of 189.09.
Raymond James Financial’s stock rose 38.57% during the same period, also bullish with acceleration but lower volatility at 19.41%. Its highest price was 175.69, well above its 12-month low.
Morgan Stanley delivered markedly stronger returns than Raymond James Financial, outperforming it by over 70 percentage points in price appreciation.
Target Prices
Analysts project a bullish outlook for Morgan Stanley and Raymond James Financial, reflecting confidence in their capital markets positioning.
| Company | Target Low | Target High | Consensus |
|---|---|---|---|
| Morgan Stanley | 165 | 220 | 196 |
| Raymond James Financial, Inc. | 176 | 198 | 187 |
The target consensus for Morgan Stanley stands 6% above its current price of 185.09, signaling moderate upside. Raymond James’ consensus exceeds its 167.34 share price by about 12%, indicating stronger expected growth.

Don’t Let Luck Decide Your Entry Point
Optimize your entry points with our advanced ProRealTime indicators. You’ll get efficient buy signals with precise price targets for maximum performance. Start outperforming now!
How do institutions grade them?
This section summarizes the latest institutional grades for Morgan Stanley and Raymond James Financial, Inc.:
Morgan Stanley Grades
The table below shows recent institutional grades for Morgan Stanley from reputable firms.
| Grading Company | Action | New Grade | Date |
|---|---|---|---|
| Keefe, Bruyette & Woods | Maintain | Outperform | 2026-01-16 |
| JP Morgan | Maintain | Neutral | 2026-01-08 |
| Barclays | Maintain | Overweight | 2026-01-05 |
| Keefe, Bruyette & Woods | Maintain | Outperform | 2025-12-17 |
| Wolfe Research | Upgrade | Outperform | 2025-11-24 |
| JP Morgan | Maintain | Neutral | 2025-10-21 |
| Keefe, Bruyette & Woods | Maintain | Outperform | 2025-10-16 |
| Citigroup | Maintain | Neutral | 2025-10-16 |
| Jefferies | Maintain | Buy | 2025-10-16 |
| Evercore ISI Group | Maintain | Outperform | 2025-10-16 |
Raymond James Financial, Inc. Grades
The table below details recent institutional grades for Raymond James Financial, Inc.
| Grading Company | Action | New Grade | Date |
|---|---|---|---|
| TD Cowen | Maintain | Hold | 2026-01-14 |
| Morgan Stanley | Maintain | Equal Weight | 2025-12-22 |
| B of A Securities | Maintain | Neutral | 2025-12-10 |
| JMP Securities | Maintain | Market Outperform | 2025-10-23 |
| BMO Capital | Maintain | Market Perform | 2025-10-23 |
| JP Morgan | Maintain | Neutral | 2025-10-23 |
| Keefe, Bruyette & Woods | Maintain | Market Perform | 2025-10-23 |
| TD Cowen | Maintain | Hold | 2025-10-23 |
| JMP Securities | Maintain | Market Outperform | 2025-10-09 |
| JP Morgan | Maintain | Neutral | 2025-10-07 |
Which company has the best grades?
Morgan Stanley consistently receives higher grades such as Outperform and Overweight, while Raymond James mostly earns Hold and Neutral ratings. This suggests stronger institutional confidence in Morgan Stanley’s near-term prospects.
Risks specific to each company
In the complex 2026 market environment, these categories highlight the critical pressure points and systemic threats facing Morgan Stanley and Raymond James Financial, Inc.:
1. Market & Competition
Morgan Stanley
- Faces intense competition in institutional securities and wealth management, pressured by fintech disruption and margin compression.
Raymond James Financial, Inc.
- Competes mainly in private client and capital markets segments, with challenges from larger firms and evolving client expectations.
2. Capital Structure & Debt
Morgan Stanley
- Shows favorable debt-to-equity ratio but weak interest coverage at 0.45, signaling risk in servicing debt under stress.
Raymond James Financial, Inc.
- Maintains moderate debt load (D/E 0.36) with better interest coverage (2.47), indicating more manageable leverage risk.
3. Stock Volatility
Morgan Stanley
- Exhibits higher beta at 1.197, implying greater sensitivity to market swings and risk exposure.
Raymond James Financial, Inc.
- Lower beta of 0.996 suggests more stable stock price behavior relative to market fluctuations.
4. Regulatory & Legal
Morgan Stanley
- Large global footprint exposes it to complex regulatory regimes and compliance costs across multiple jurisdictions.
Raymond James Financial, Inc.
- Primarily US and Canada-focused, facing comparatively lower regulatory complexity but still vulnerable to evolving financial regulations.
5. Supply Chain & Operations
Morgan Stanley
- Operational risks stem from reliance on technology platforms and global trading infrastructure.
Raymond James Financial, Inc.
- Operational risk includes integration of private equity and banking services, with moderate scale limiting systemic risk.
6. ESG & Climate Transition
Morgan Stanley
- Increasing pressure to align investment products with ESG criteria and reduce carbon footprint in asset management.
Raymond James Financial, Inc.
- Progressing ESG initiatives but smaller scale may limit influence and adaptability to climate-related regulatory demands.
7. Geopolitical Exposure
Morgan Stanley
- Extensive international operations expose it to geopolitical tensions, trade disruptions, and currency risks.
Raymond James Financial, Inc.
- More domestically focused, thus relatively insulated from direct geopolitical shocks but not immune to global market effects.
Which company shows a better risk-adjusted profile?
Morgan Stanley’s most impactful risk is its weak interest coverage and financial distress indicators, signaling vulnerability under capital strain. Raymond James’ key risk lies in its moderate debt load and regulatory challenges. Overall, Raymond James exhibits a stronger risk-adjusted profile, supported by more favorable leverage metrics and lower stock volatility. Its recent moderate Altman Z-Score above Morgan Stanley’s negative value confirms better financial stability.
Final Verdict: Which stock to choose?
Morgan Stanley’s superpower lies in its robust revenue growth and strong net margins, signaling efficient profitability in a challenging financial landscape. Its key point of vigilance is the declining ROIC trend, which raises questions about capital allocation effectiveness. This stock suits aggressive growth portfolios willing to tolerate operational risks.
Raymond James Financial stands out with a durable competitive moat, reflected in growing ROIC well above its cost of capital. Its solid return metrics and safer financial profile relative to Morgan Stanley make it attractive for investors seeking stability. It fits well in a GARP (Growth at a Reasonable Price) strategy.
If you prioritize rapid expansion and can navigate operational uncertainties, Morgan Stanley offers compelling upside through its top-line momentum. However, if you seek a more stable investment with a proven value-creating moat and improving profitability, Raymond James outshines as the more prudent choice. Both appeal to different investor avatars balancing growth and risk.
Disclaimer: Investment carries a risk of loss of initial capital. The past performance is not a reliable indicator of future results. Be sure to understand risks before making an investment decision.
Go Further
I encourage you to read the complete analyses of Morgan Stanley and Raymond James Financial, Inc. to enhance your investment decisions: